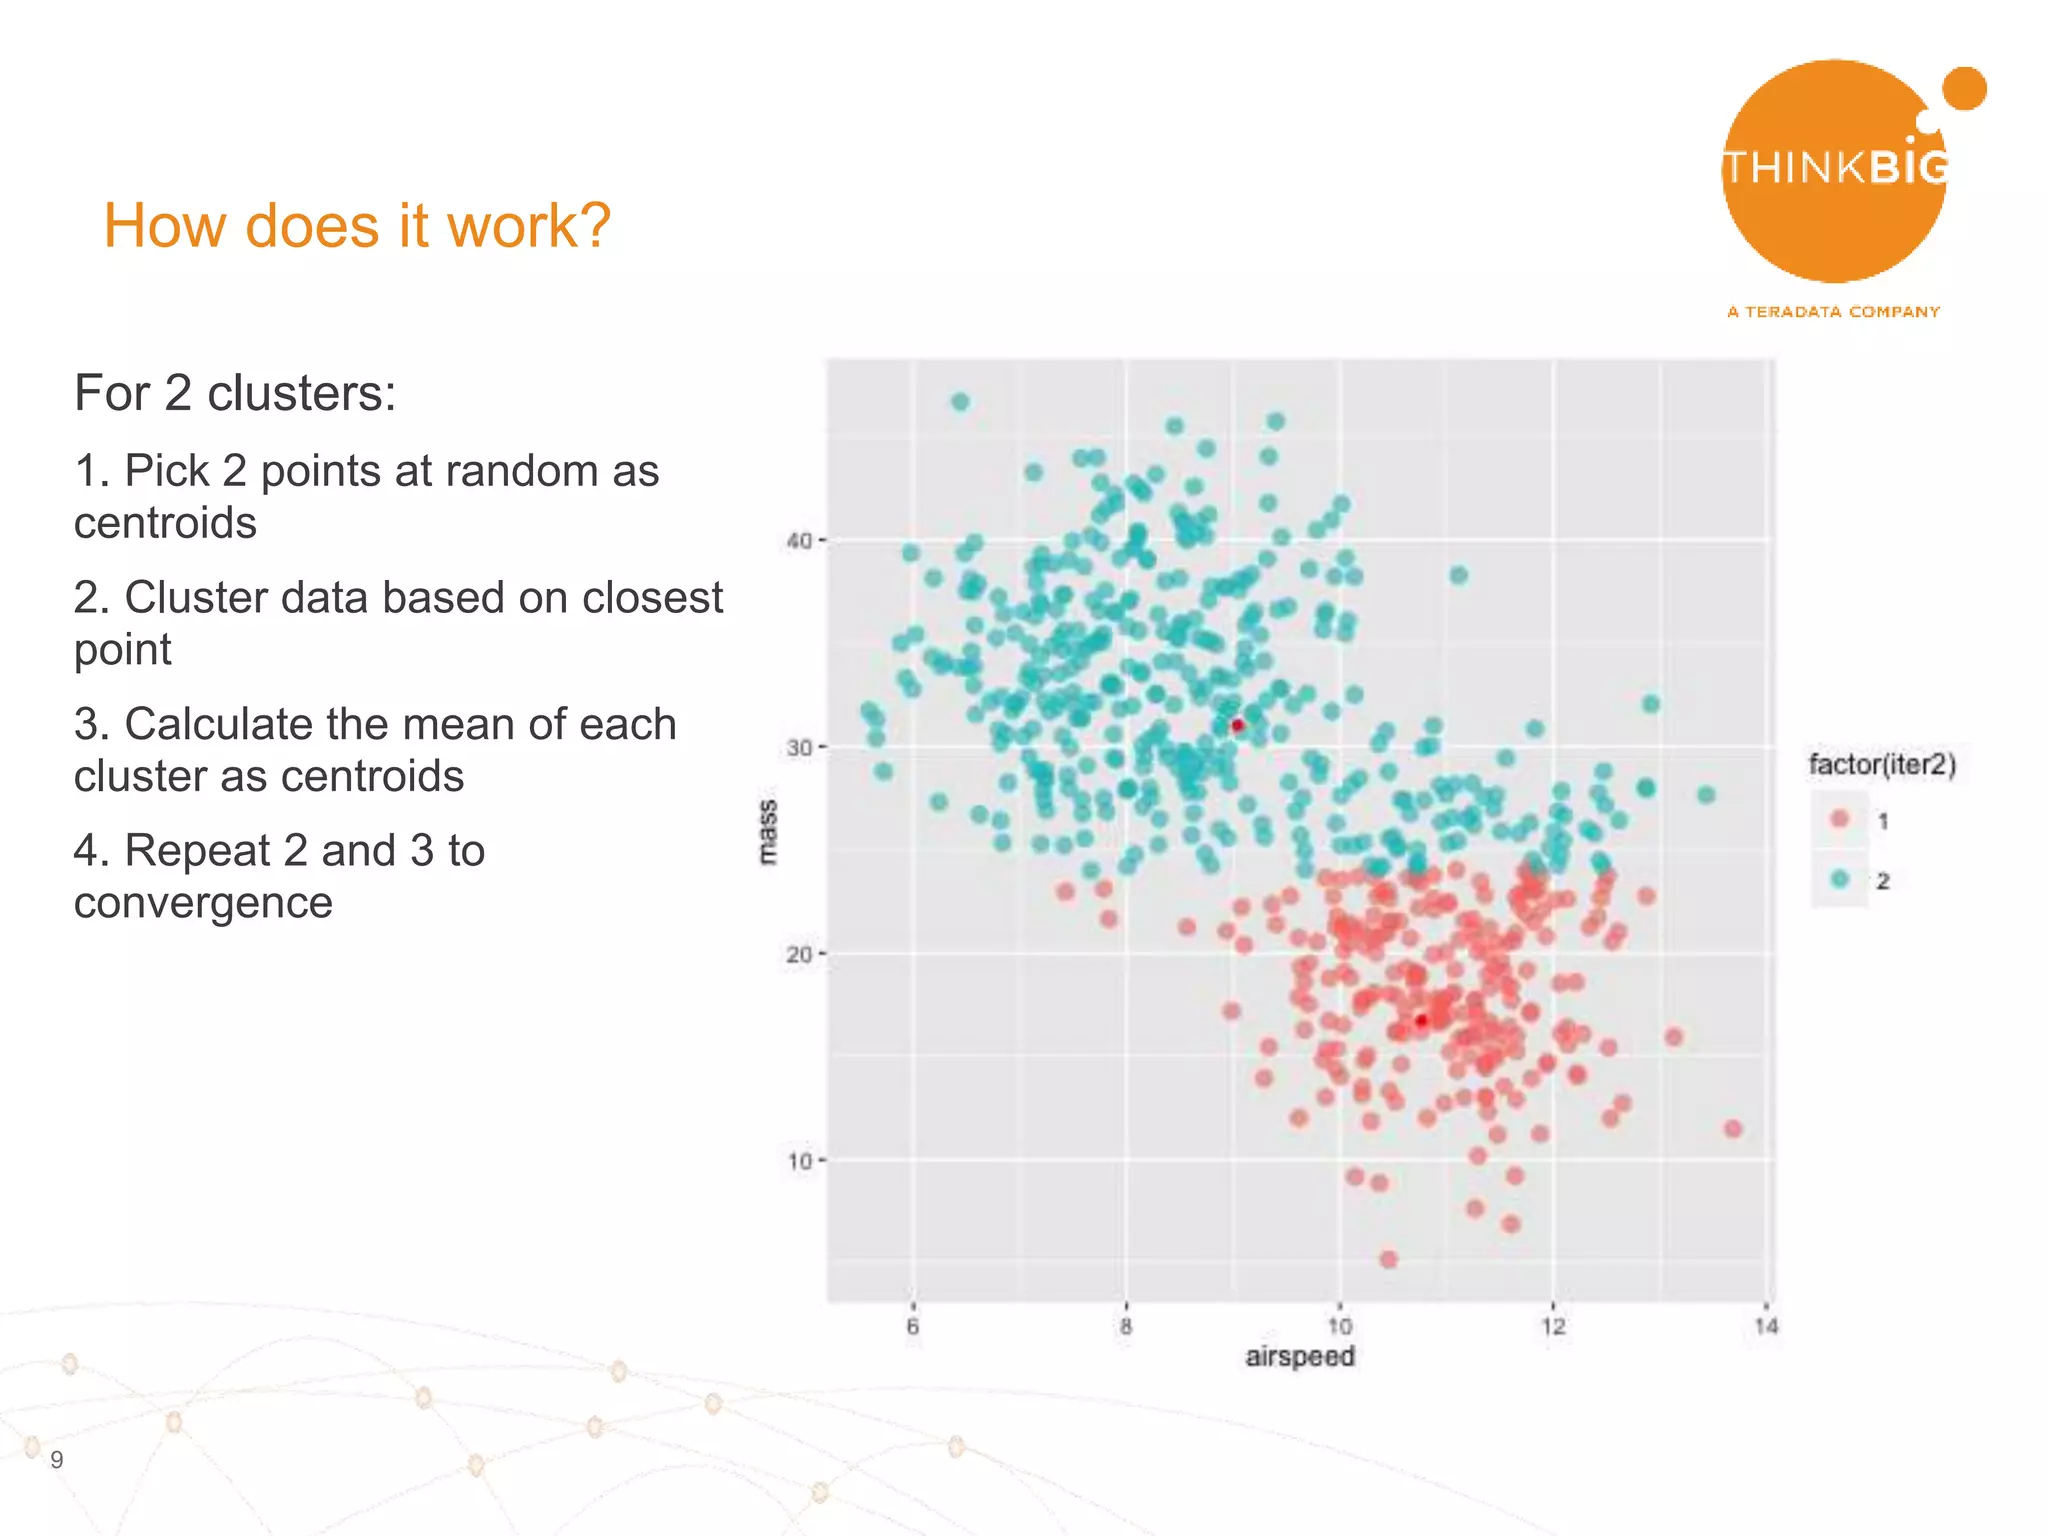
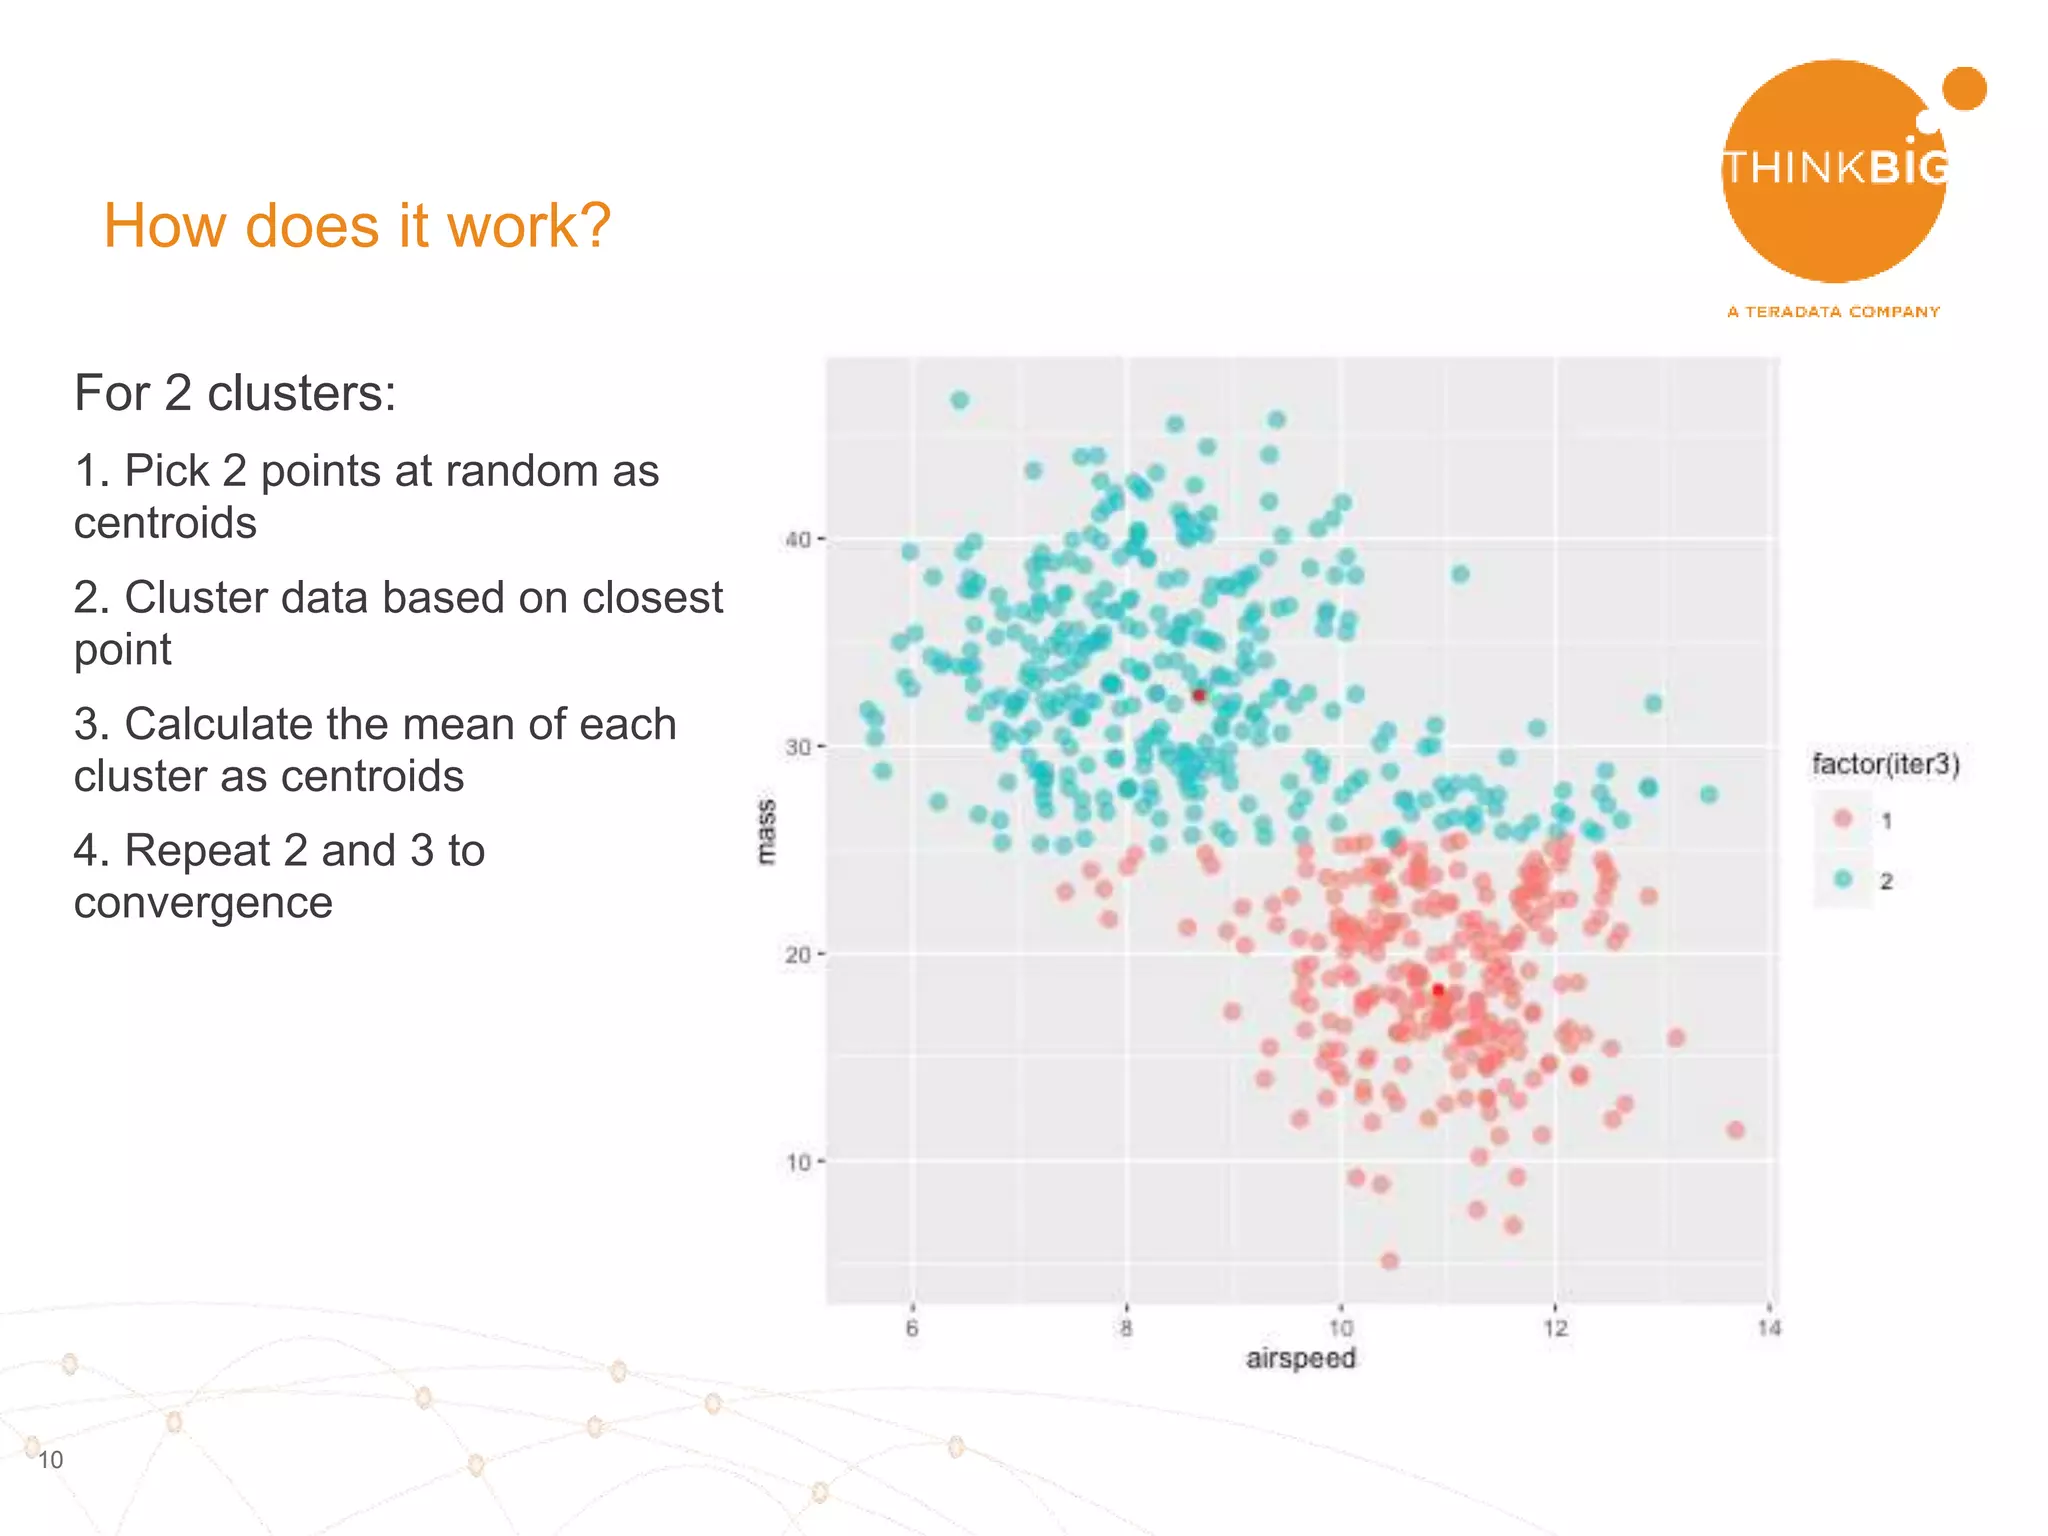
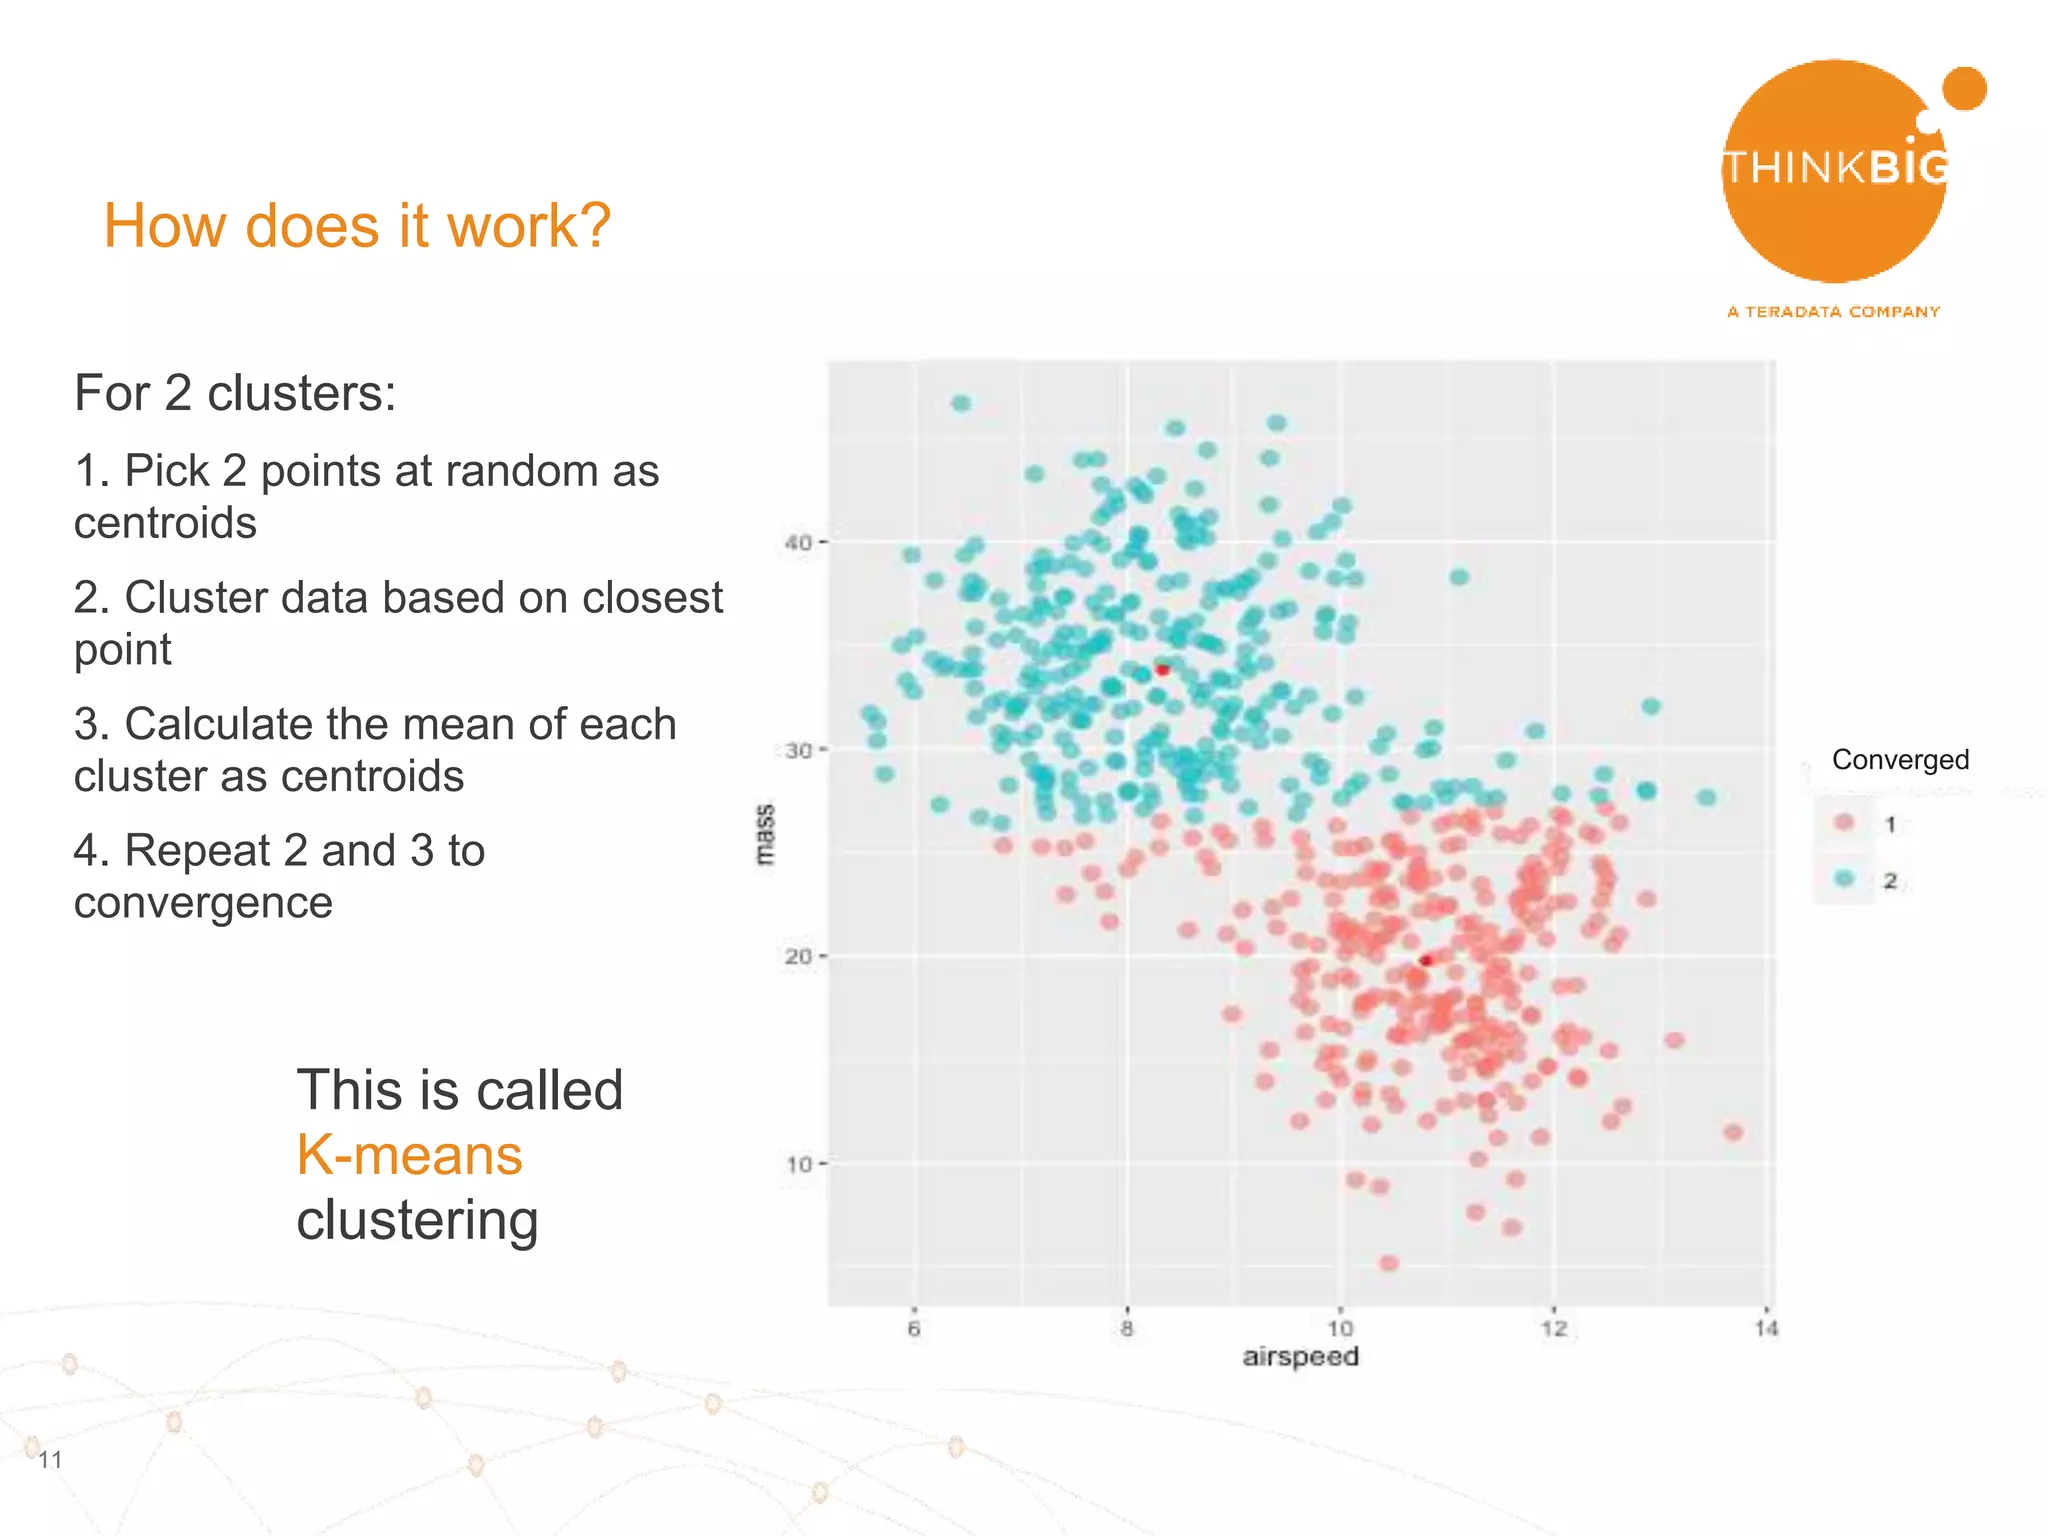
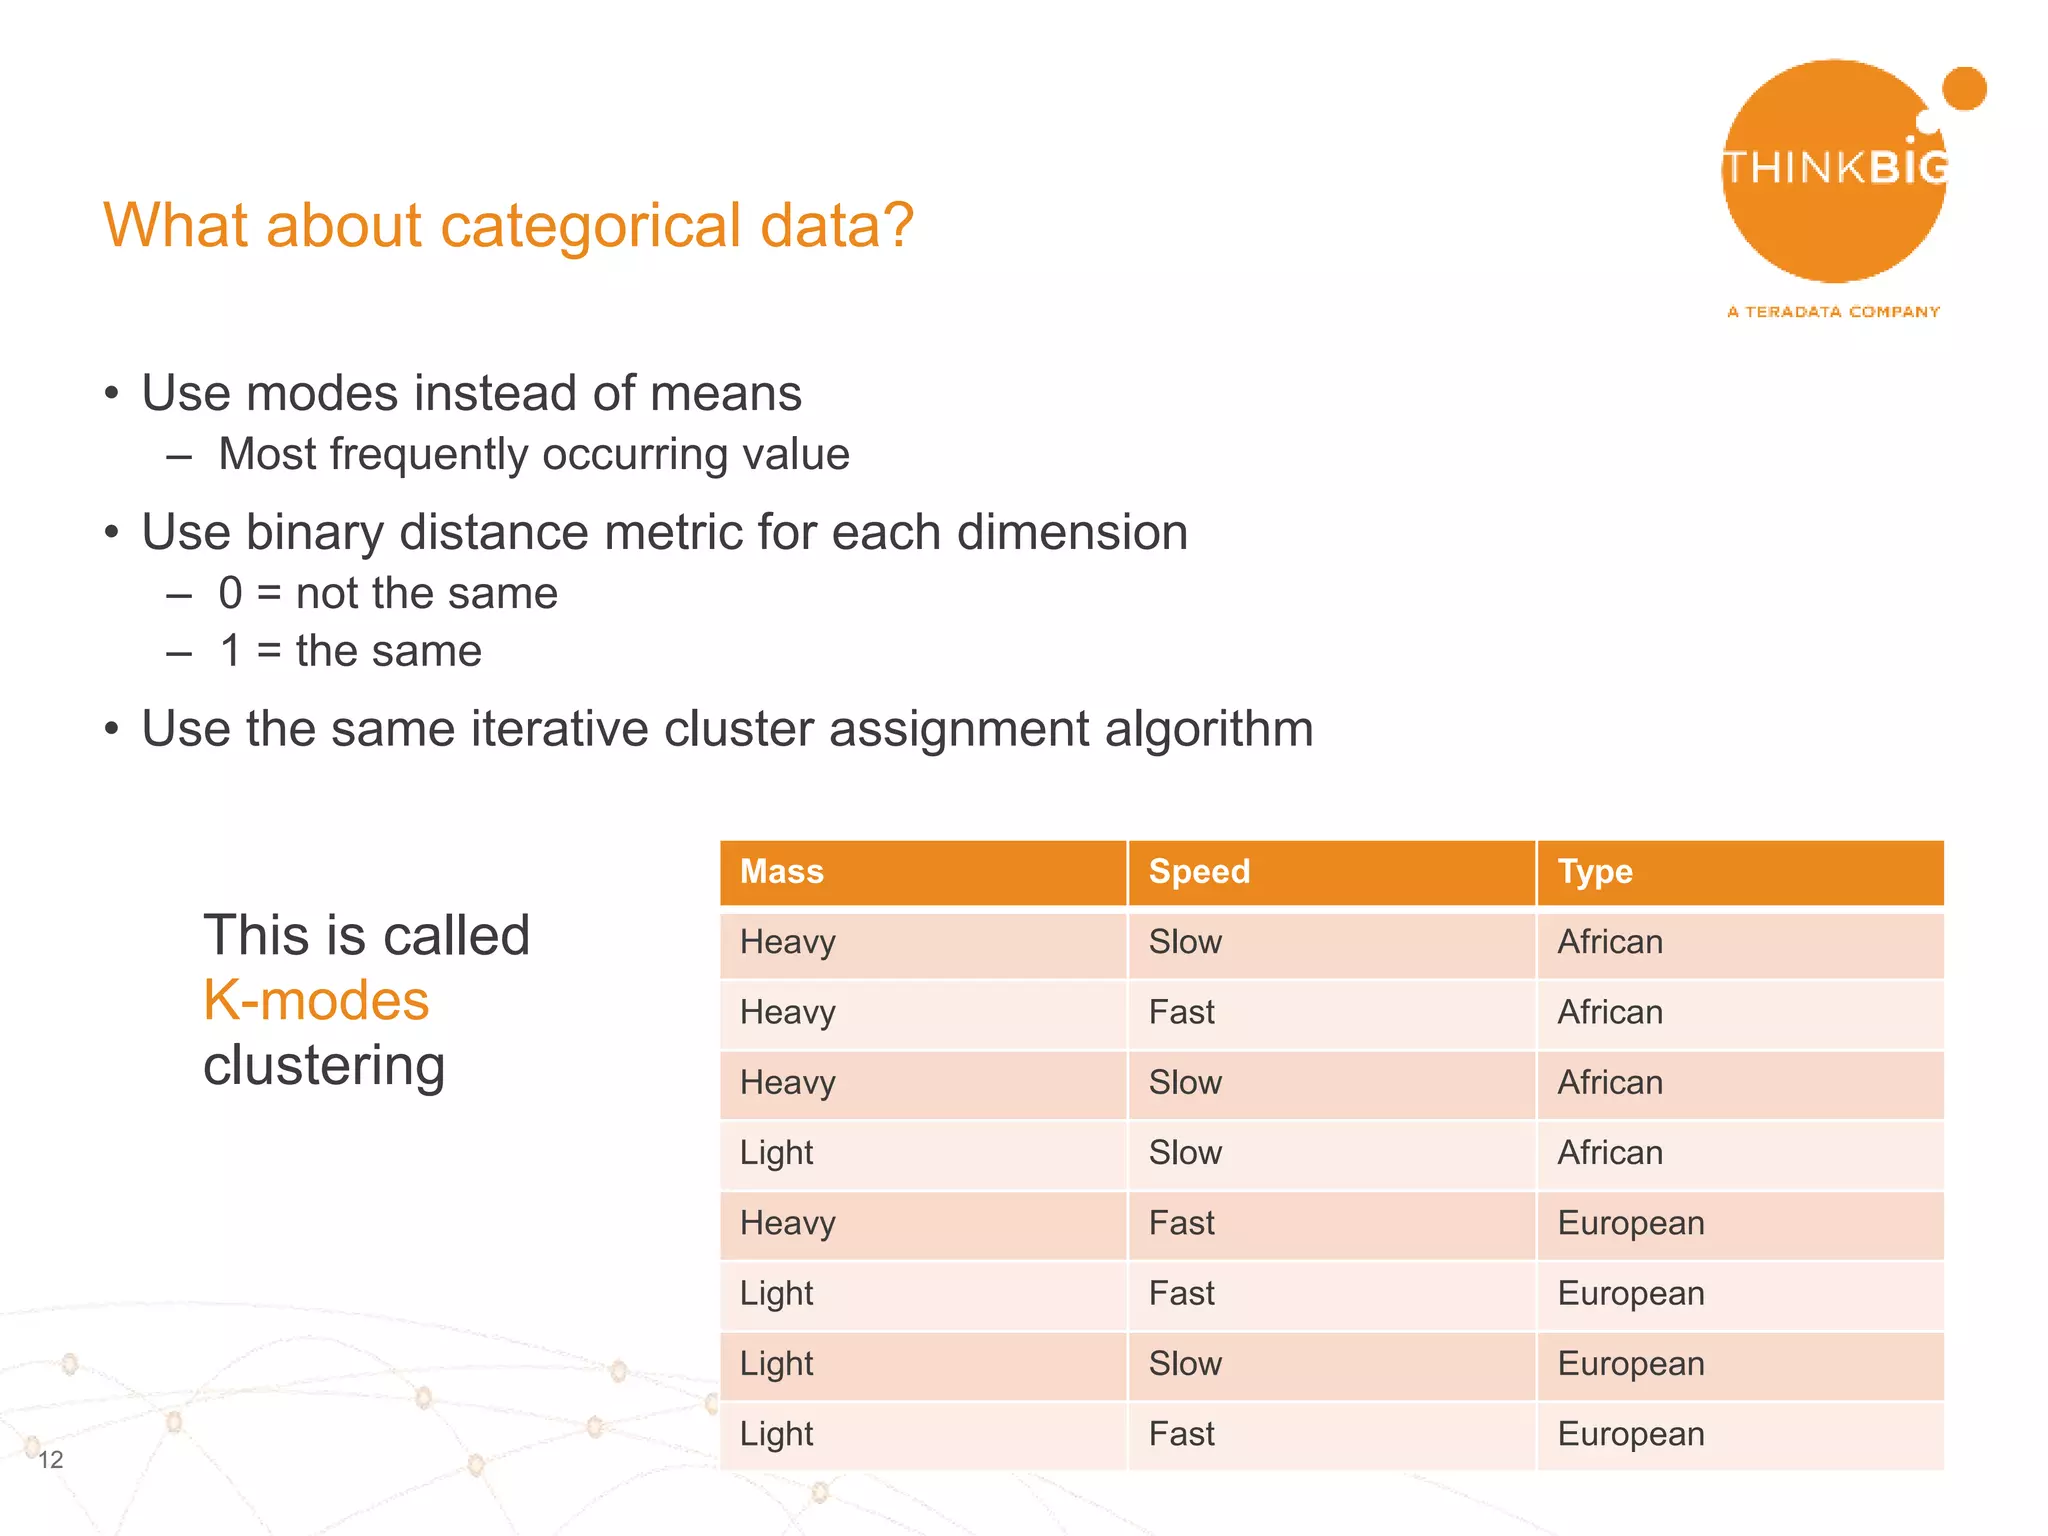
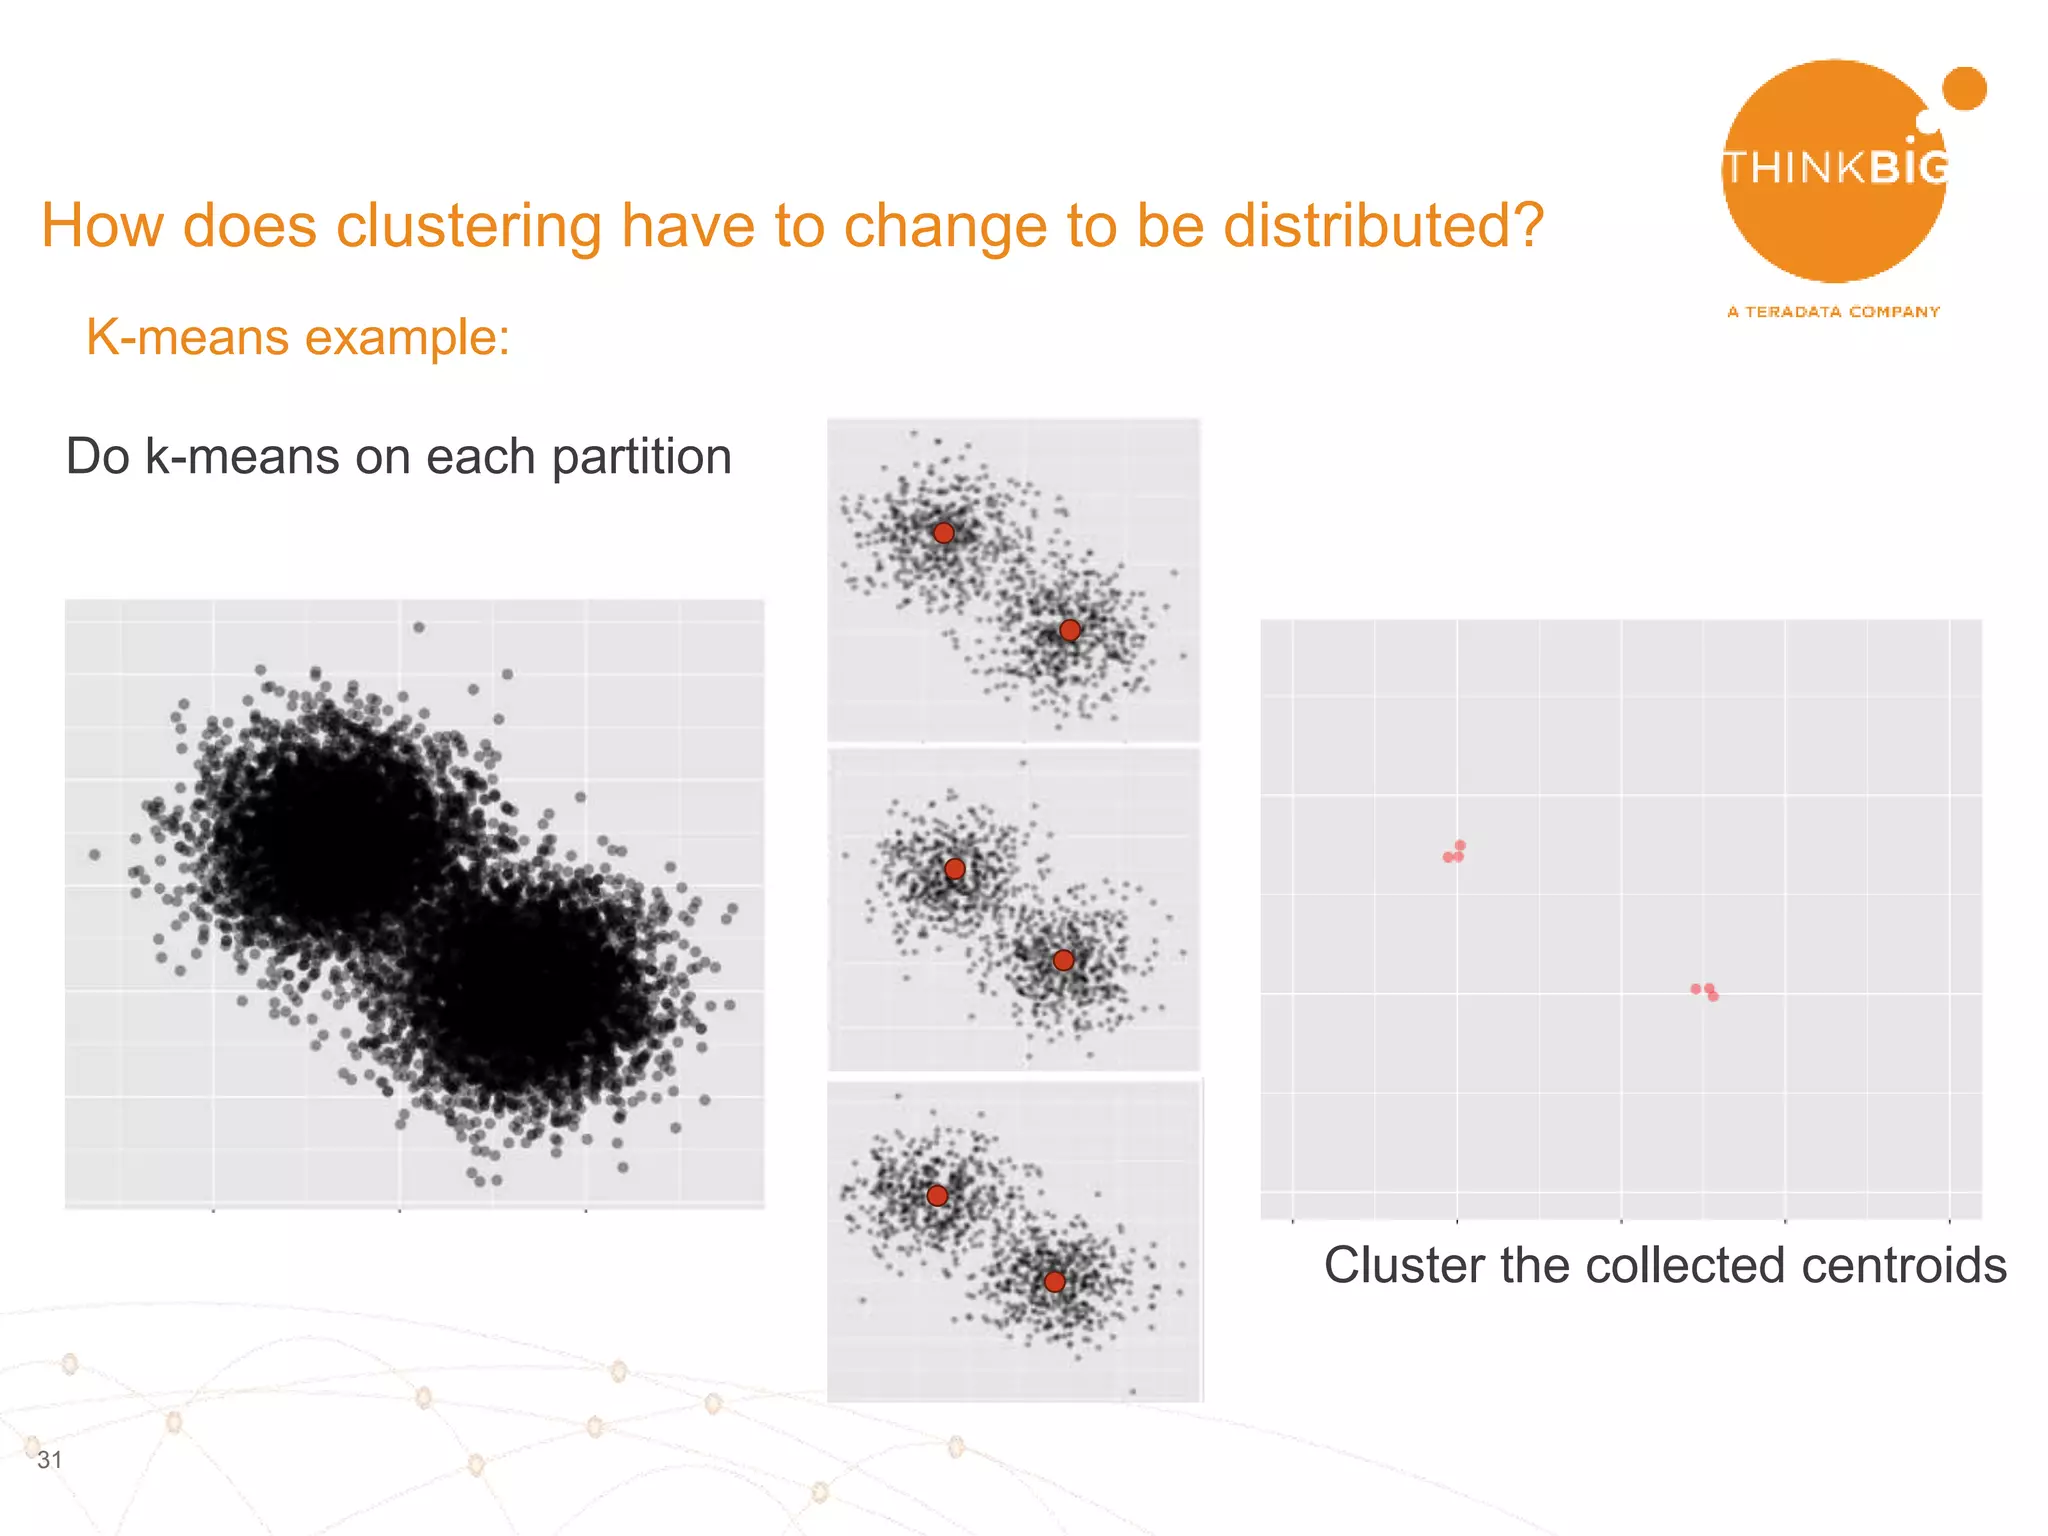
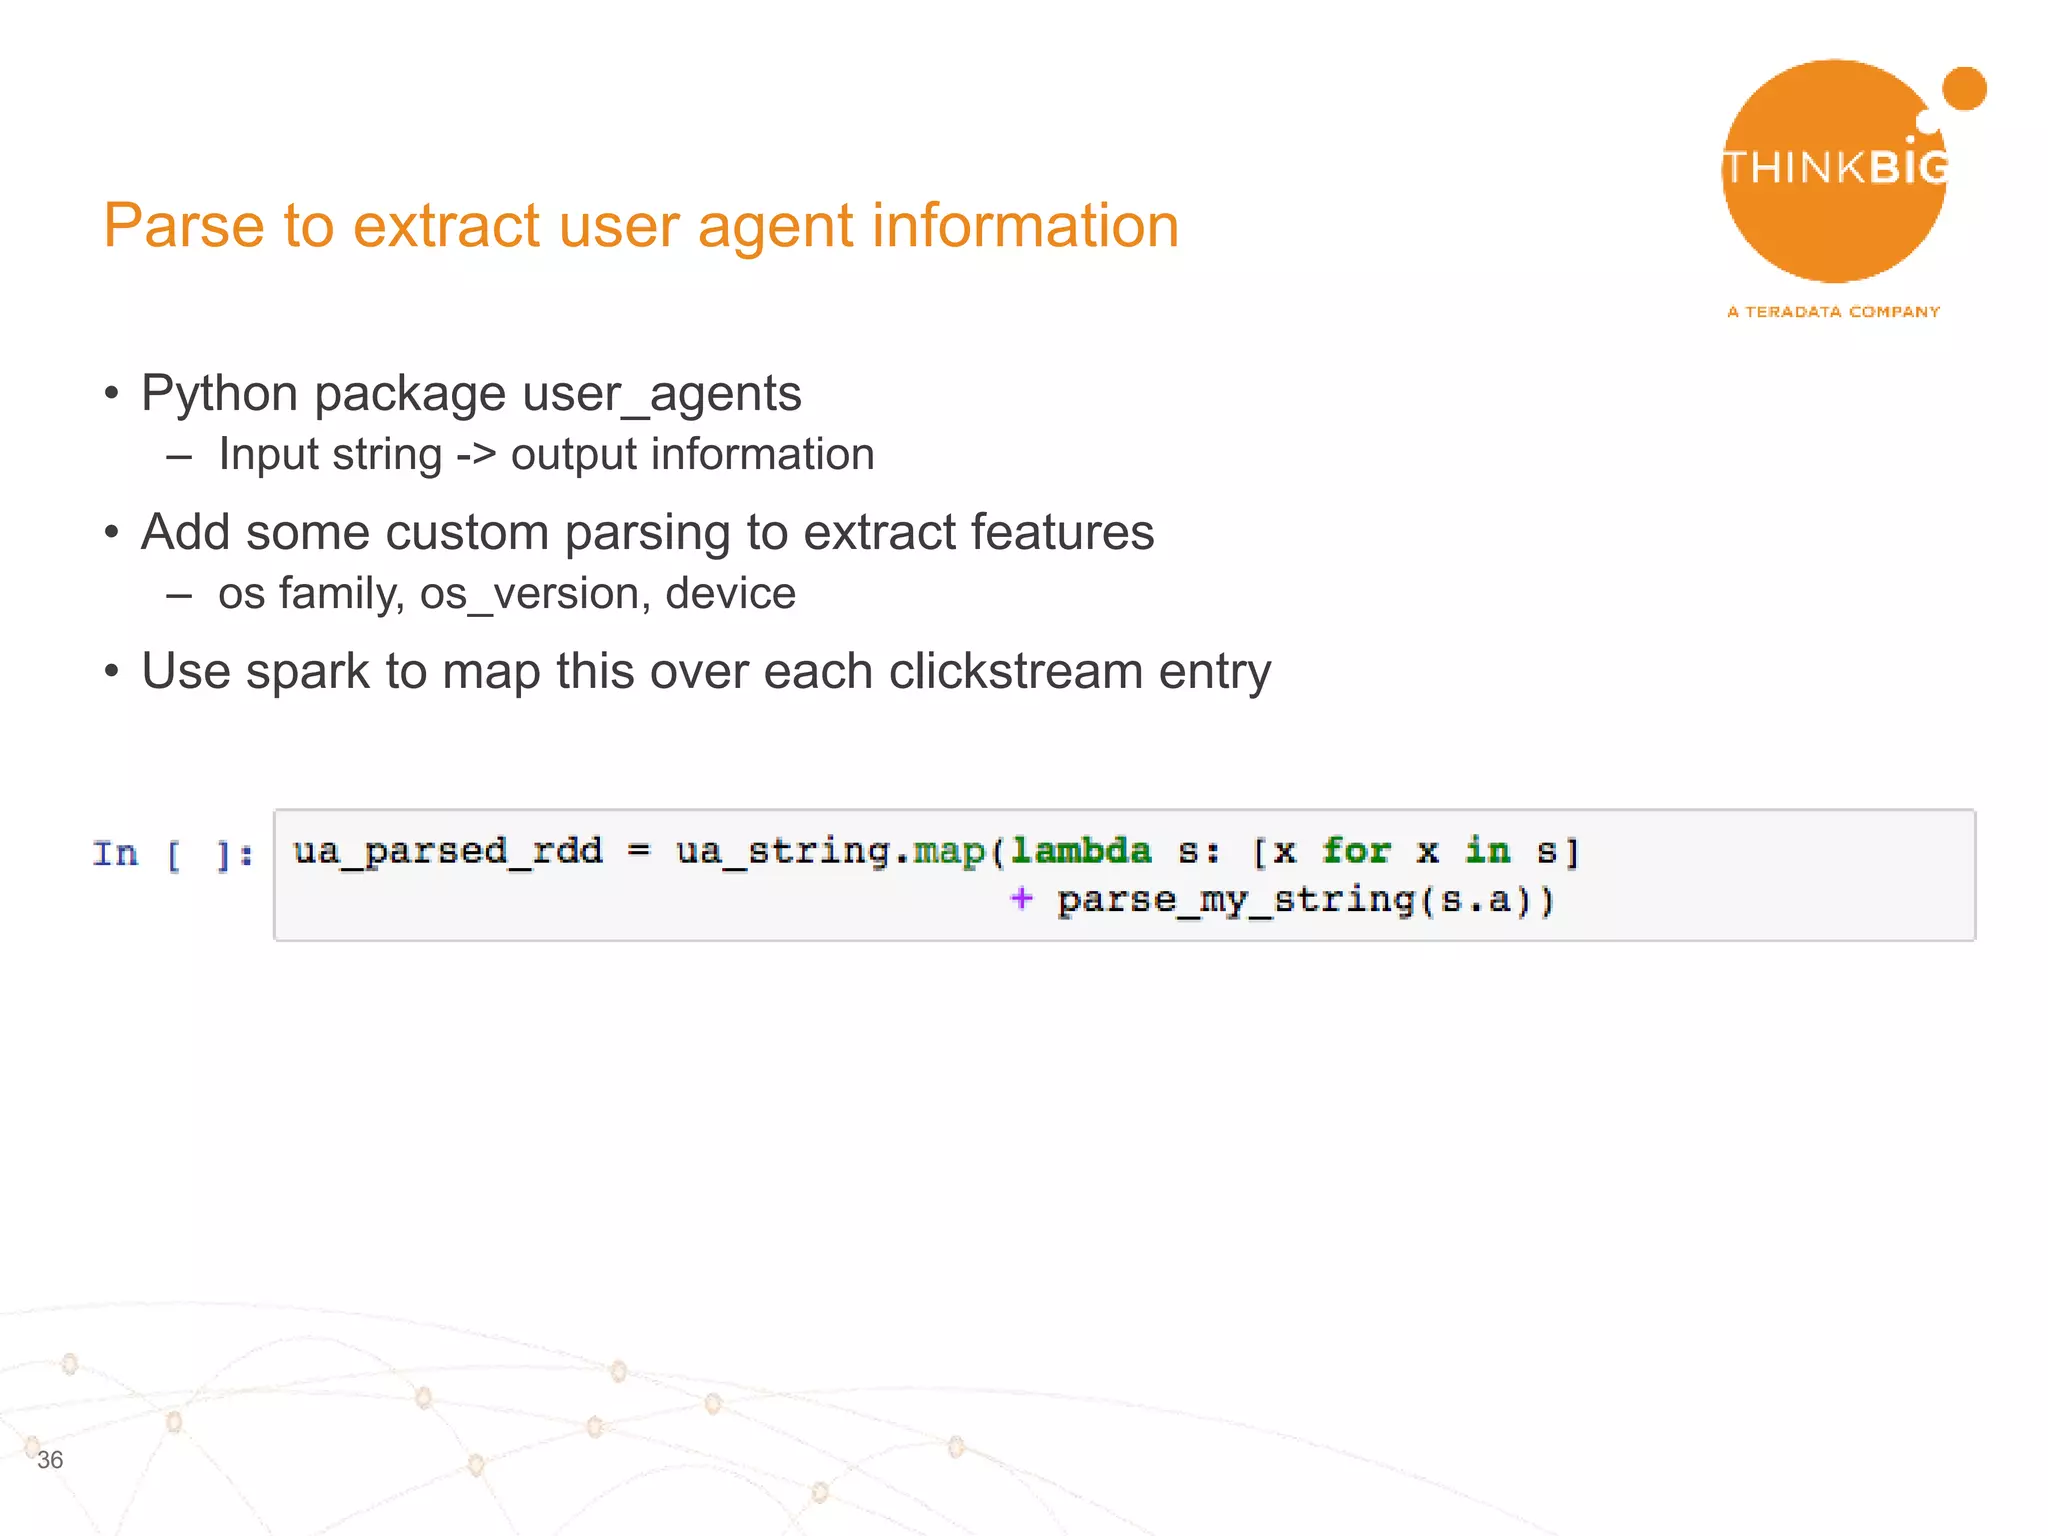
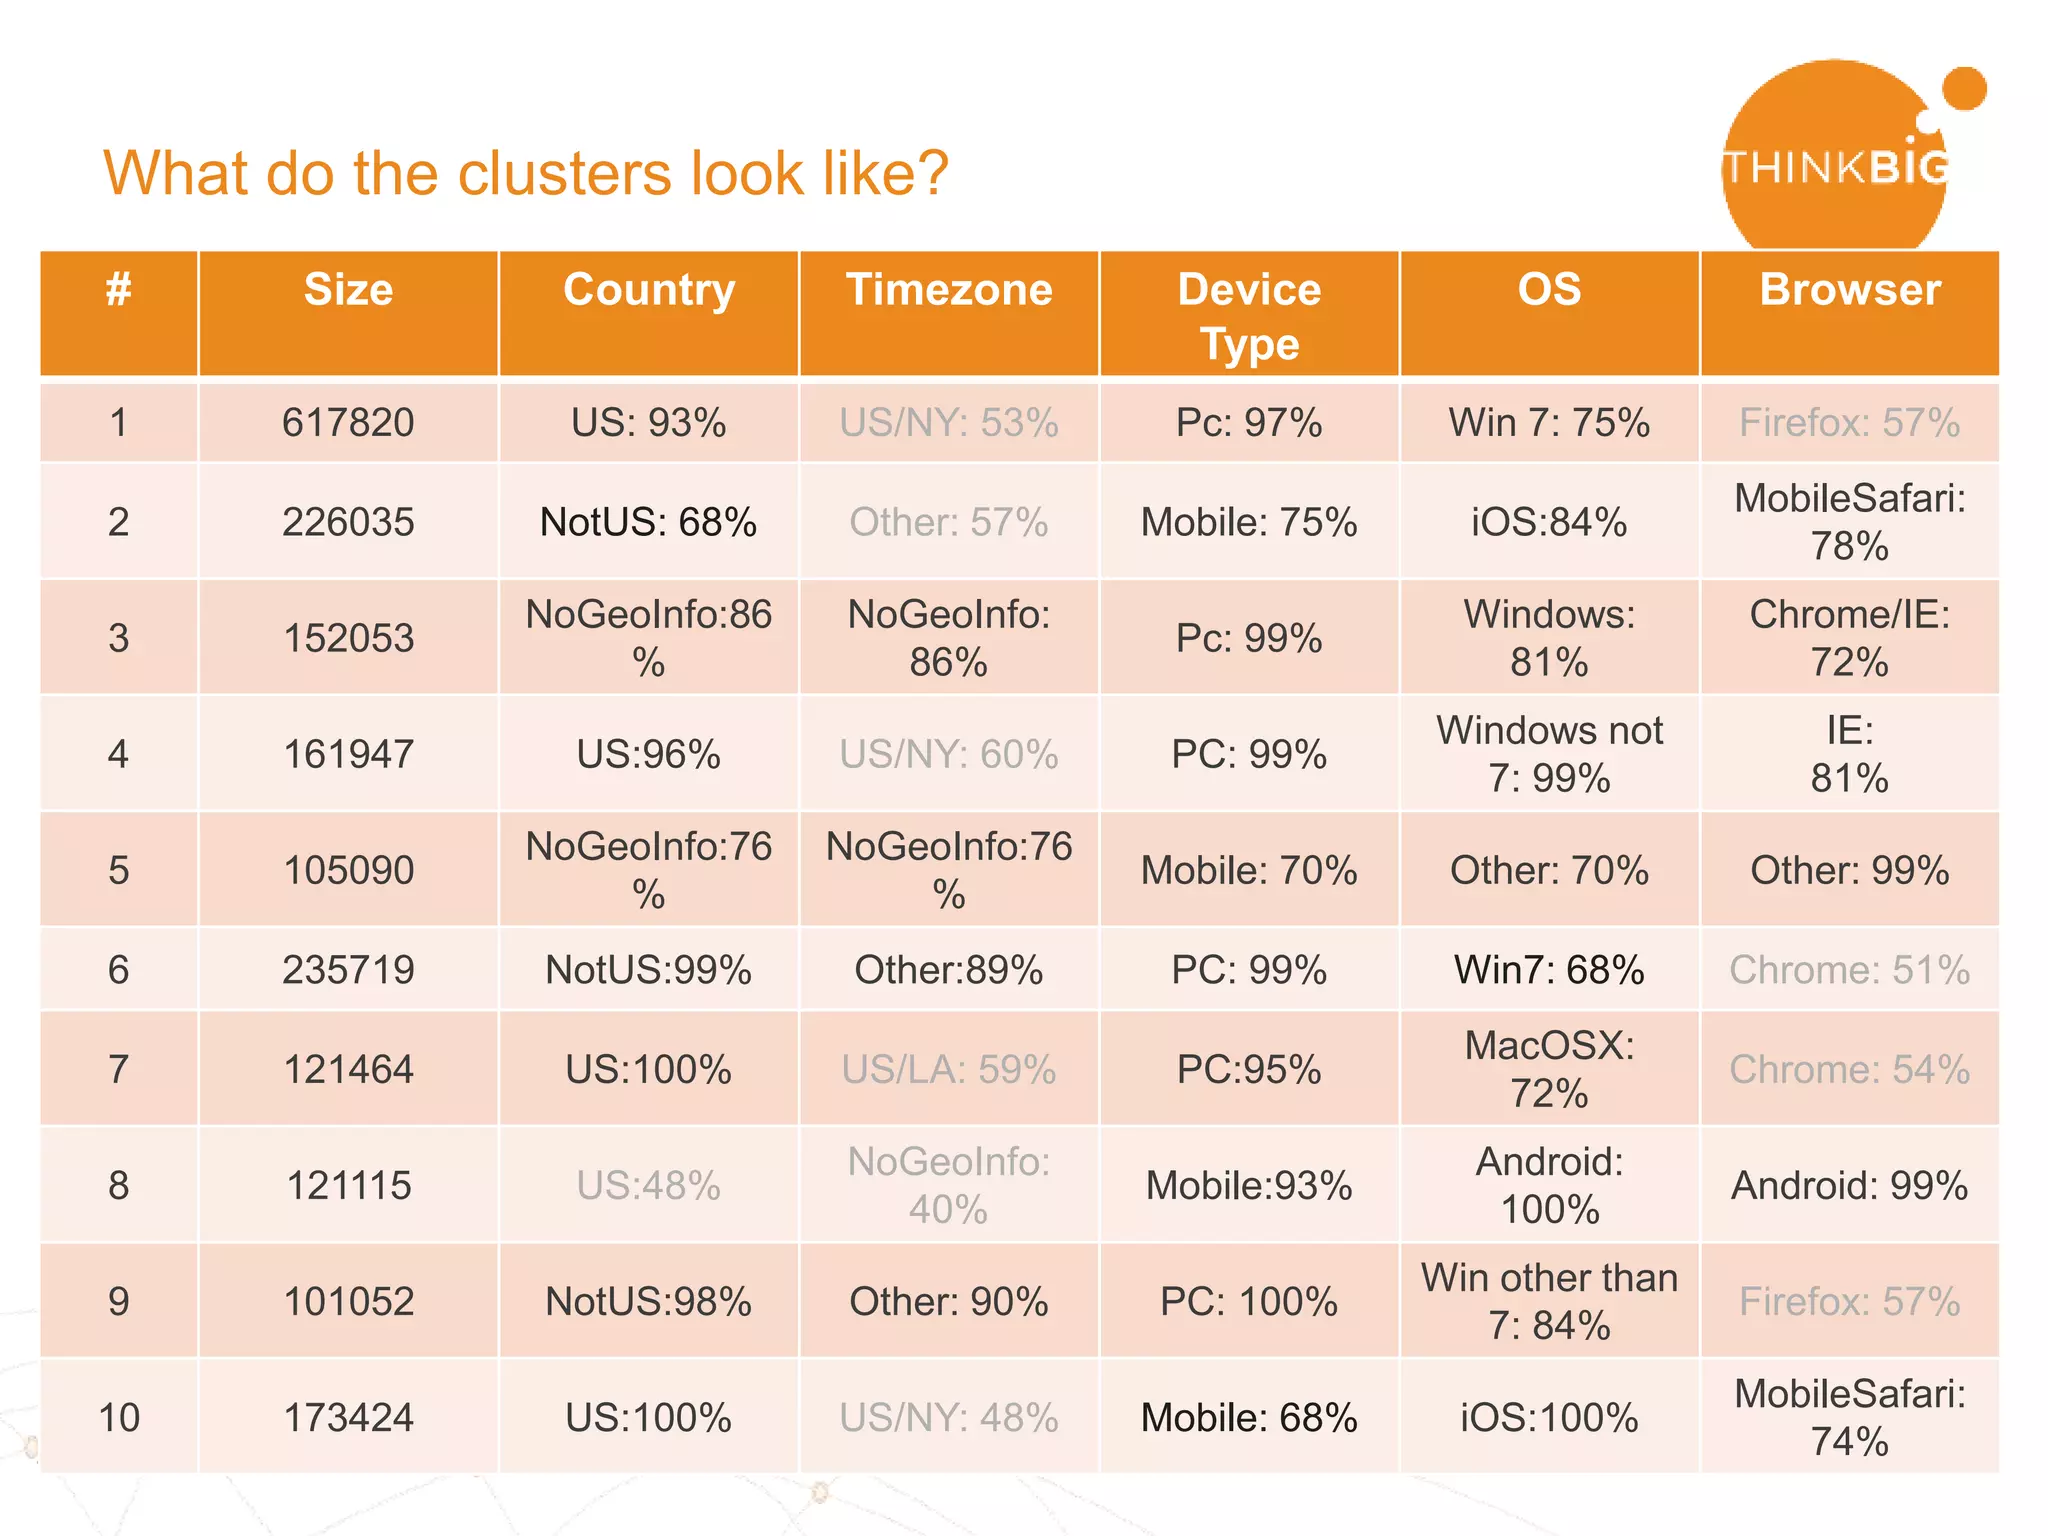
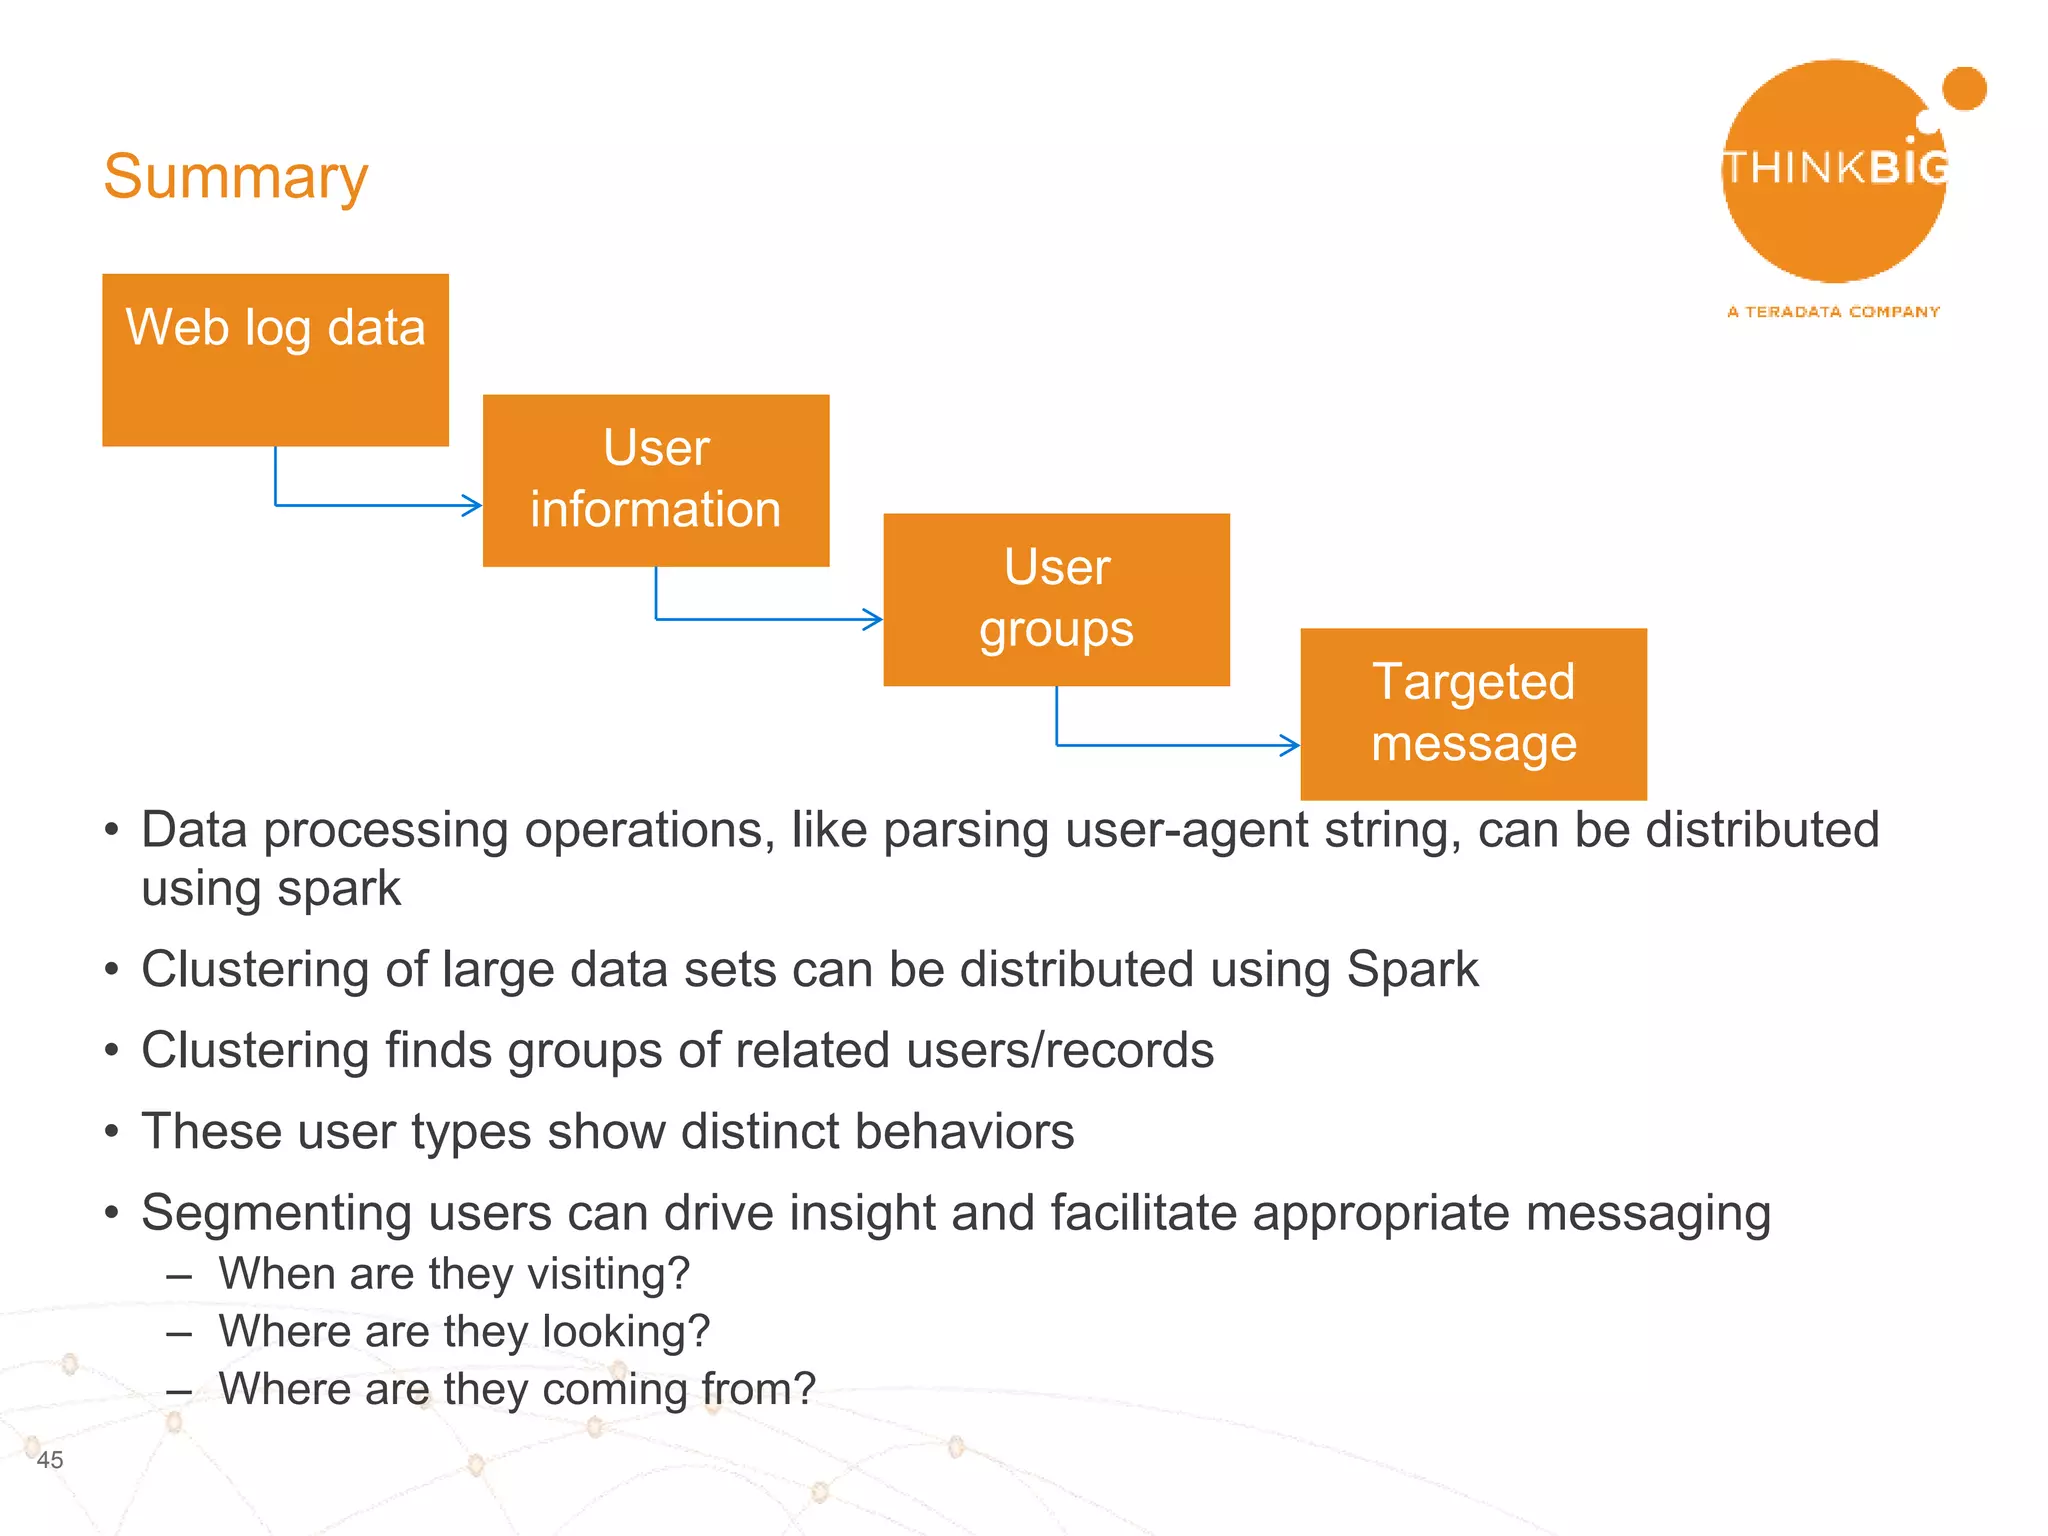
The document describes analyzing clickstream data using Spark clustering algorithms. It discusses parsing raw clickstream data containing user agent strings to extract useful fields like device type, OS, and timezone. It then applies distributed K-modes clustering in Spark to group users into subsets exhibiting similar patterns. The results show 10 clusters with different proportions of country, timezone, device and other fields, revealing distinct user types within the dataset.
![23
What is the raw data?
{‘h":"1rzB4JL","g":"1laU0gx","l":"anonymous","hh":"1.usa.gov","u":"http://www.cdc.g
ov/cdcgrandrounds/index.htm","r":"direct","a":"Mozilla/5.0 (compatible; MSIE 9.0;
Windows NT 6.1; WOW64;
Trident/5.0)","i":"","t":1460753233,"k":"","nk":0,"hc":1413468615,"_id":"52d237f4-
8c0e-0ac2-a0ed-a32acabe05bb","al":"en-US","c":"US","ll":[38,-97],"sl":"1rzB4JL”}
• json format](https://image.slidesharecdn.com/clickstreamdatawithspark-160416052642/75/Clickstream-data-with-spark-23-2048.jpg)
![24
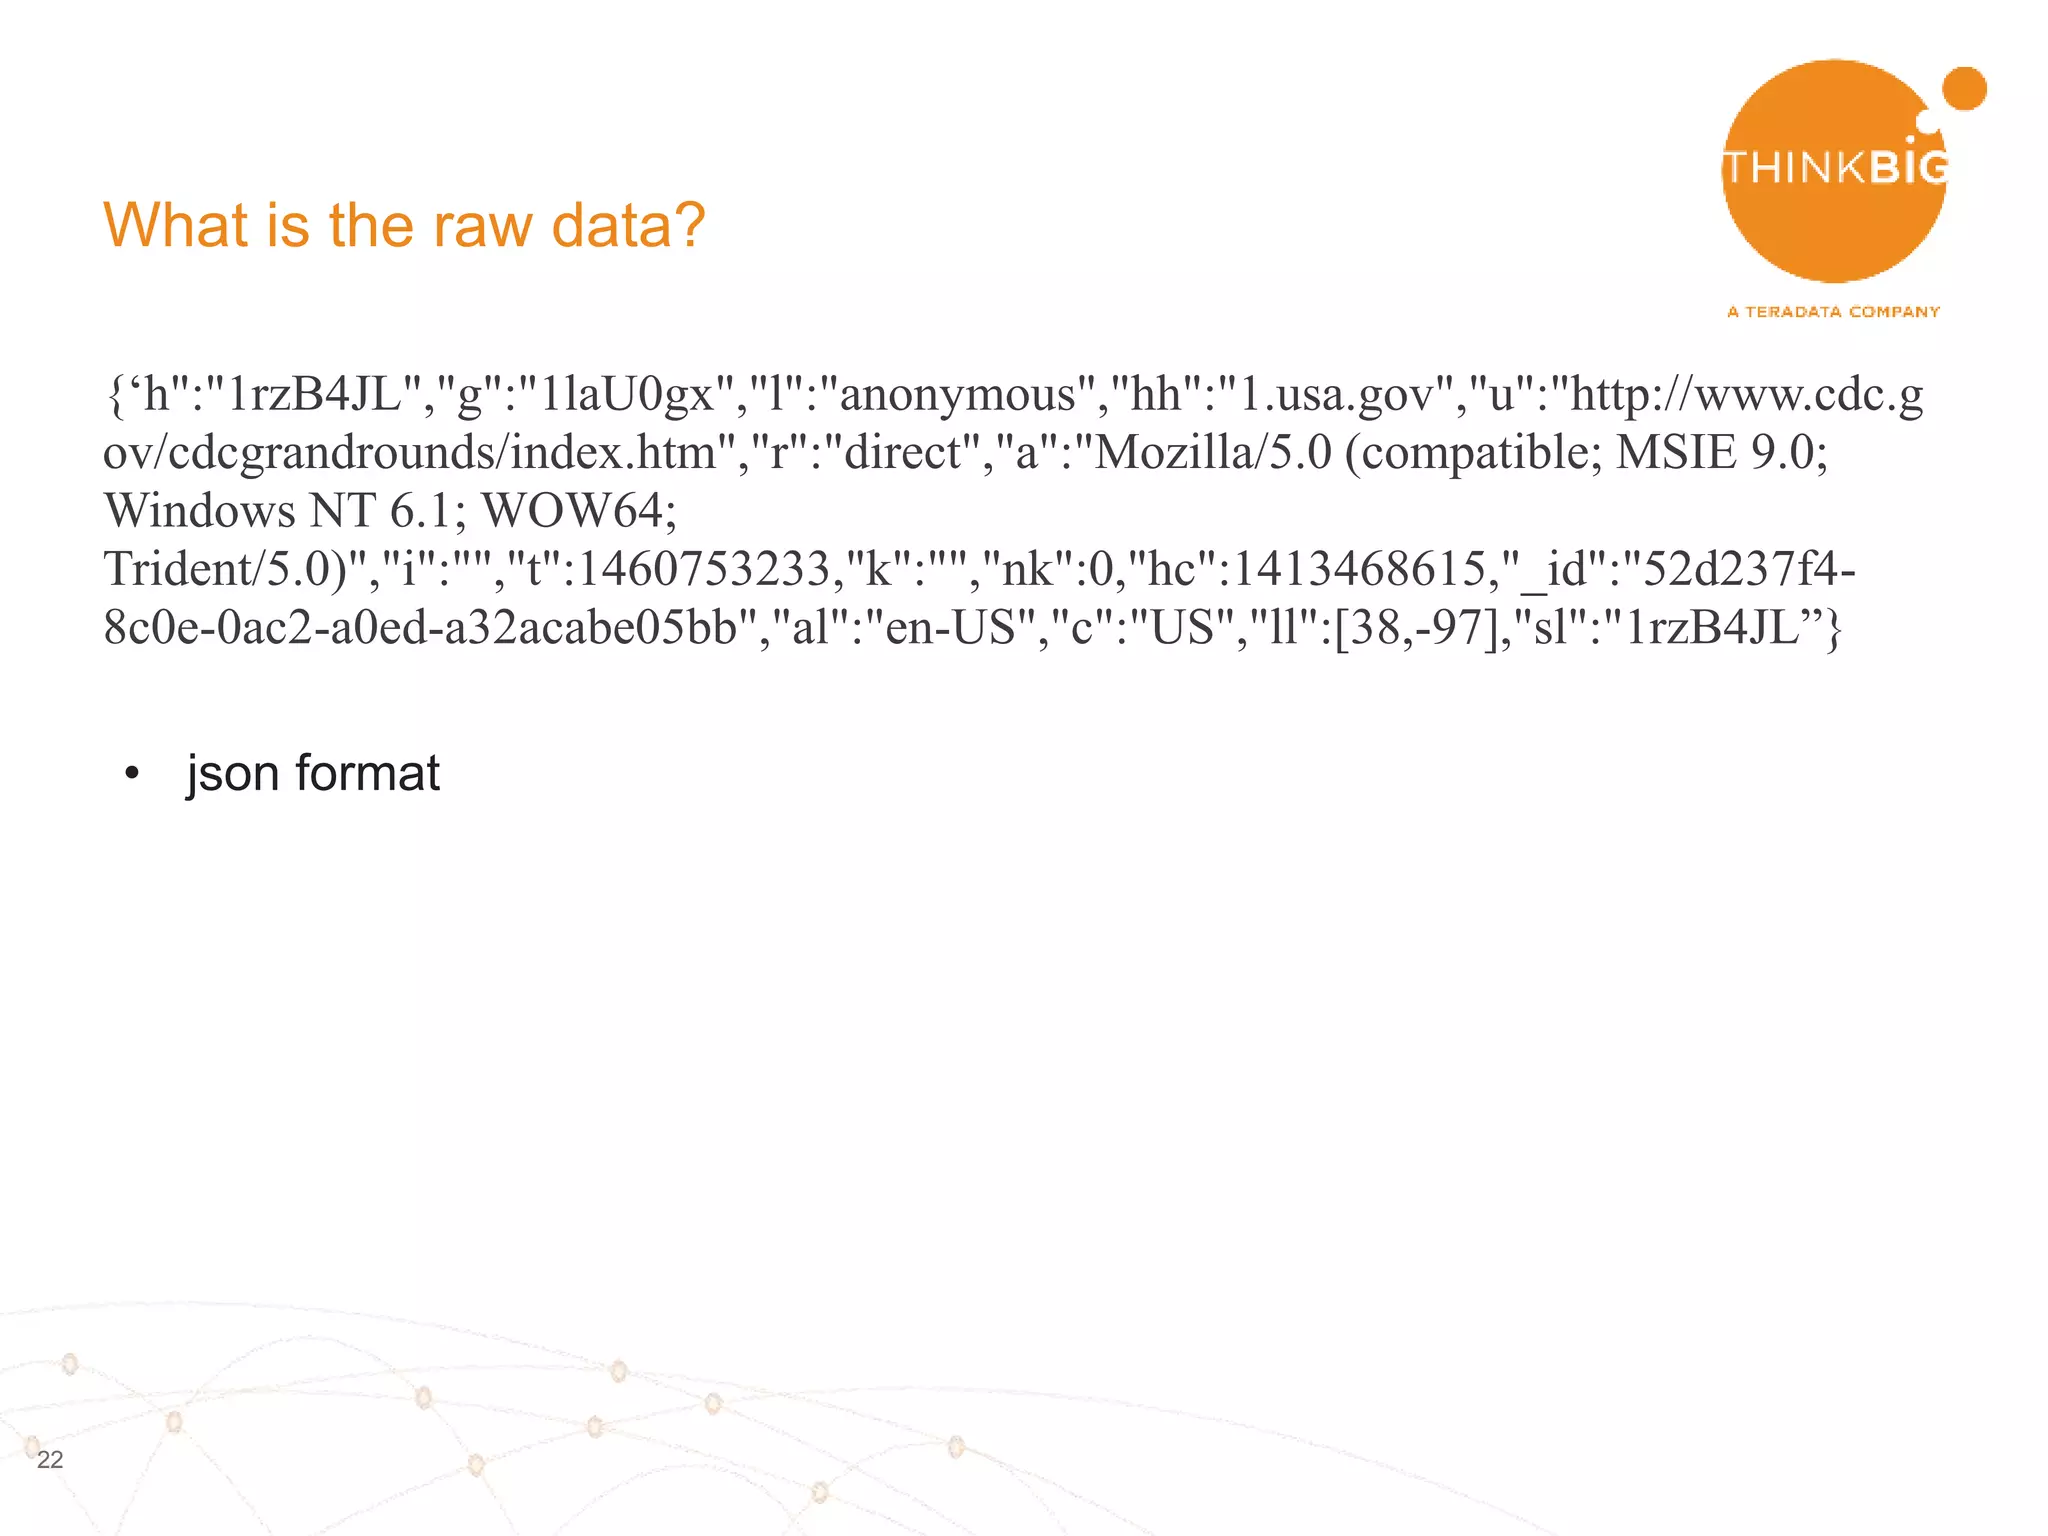
What is the raw data?
{‘h":"1rzB4JL","g":"1laU0gx","l":"anonymous","hh":"1.usa.gov","u":"http://www.cdc.g
ov/cdcgrandrounds/index.htm","r":"direct","a":"Mozilla/5.0 (compatible; MSIE 9.0;
Windows NT 6.1; WOW64;
Trident/5.0)","i":"","t":1460753233,"k":"","nk":0,"hc":1413468615,"_id":"52d237f4-
8c0e-0ac2-a0ed-a32acabe05bb","al":"en-US","c":"US","ll":[38,-97],"sl":"1rzB4JL”}
• json format
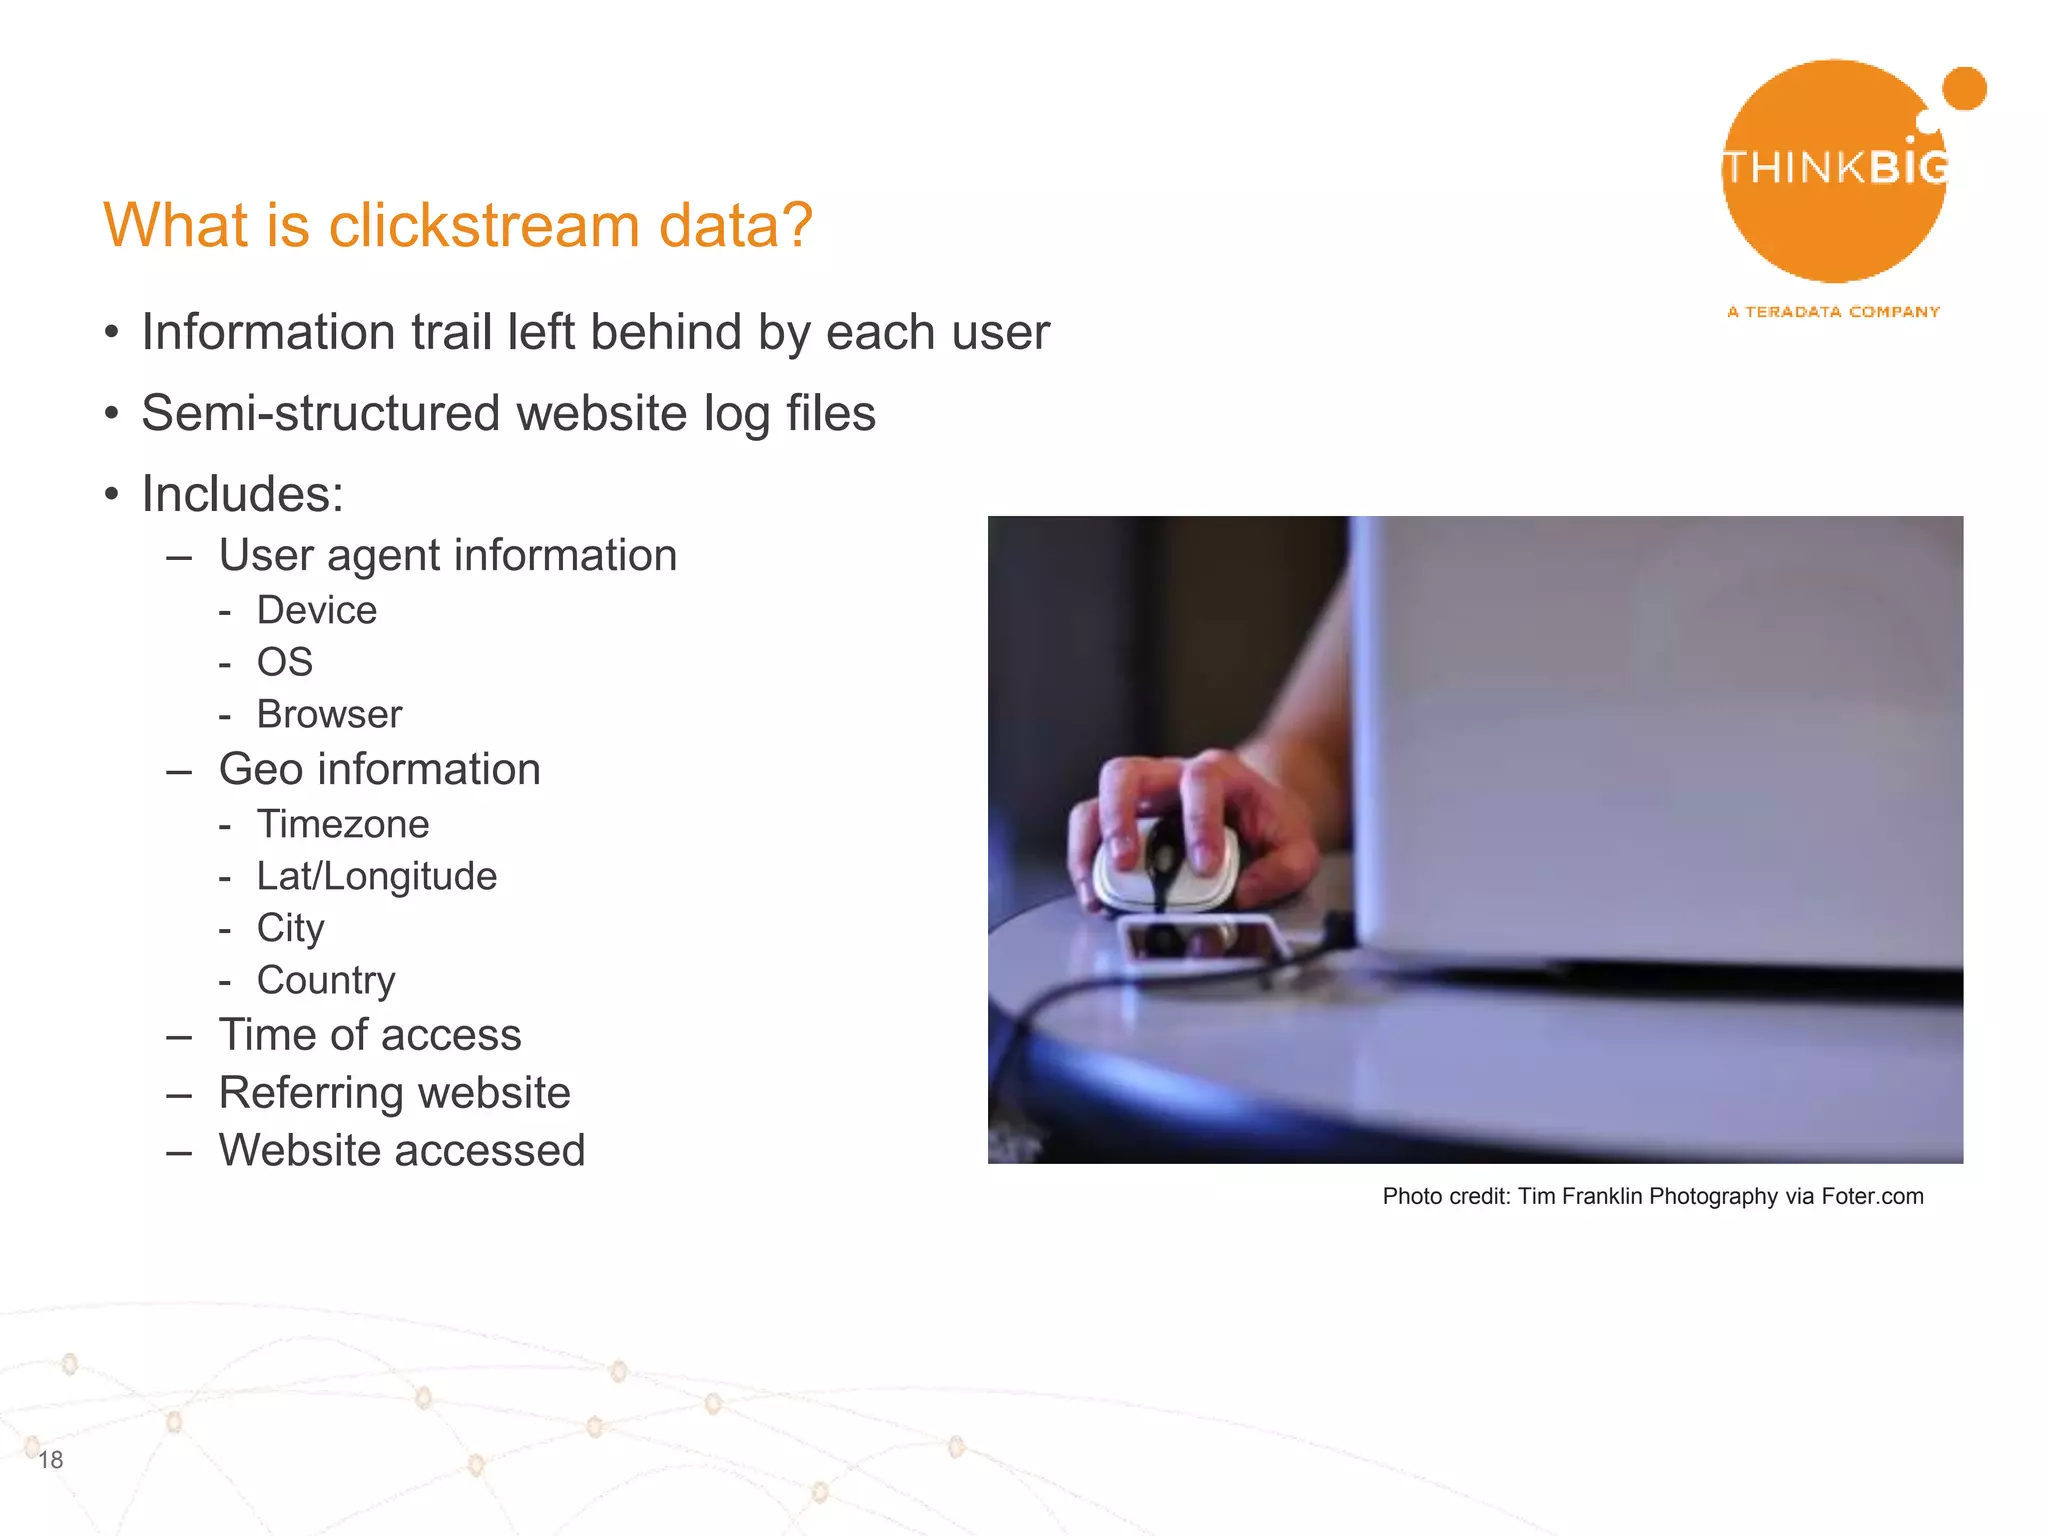
• Fields include:
• Website clicked: long url](https://image.slidesharecdn.com/clickstreamdatawithspark-160416052642/75/Clickstream-data-with-spark-24-2048.jpg)
![25
What is the raw data?
{‘h":"1rzB4JL","g":"1laU0gx","l":"anonymous","hh":"1.usa.gov","u":"http://www.cdc.g
ov/cdcgrandrounds/index.htm","r":"direct","a":"Mozilla/5.0 (compatible; MSIE 9.0;
Windows NT 6.1; WOW64;
Trident/5.0)","i":"","t":1460753233,"k":"","nk":0,"hc":1413468615,"_id":"52d237f4-
8c0e-0ac2-a0ed-a32acabe05bb","al":"en-US","c":"US","ll":[38,-97],"sl":"1rzB4JL”}
• json format
• Fields include:
• Website clicked/long url
• Referring url](https://image.slidesharecdn.com/clickstreamdatawithspark-160416052642/75/Clickstream-data-with-spark-25-2048.jpg)
![26
What is the raw data?
{‘h":"1rzB4JL","g":"1laU0gx","l":"anonymous","hh":"1.usa.gov","u":"http://www.cdc.g
ov/cdcgrandrounds/index.htm","r":"direct","a":"Mozilla/5.0 (compatible; MSIE 9.0;
Windows NT 6.1; WOW64;
Trident/5.0)","i":"","t":1460753233,"k":"","nk":0,"hc":1413468615,"_id":"52d237f4-
8c0e-0ac2-a0ed-a32acabe05bb","al":"en-US","c":"US","ll":[38,-97],"sl":"1rzB4JL”}
• json format
• Fields include:
• Website clicked/long url
• Referring url
• User agent – what machine is this?](https://image.slidesharecdn.com/clickstreamdatawithspark-160416052642/75/Clickstream-data-with-spark-26-2048.jpg)
![27
What is the raw data?
{‘h":"1rzB4JL","g":"1laU0gx","l":"anonymous","hh":"1.usa.gov","u":"http://www.cdc.g
ov/cdcgrandrounds/index.htm","r":"direct","a":"Mozilla/5.0 (compatible; MSIE 9.0;
Windows NT 6.1; WOW64;
Trident/5.0)","i":"","t":1460753233,"k":"","nk":0,"hc":1413468615,"_id":"52d237f4-
8c0e-0ac2-a0ed-a32acabe05bb","al":"en-US","c":"US","ll":[38,-97],"sl":"1rzB4JL”}
• json format
• Fields include:
• Website clicked/long url
• Referring url
• User agent – what machine is this?
• Time accessed
• etc…](https://image.slidesharecdn.com/clickstreamdatawithspark-160416052642/75/Clickstream-data-with-spark-27-2048.jpg)
![29
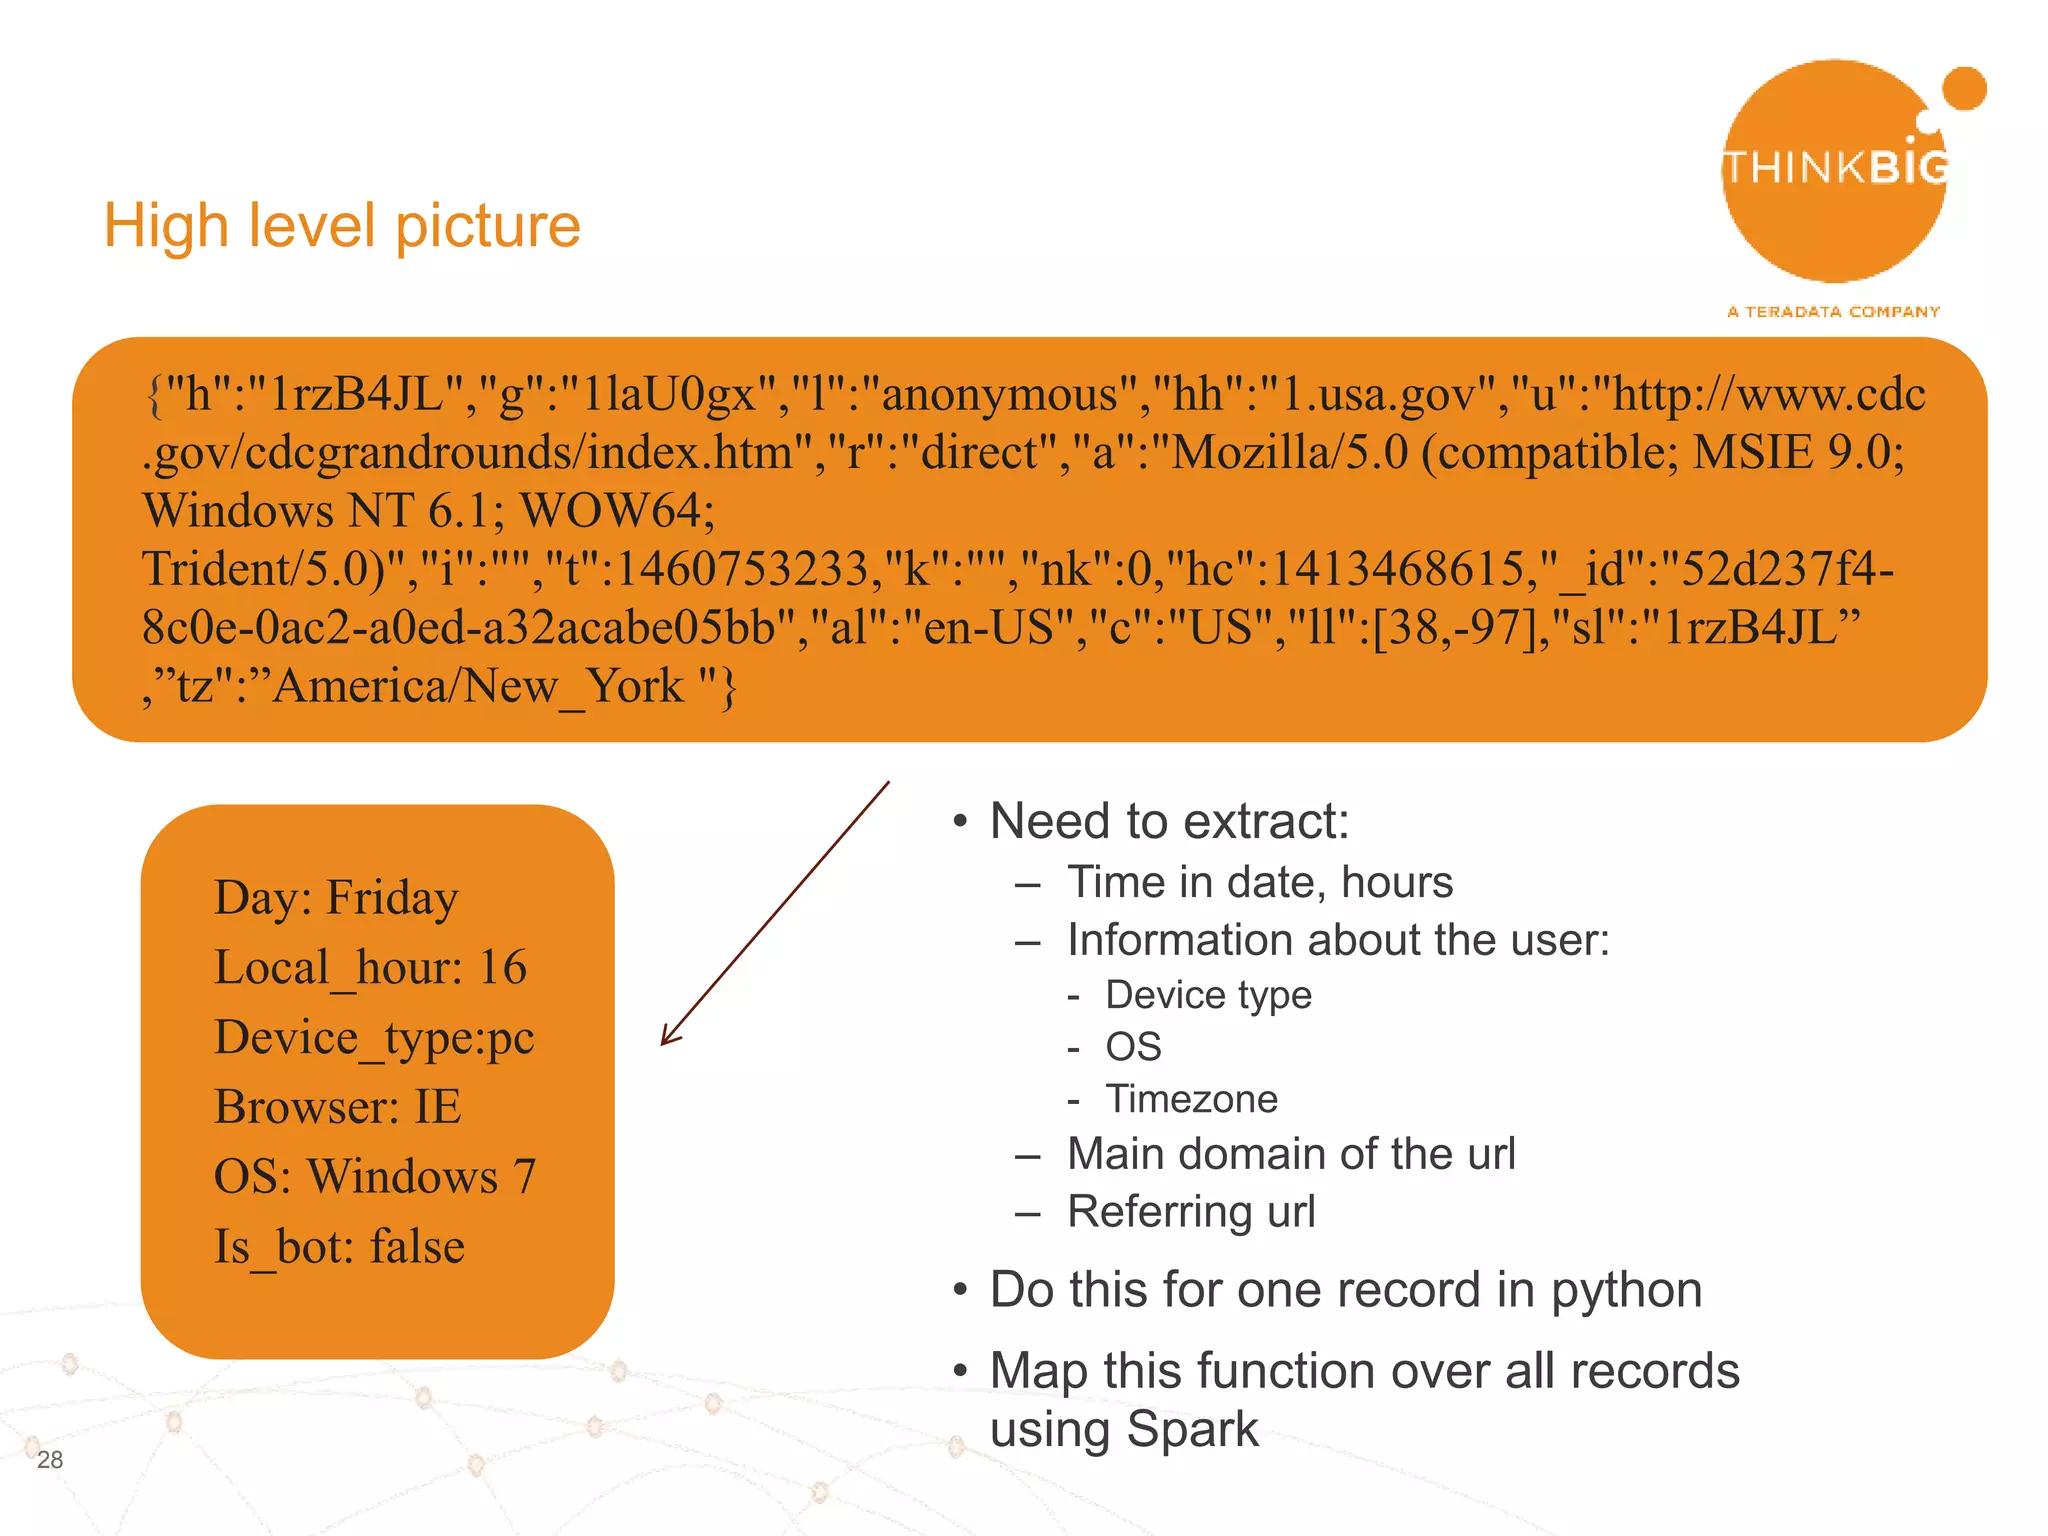
High level picture
• Need to extract:
– Time in date, hours
– Information about the user:
- Device type
- OS
- Timezone
– Main domain of the url
– Referring url
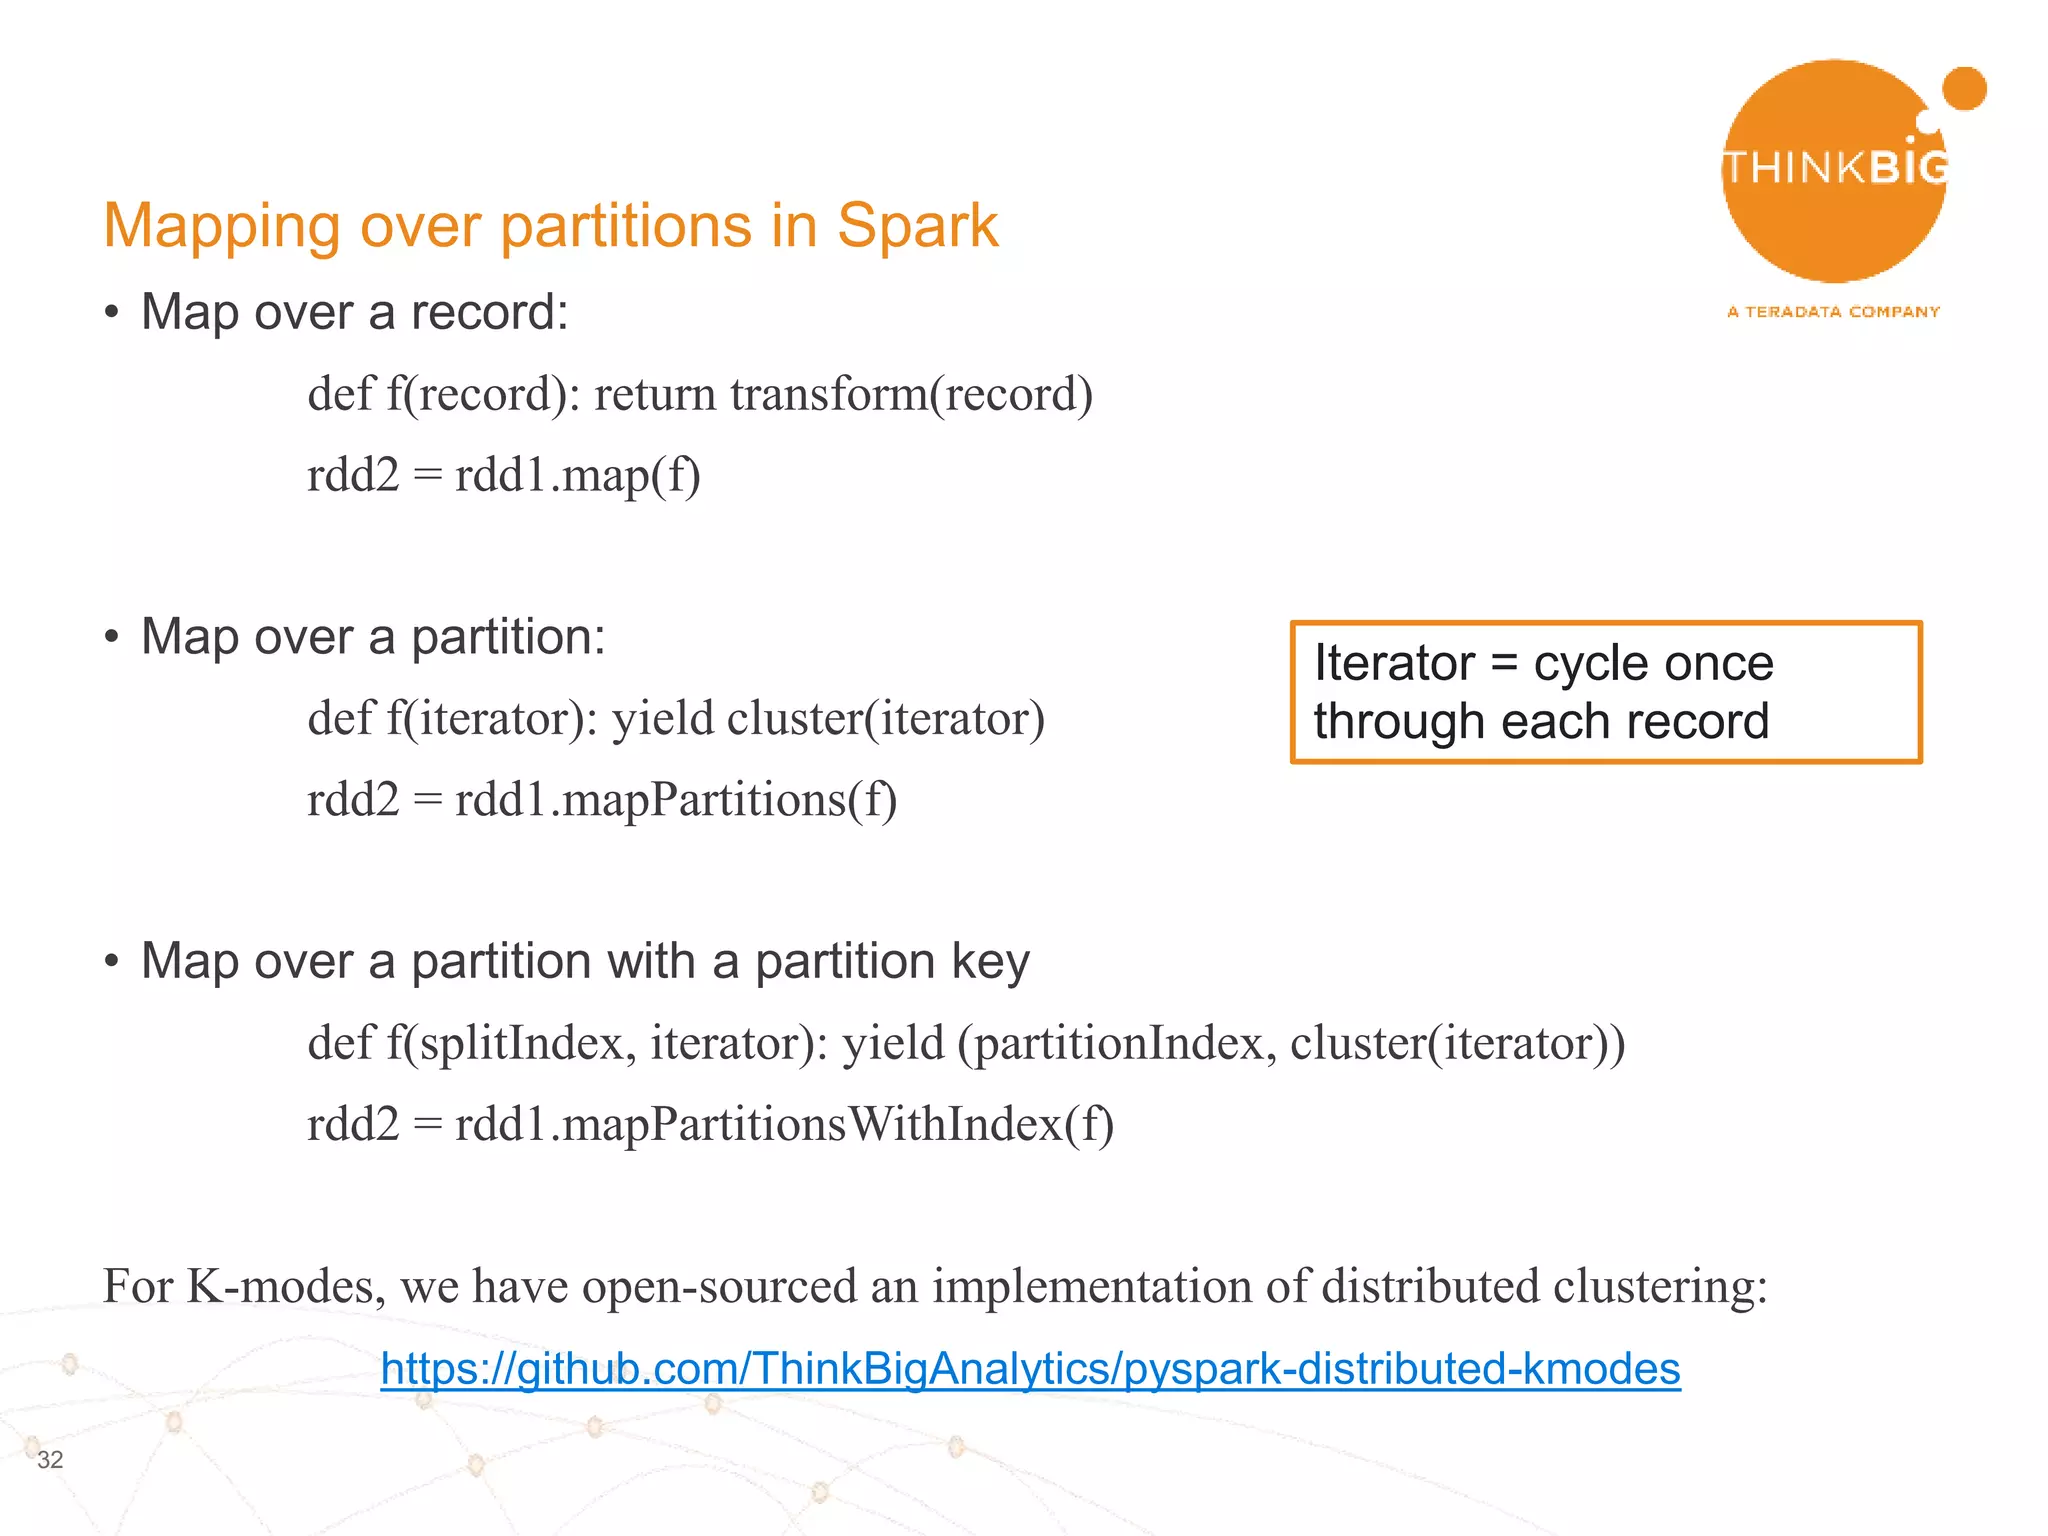
• Do this for one record in python
• Map this function over all records
using Spark
{"h":"1rzB4JL","g":"1laU0gx","l":"anonymous","hh":"1.usa.gov","u":"http://www.cdc
.gov/cdcgrandrounds/index.htm","r":"direct","a":"Mozilla/5.0 (compatible; MSIE 9.0;
Windows NT 6.1; WOW64;
Trident/5.0)","i":"","t":1460753233,"k":"","nk":0,"hc":1413468615,"_id":"52d237f4-
8c0e-0ac2-a0ed-a32acabe05bb","al":"en-US","c":"US","ll":[38,-97],"sl":"1rzB4JL”
,”tz":”America/New_York "}
Day: Friday
Local_hour: 16
Device_type:pc
Browser: IE
OS: Windows 7
Is_bot: false](https://image.slidesharecdn.com/clickstreamdatawithspark-160416052642/75/Clickstream-data-with-spark-29-2048.jpg)


![[DSC Europe 25] Kaja Kandare - LLM as a judge.pptx](https://cdn.slidesharecdn.com/ss_thumbnails/arxyccaxsdsd1ba99wjw-7-251212104007-2b4e3f64-thumbnail.jpg?width=640&height=640&fit=bounds)

![[DSC Europe 25] Tatevik Maytesyan - How to actually use AI in marketing: gett...](https://cdn.slidesharecdn.com/ss_thumbnails/tjo626lsqdgfntbgl2mw-4-251216103155-e36cd239-thumbnail.jpg?width=640&height=640&fit=bounds)


![[DSC Europe 25] Dunja Adzic Jovanovic - AI and Cybersecurity: Defending Data ...](https://cdn.slidesharecdn.com/ss_thumbnails/o1zylpbhrtwnixxq2xj8-7-251211083048-185086f6-thumbnail.jpg?width=640&height=640&fit=bounds)


![[DSC Europe 25] Dusan Nesic - Securing Tomorrow’s Infrastructure: Why Cyber-P...](https://cdn.slidesharecdn.com/ss_thumbnails/qikbszfftyowjm2q6duw-1-251211083848-8f2ead6b-thumbnail.jpg?width=640&height=640&fit=bounds)


