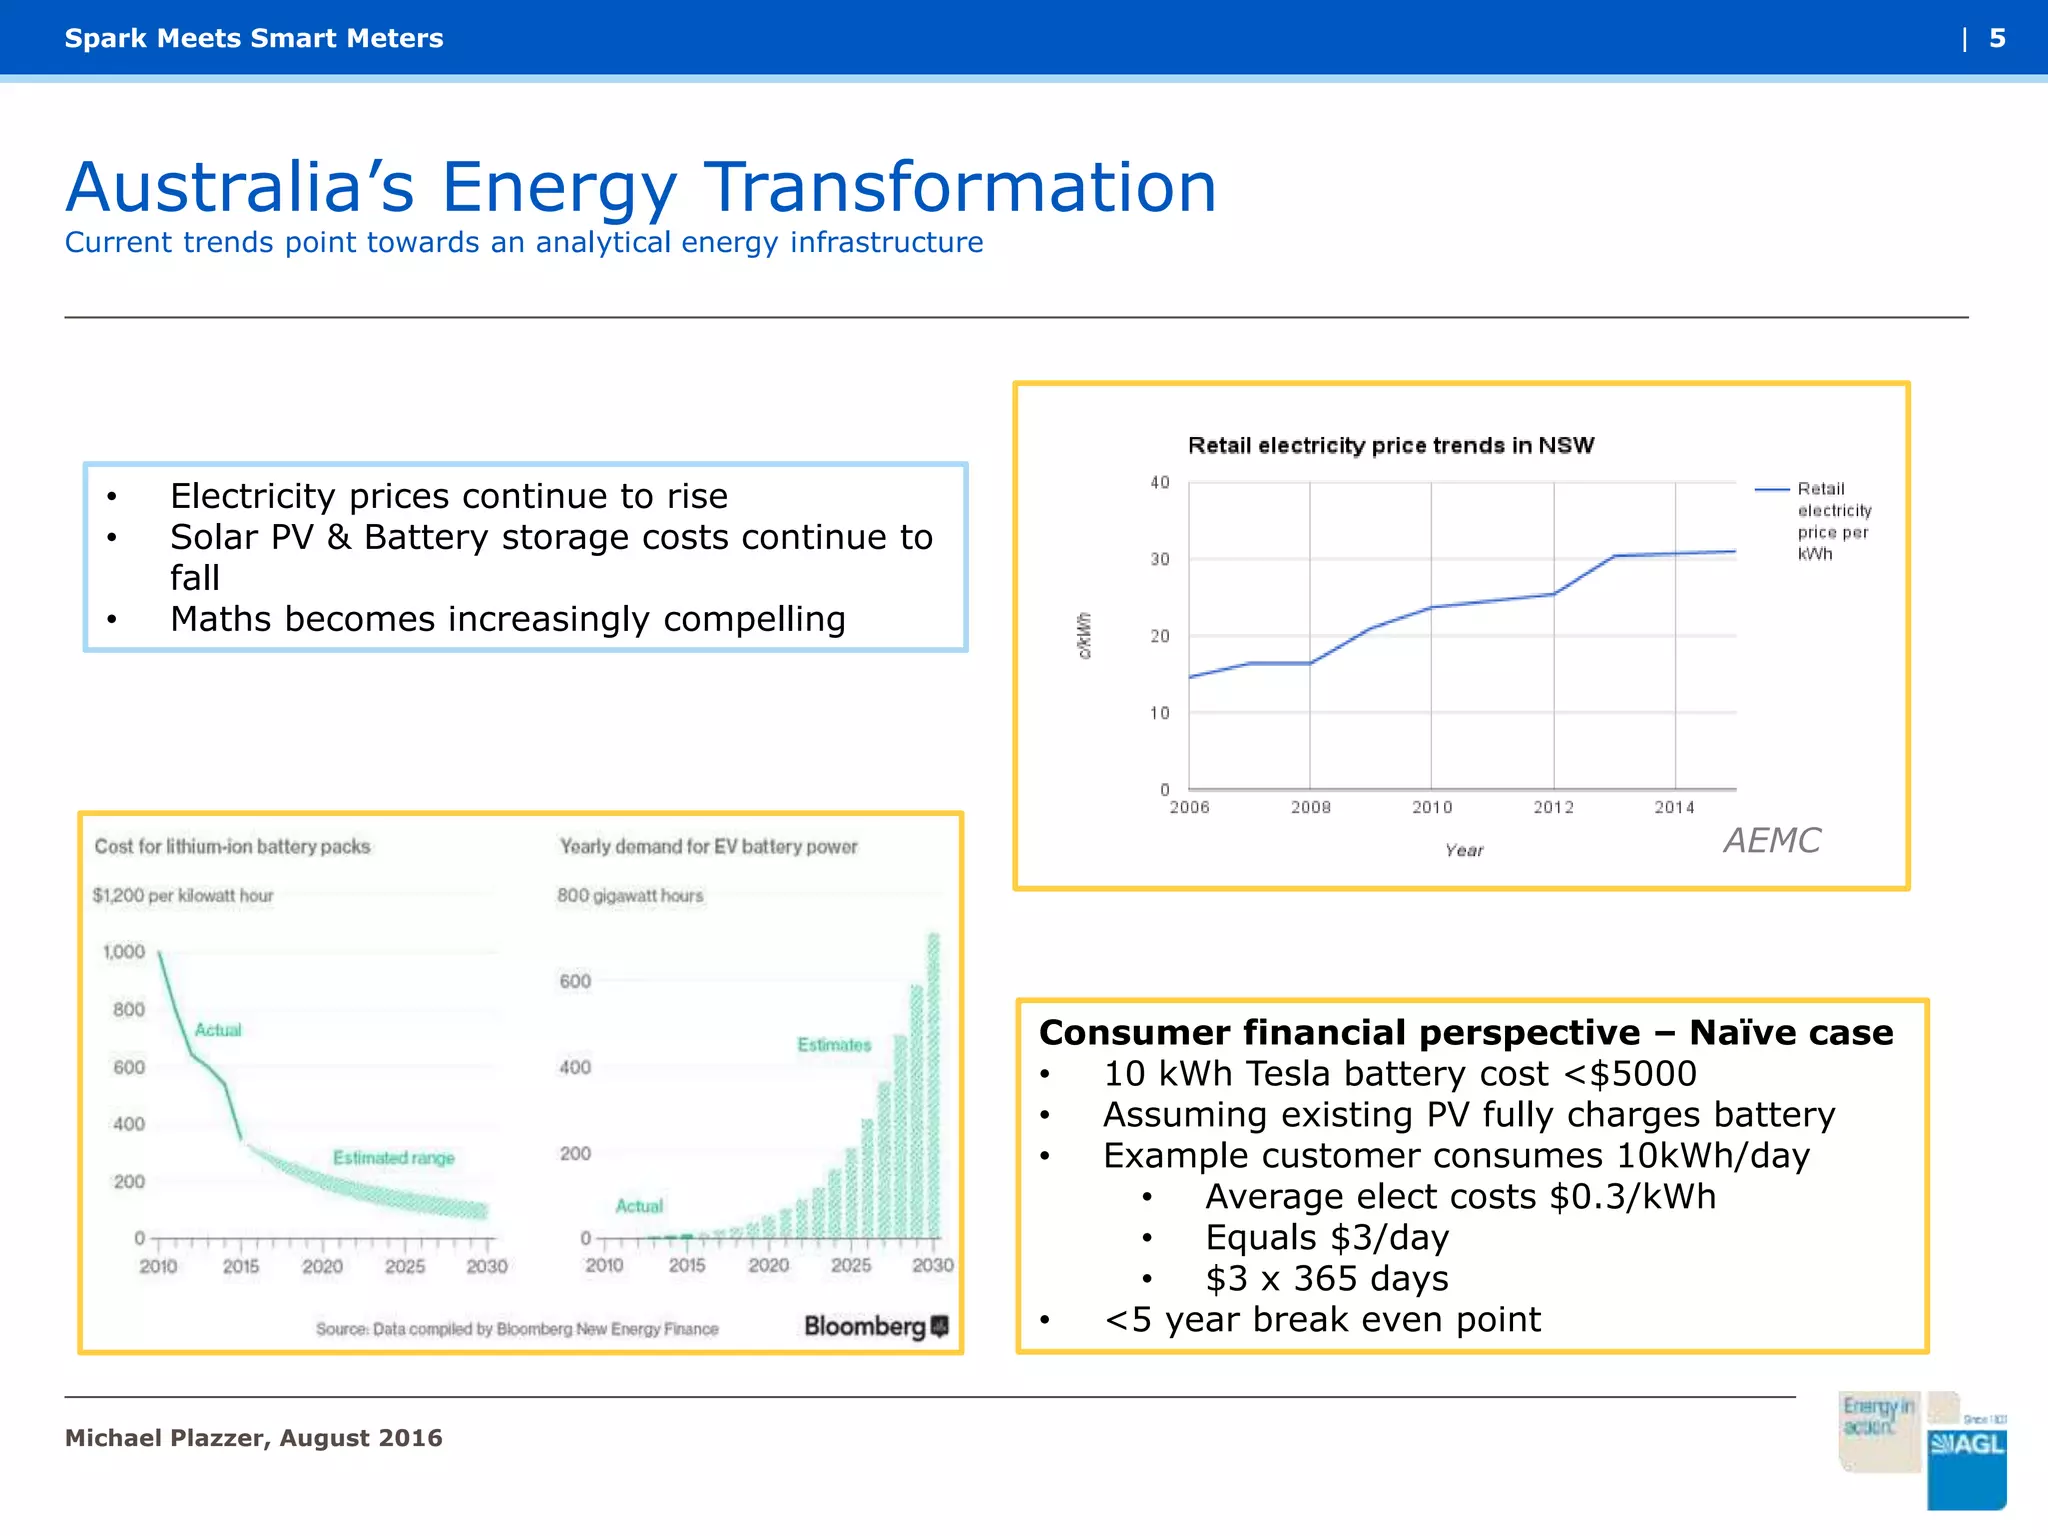
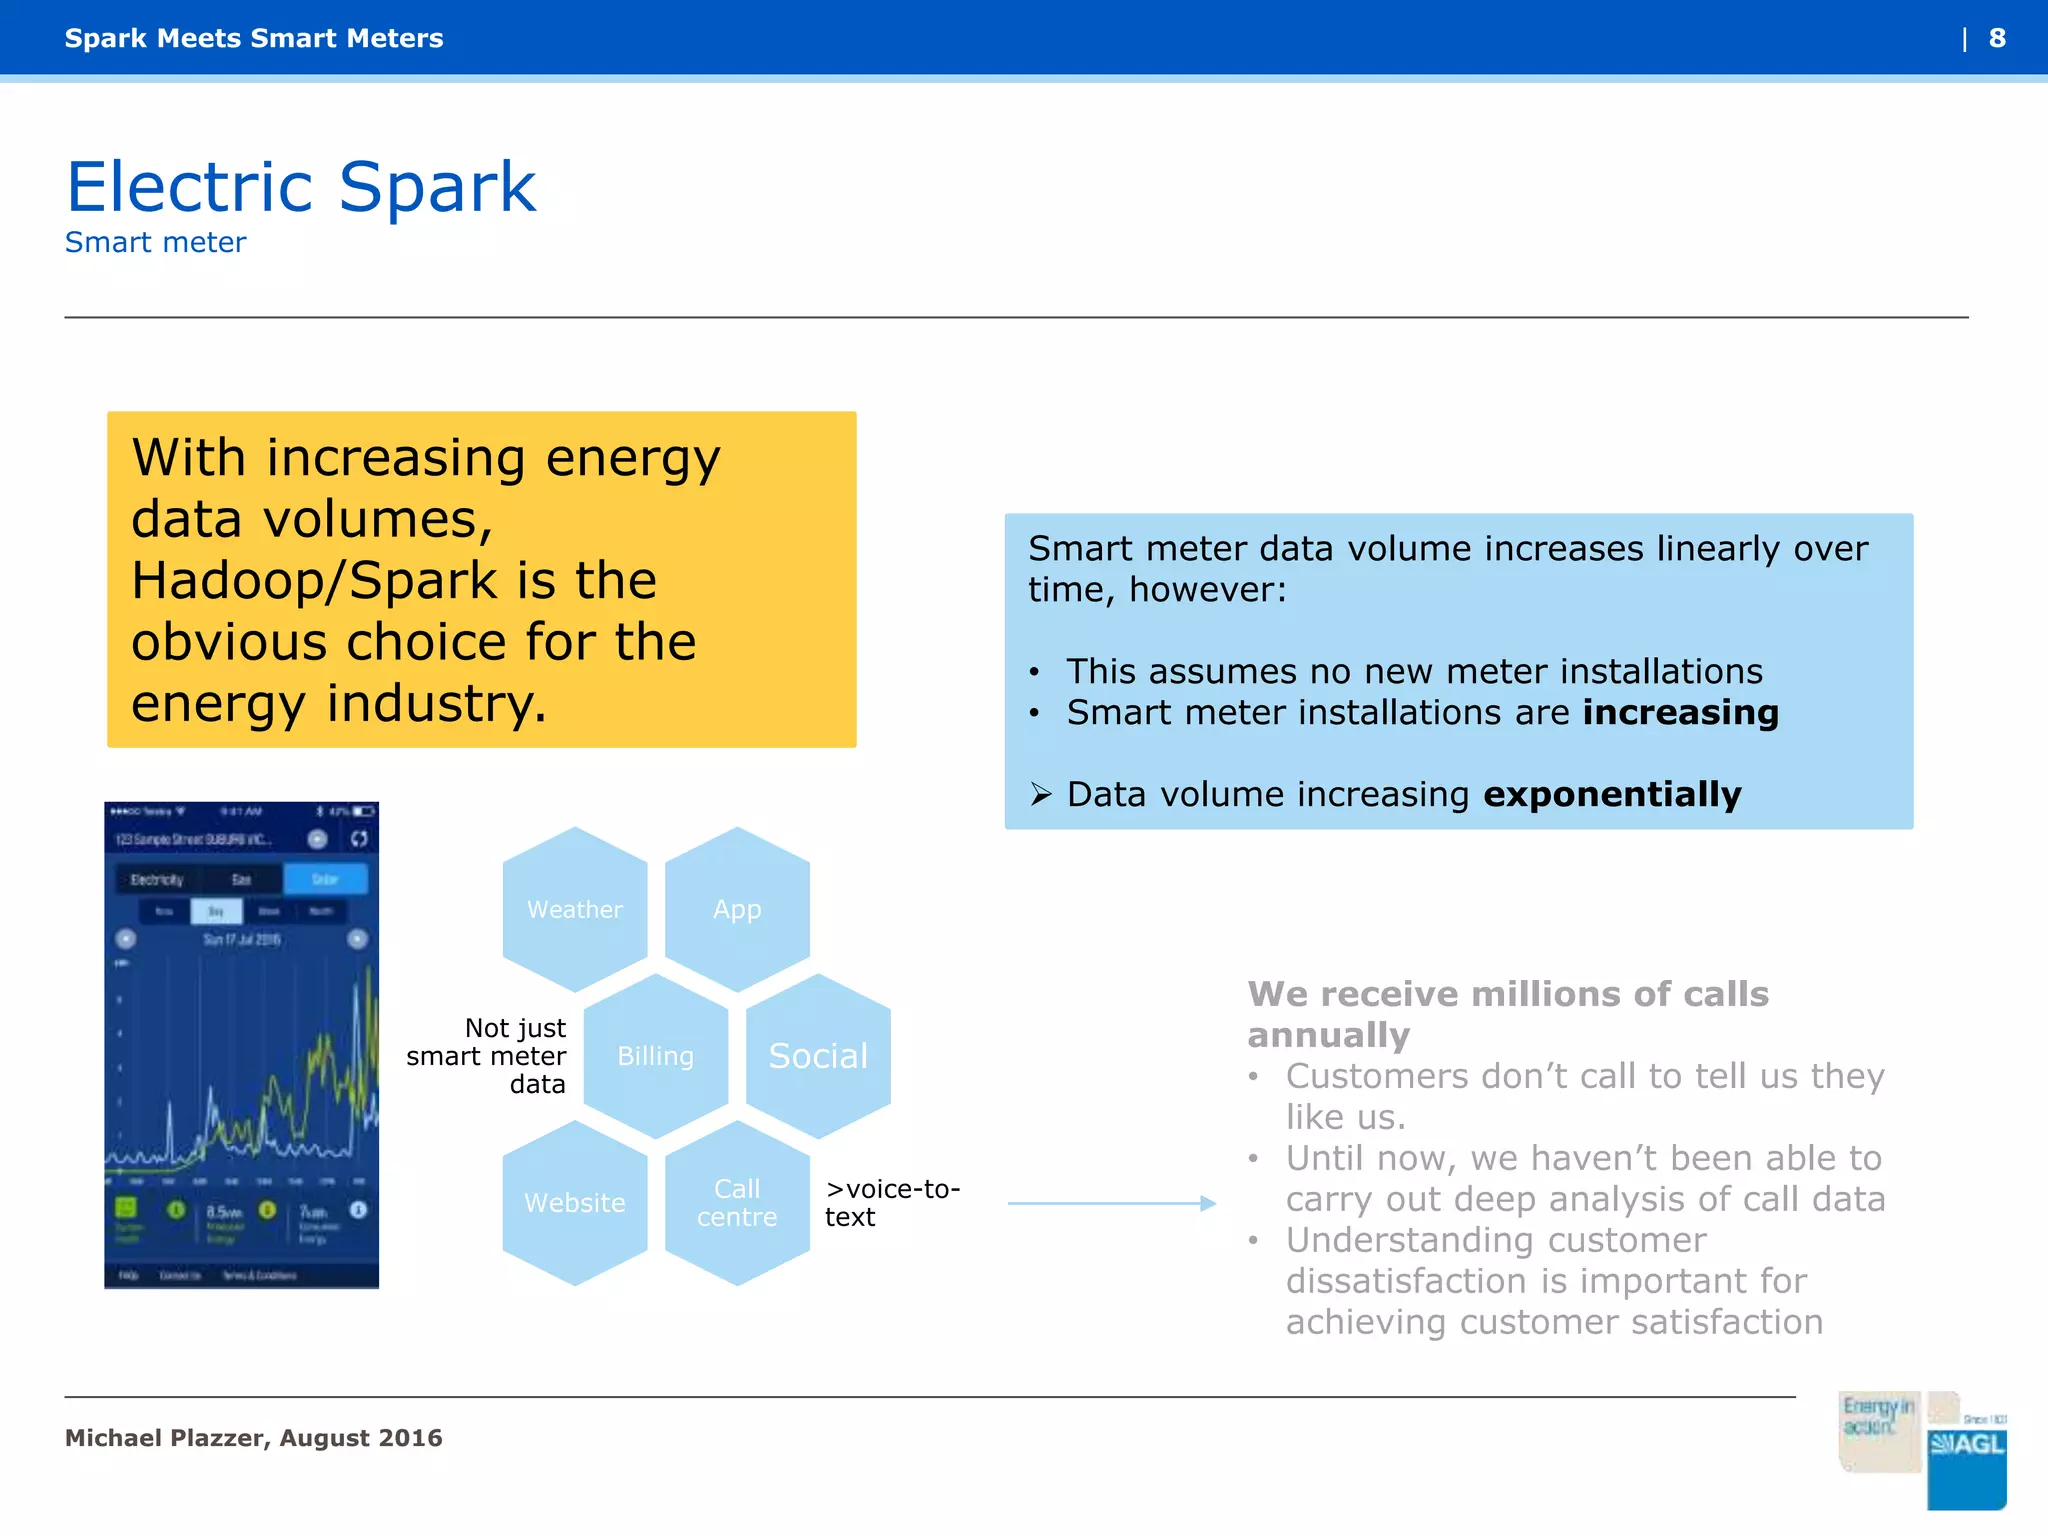
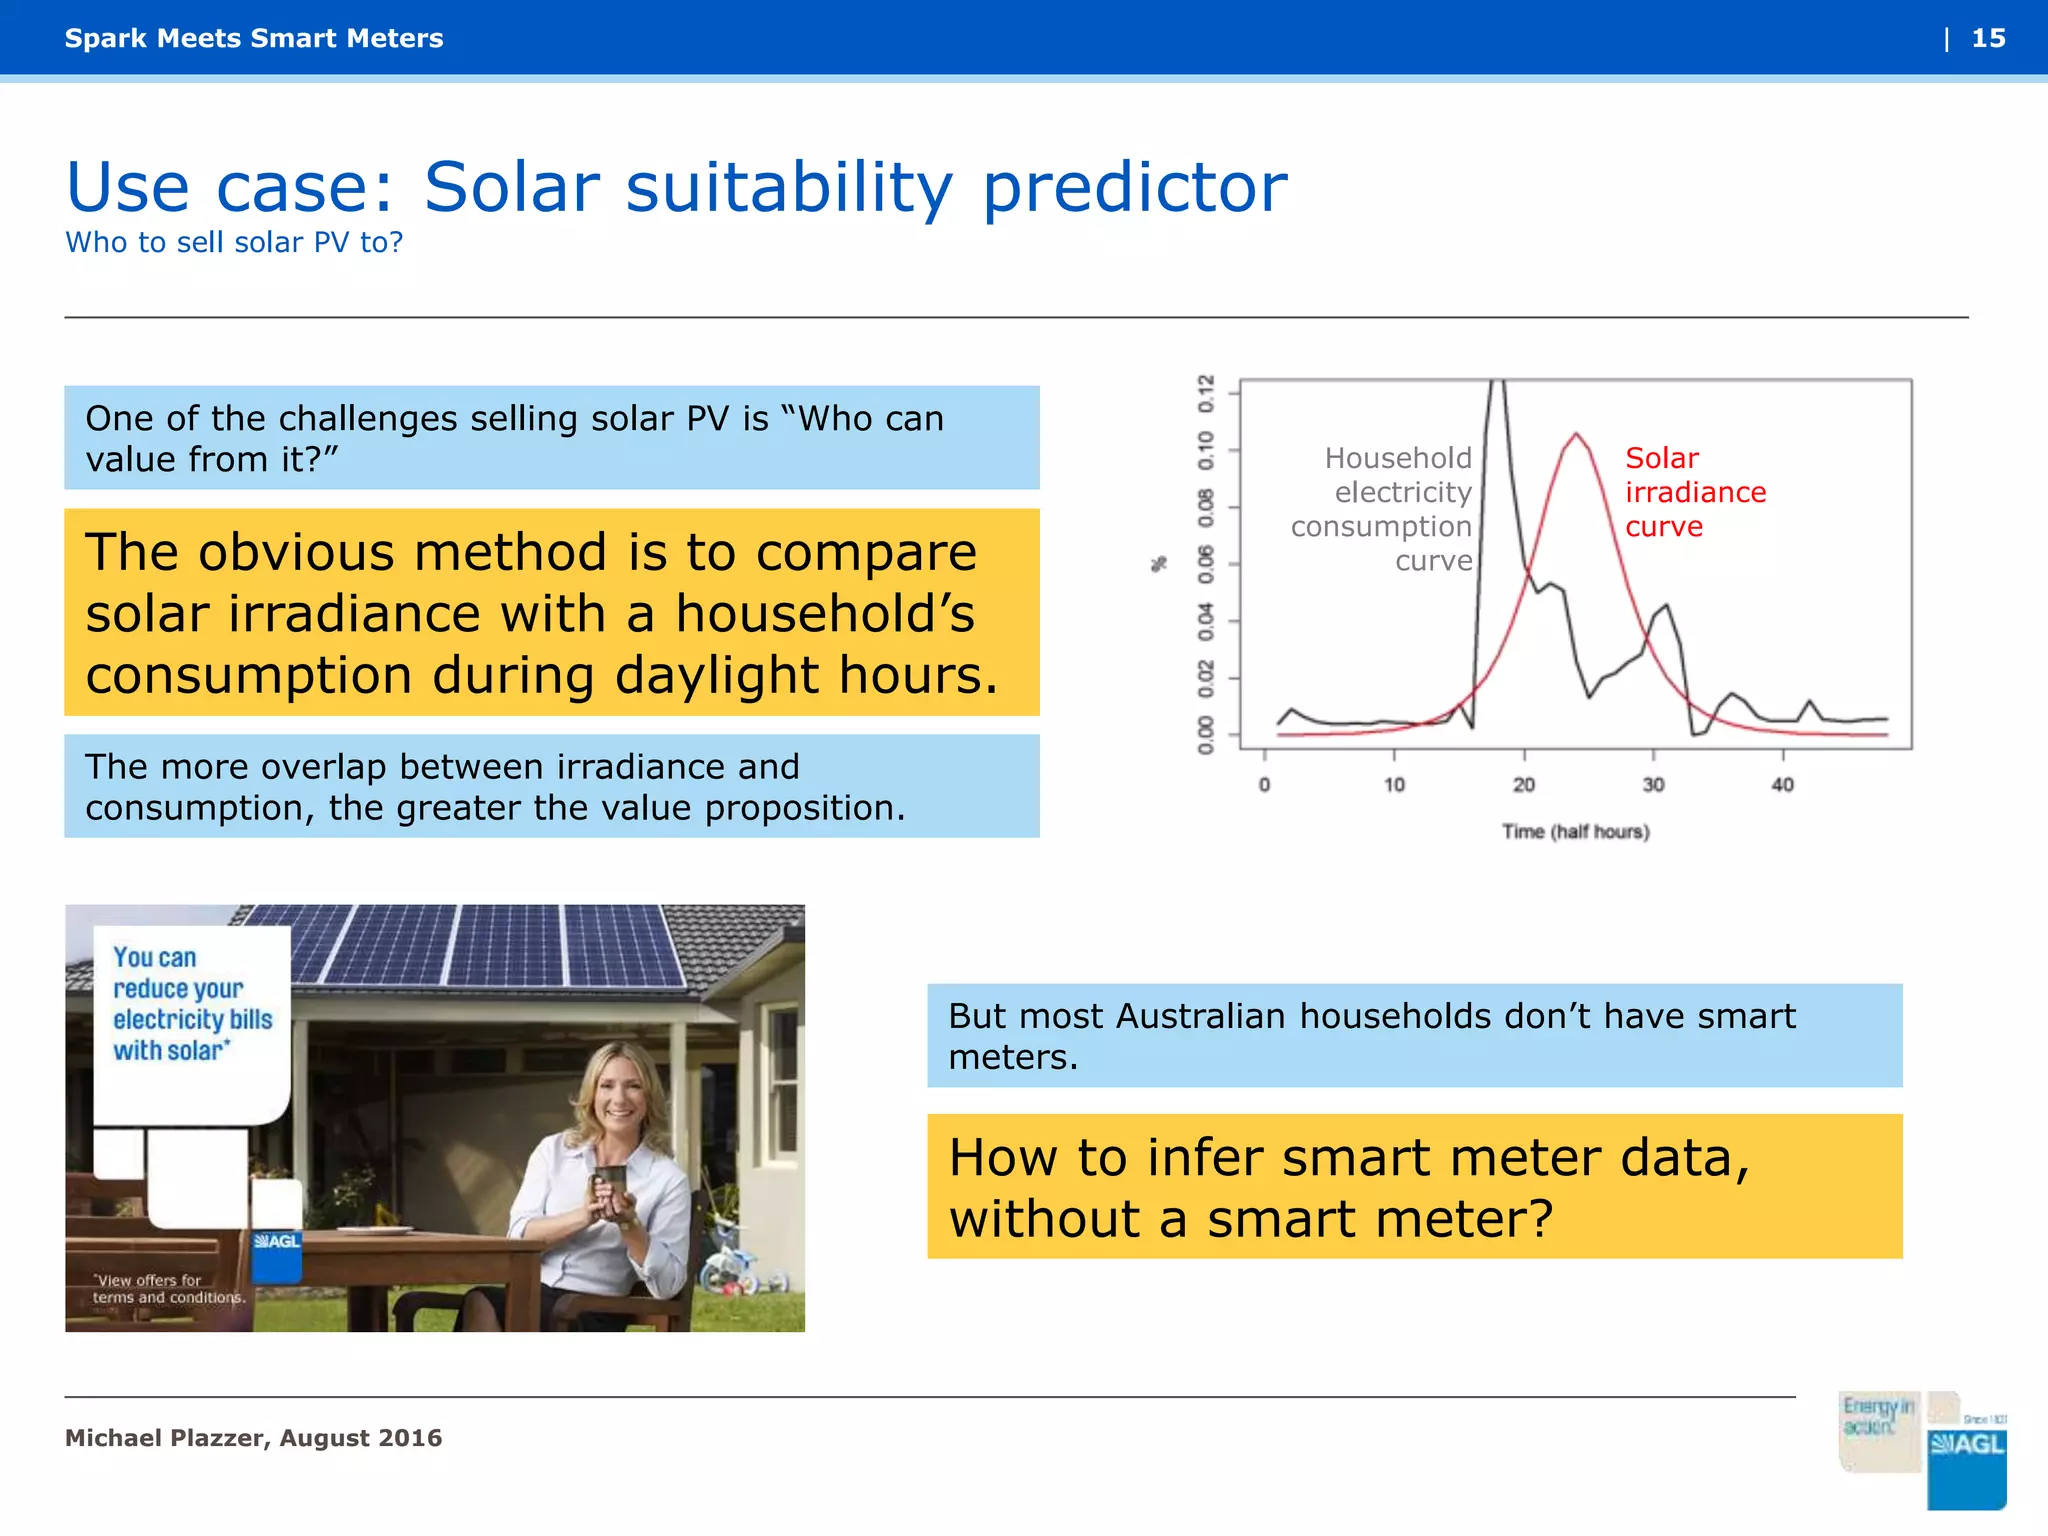
Spark Meets
Smart Meters
Hadoop powering
Australia’s energy
transformation
Presented by
Michael Plazzer
Date
August 2016
Outline
Spark Meets Smart Meters
Australia’s
Energy
Transformation
Big data and
energy
Smart meters
Spark power
Energy time
series data
Batteries and
cars
The internet
of energy
| 2
Michael Plazzer, August 2016
Australia’s Energy Transformation
Three inter-dependent technological evolutions
| 3
Analogue
meters: 4 data
points/year
Smart meters:
17520 data
points/year
Digital
meters:
Arbitrary
number of
data
points/year
Read
Transmit
Process
Michael Plazzer, August 2016
Spark Meets Smart Meters
1800s 1950s 2000s 2010s 2015s
Australia’s Energy Transformation
The shifting data bottleneck
| 4
Michael Plazzer, August 2016
Spark Meets Smart Meters
Why couldn’t we previously have monthly, weekly, or daily reads?
• Organic based carrier networks are expensive to operate
• Now we can use telco network infrastructure
Current constraints are no longer associated with transmission:
• storage
• processing
However, future constraints will not be with storage and processing:
• With battery+solar+cars and arbitrary read frequency
• transmission
Behind the meter generation/storage may lead to behind the meter
meters, connected by intelligent secure communication protocols:
• Amazon Alexa
• Apple HomeKit
• Google Home
Australia’s Energy Transformation
Current trends point towards an analytical energy infrastructure
| 5
Consumer financial perspective – Naïve case
• 10 kWh Tesla battery cost <$5000
• Assuming existing PV fully charges battery
• Example customer consumes 10kWh/day
• Average elect costs $0.3/kWh
• Equals $3/day
• $3 x 365 days
• <5 year break even point
AEMC
• Electricity prices continue to rise
• Solar PV & Battery storage costs continue to
fall
• Maths becomes increasingly compelling
Michael Plazzer, August 2016
Spark Meets Smart Meters
The internet of energy
The electricity market is increasingly becoming a two way street
| 6
Michael Plazzer, August 2016
Spark Meets Smart Meters
• Heating/Cooling are often most energy intensive
processes
 Smart thermostats can reduce power bills for the
consumer
• Energy retailers can also benefit by incentivising frugal
behaviour during periods of peak energy demand.
 Less stress on energy network infrastructure
 Less investment/maintenance expenditure required
Benefits the consumer, who ultimately pays for the energy
infrastructure
Electric vehicles and home battery storage
offer a valuable new sink/source of energy
to trade that benefits everyone
Electric Spark
Smart meter
Michael Plazzer, August 2016
| 8Spark Meets Smart Meters
With increasing energy
data volumes,
Hadoop/Spark is the
obvious choice for the
energy industry.
Smart meter data volume increases linearly over
time, however:
• This assumes no new meter installations
• Smart meter installations are increasing
 Data volume increasing exponentially
AppWeather
Billing
Not just
smart meter
data
Social
Call
centre
>voice-to-
text
Website
We receive millions of calls
annually
• Customers don’t call to tell us they
like us.
• Until now, we haven’t been able to
carry out deep analysis of call data
• Understanding customer
dissatisfaction is important for
achieving customer satisfaction
Selling Spark to the business
Many of the initial benefits of Spark will be optimising already existing processes.
Start with processes you already know about
Michael Plazzer, August 2016
| 9Spark Meets Smart Meters
Selling Spark to the business
Spark Meets Smart Meters
As a data scientist, I am more interested in new capability
Michael Plazzer, August 2016
| 10
As a data scientist, I’m more interested in new capability.
Case study: Customer usage profiles
Unsupervised learning allows us to categories customers based on how they consume electricity.
| 11
Source: Opower
Not allowed to show
ours…
Spark Meets Smart Meters
Michael Plazzer, August 2016
morning
%dailyusage
evening
Raw smart meter data
Late peaker
Double peaker
Marketing Tailored plans
Lifestyle inference
Best time to call
Energy Assigning value based on load
shape
E.g. Customers with heavy
daytime usage are more valuable
to companies with a large solar PV
capacity.
Case study: Customer usage profiles
Unsupervised learning allows us to categories customers based on how they consume electricity.
| 12
Source: Opower
Not allowed to show
ours…
Spark Meets Smart Meters
Michael Plazzer, August 2016
morning
%dailyusage
evening
Raw smart meter data
Late peaker
Double peaker
Scale usage
•Divide
consumption by
daily total
Filter
•Filter out
holidays, sick
days, unusual
days.
K-Means cluster
•Assign label to
customer based
on
consumption.
Smart meter data to customer insights
The current process
Michael Plazzer, August 2016
| 13Spark Meets Smart Meters
A bad way to practice data science
 Larger datasets necessitates a tedious piecemeal approach
 And we haven’t mentioned automation & support
For a monolithic database centric organisation, data science looks like:
Smart meter data to customer insights
The future process
Michael Plazzer, August 2016
| 14Spark Meets Smart Meters
With Spark + machine learning (Mllib)
A better way to practice data science (not the only way)
 Using enterprise supported Hadoop allows enterprise support
• I’m not waking up in the middle of the night when my model breaks
 Integration into broader Hadoop ecosystem
• Resource allocation
• Job scheduling
Use case: Solar suitability predictor
Spark Meets Smart Meters
Who to sell solar PV to?
| 15
Michael Plazzer, August 2016
One of the challenges selling solar PV is “Who can
value from it?” Solar
irradiance
curve
Household
electricity
consumption
curveThe obvious method is to compare
solar irradiance with a household’s
consumption during daylight hours.
But most Australian households don’t have smart
meters.
The more overlap between irradiance and
consumption, the greater the value proposition.
How to infer smart meter data,
without a smart meter?
Use case: Solar suitability predictor
Spark Meets Smart Meters
Who to sell solar PV to?
| 16
We can score our
smart meter
customers based on
their ‘solar
suitability’
Now build a dataset
of these customers
that contains all non
smart meter
derived data
Build model where
solar suitability
score is dependent
variable, and non
smart meter data
are independent
variables
We can apply this model to non-smart
meter customers to infer their solar
suitability score.
Michael Plazzer, August 2016
Challenges: Solar suitability predictor
Spark Meets Smart Meters
Who to sell solar PV to?
| 17
Michael Plazzer, August 2016
Large in-memory enterprise
appliance groaned under the smart
meter workload.
We often need to process the entire
smart meter dataset.
With hundreds of dependent
variables, advanced modelling on
local machine was challenging.
Our datasets are not getting
smaller.
Spark solves both of these problems
• In-memory scalable compute
• Data lake where smart meter/non-smart meter resides together
• Statistical/Machine learning libraries for modelling
Example smart meter data set
Time Series
Spark Meets Smart Meters
Is awesome
| 18
Michael Plazzer, August 2016
Smart meter ID Date 00:30 01:00 01:30 …
29871231 23-10-2013 1.4 0.8 0.2 …
43542456 23-10-2013 0.2 0.2 0.2 …
… … … … … … morning
%dailyusage
evening
What is Time Series data?
A timestamped series of values
Many time series data
Difference between forecasting and predicting?
Typically:
• One predicts a value
• Forecast a series of
values – time based
For example:
Australian smart meter data contains 48 variables/day (30
minute interval).
So if wanted to forecast/predict tomorrow’s electricity
consumption for a customer:
 We could build 48 individual regression models, or
 Forecast one day forward
Time Series - Load forecasting
Spark Meets Smart Meters
The stock market of energy
| 19
Very important to be able to forecast load:
• ‘Gentailer’ energy industry in Australia, the energy retailer (whom you pay) often
owns generation also.
• Generator sells into market, retailer buys energy and sells it to customer at fixed
rate.
• When prices are high, the retailer pays more
and effectively sells to customers at a loss
• When prices are low, the retailer pays less and
sells at a profit
If we could accurately forecast demand:
• We could buy cheaper energy in advance
• Provision our own generators better
• Avoid energy demand spikes that force
us to purchase expensive gas/diesel
generation
Michael Plazzer, August 2016
Time Series – Load(shape) forecasting
Spark Meets Smart Meters
Top-down and bottom-up
| 20
It’s straight forward to forecast ‘aggregate’ demand i.e. The sum of all energy
consumers.
Michael Plazzer, August 2016
The challenge is to forecast disaggregated demand i.e. What is
the forecast for each energy consumer.
morning
1kWh
evening
disaggregated aggregated
1GWh
morning evening
Why is this important?
Loadshape forecasting
Spark Meets Smart Meters
The internet of electricity – the intelec
| 21
Knowing the future state of
sink/source will determine what
action it takes before hand.
SolarPV
•Consume
•Sell
•Store
Heating
•Now
•Later
Battery
•Charge
•Discharge
•Sell
Car
•Charge
•Sell
HotWater
•Now
•Later
I want hot water at night time, and my car
charged for the morning, my battery charged
by solar during the day, and sold to the grid
late afternoon.
Too complicated/boring for a
human to control. Enterprise
energy management capability will
be a service.
• Sell management of your home
energy to the highest bidder?
Energy companies today are the
consumer energy brokers of the
future.
Michael Plazzer, August 2016
Spark-ts
Spark Meets Smart Meters
Time series at scale
| 22
Michael Plazzer, August 2016
The TimeSeriesRDD supports distributed in-memory operations, but
 Time series data is ordered
 Hadoop data is distributed
 Data on different workers
 Potential for time-series split across workers
 Cross-talk decreases performance
Over a million solar PV
installs across Australia
today
The volume of data lends itself to distributed storage and processing
Back of the envelope calculation:
 1 million digital meters/cars/batteries
 Collecting 1 minute interval data
 1,440 x 1Mil = 1.44B time series data points/day
?
Basic forecasting (ARIMA) available, but
 More advanced models exist (implemented in R)
 Less fashionable field then predictive modelling in data science
community
 Academically it is quite active, with tailored smart meter models
Summary
Spark Meets Smart Meters
? Big data and
energy
Smart meters
Spark power
Energy time
series data
Batteries and
cars
The internet
of energy
| 23
Michael Plazzer, August 2016
1800s 1950s 2000s 2010s 2015s ?
Thankyou!
Questions
Spark Meets Smart Meters | 24
Michael Plazzer, August 2016

Spark meets Smart Meters

  • 1.
    Spark Meets Smart Meters Hadooppowering Australia’s energy transformation Presented by Michael Plazzer Date August 2016
  • 2.
    Outline Spark Meets SmartMeters Australia’s Energy Transformation Big data and energy Smart meters Spark power Energy time series data Batteries and cars The internet of energy | 2 Michael Plazzer, August 2016
  • 3.
    Australia’s Energy Transformation Threeinter-dependent technological evolutions | 3 Analogue meters: 4 data points/year Smart meters: 17520 data points/year Digital meters: Arbitrary number of data points/year Read Transmit Process Michael Plazzer, August 2016 Spark Meets Smart Meters 1800s 1950s 2000s 2010s 2015s
  • 4.
    Australia’s Energy Transformation Theshifting data bottleneck | 4 Michael Plazzer, August 2016 Spark Meets Smart Meters Why couldn’t we previously have monthly, weekly, or daily reads? • Organic based carrier networks are expensive to operate • Now we can use telco network infrastructure Current constraints are no longer associated with transmission: • storage • processing However, future constraints will not be with storage and processing: • With battery+solar+cars and arbitrary read frequency • transmission Behind the meter generation/storage may lead to behind the meter meters, connected by intelligent secure communication protocols: • Amazon Alexa • Apple HomeKit • Google Home
  • 5.
    Australia’s Energy Transformation Currenttrends point towards an analytical energy infrastructure | 5 Consumer financial perspective – Naïve case • 10 kWh Tesla battery cost <$5000 • Assuming existing PV fully charges battery • Example customer consumes 10kWh/day • Average elect costs $0.3/kWh • Equals $3/day • $3 x 365 days • <5 year break even point AEMC • Electricity prices continue to rise • Solar PV & Battery storage costs continue to fall • Maths becomes increasingly compelling Michael Plazzer, August 2016 Spark Meets Smart Meters
  • 6.
    The internet ofenergy The electricity market is increasingly becoming a two way street | 6 Michael Plazzer, August 2016 Spark Meets Smart Meters • Heating/Cooling are often most energy intensive processes  Smart thermostats can reduce power bills for the consumer • Energy retailers can also benefit by incentivising frugal behaviour during periods of peak energy demand.  Less stress on energy network infrastructure  Less investment/maintenance expenditure required Benefits the consumer, who ultimately pays for the energy infrastructure Electric vehicles and home battery storage offer a valuable new sink/source of energy to trade that benefits everyone
  • 8.
    Electric Spark Smart meter MichaelPlazzer, August 2016 | 8Spark Meets Smart Meters With increasing energy data volumes, Hadoop/Spark is the obvious choice for the energy industry. Smart meter data volume increases linearly over time, however: • This assumes no new meter installations • Smart meter installations are increasing  Data volume increasing exponentially AppWeather Billing Not just smart meter data Social Call centre >voice-to- text Website We receive millions of calls annually • Customers don’t call to tell us they like us. • Until now, we haven’t been able to carry out deep analysis of call data • Understanding customer dissatisfaction is important for achieving customer satisfaction
  • 9.
    Selling Spark tothe business Many of the initial benefits of Spark will be optimising already existing processes. Start with processes you already know about Michael Plazzer, August 2016 | 9Spark Meets Smart Meters
  • 10.
    Selling Spark tothe business Spark Meets Smart Meters As a data scientist, I am more interested in new capability Michael Plazzer, August 2016 | 10 As a data scientist, I’m more interested in new capability.
  • 11.
    Case study: Customerusage profiles Unsupervised learning allows us to categories customers based on how they consume electricity. | 11 Source: Opower Not allowed to show ours… Spark Meets Smart Meters Michael Plazzer, August 2016 morning %dailyusage evening Raw smart meter data Late peaker Double peaker Marketing Tailored plans Lifestyle inference Best time to call Energy Assigning value based on load shape E.g. Customers with heavy daytime usage are more valuable to companies with a large solar PV capacity.
  • 12.
    Case study: Customerusage profiles Unsupervised learning allows us to categories customers based on how they consume electricity. | 12 Source: Opower Not allowed to show ours… Spark Meets Smart Meters Michael Plazzer, August 2016 morning %dailyusage evening Raw smart meter data Late peaker Double peaker Scale usage •Divide consumption by daily total Filter •Filter out holidays, sick days, unusual days. K-Means cluster •Assign label to customer based on consumption.
  • 13.
    Smart meter datato customer insights The current process Michael Plazzer, August 2016 | 13Spark Meets Smart Meters A bad way to practice data science  Larger datasets necessitates a tedious piecemeal approach  And we haven’t mentioned automation & support For a monolithic database centric organisation, data science looks like:
  • 14.
    Smart meter datato customer insights The future process Michael Plazzer, August 2016 | 14Spark Meets Smart Meters With Spark + machine learning (Mllib) A better way to practice data science (not the only way)  Using enterprise supported Hadoop allows enterprise support • I’m not waking up in the middle of the night when my model breaks  Integration into broader Hadoop ecosystem • Resource allocation • Job scheduling
  • 15.
    Use case: Solarsuitability predictor Spark Meets Smart Meters Who to sell solar PV to? | 15 Michael Plazzer, August 2016 One of the challenges selling solar PV is “Who can value from it?” Solar irradiance curve Household electricity consumption curveThe obvious method is to compare solar irradiance with a household’s consumption during daylight hours. But most Australian households don’t have smart meters. The more overlap between irradiance and consumption, the greater the value proposition. How to infer smart meter data, without a smart meter?
  • 16.
    Use case: Solarsuitability predictor Spark Meets Smart Meters Who to sell solar PV to? | 16 We can score our smart meter customers based on their ‘solar suitability’ Now build a dataset of these customers that contains all non smart meter derived data Build model where solar suitability score is dependent variable, and non smart meter data are independent variables We can apply this model to non-smart meter customers to infer their solar suitability score. Michael Plazzer, August 2016
  • 17.
    Challenges: Solar suitabilitypredictor Spark Meets Smart Meters Who to sell solar PV to? | 17 Michael Plazzer, August 2016 Large in-memory enterprise appliance groaned under the smart meter workload. We often need to process the entire smart meter dataset. With hundreds of dependent variables, advanced modelling on local machine was challenging. Our datasets are not getting smaller. Spark solves both of these problems • In-memory scalable compute • Data lake where smart meter/non-smart meter resides together • Statistical/Machine learning libraries for modelling
  • 18.
    Example smart meterdata set Time Series Spark Meets Smart Meters Is awesome | 18 Michael Plazzer, August 2016 Smart meter ID Date 00:30 01:00 01:30 … 29871231 23-10-2013 1.4 0.8 0.2 … 43542456 23-10-2013 0.2 0.2 0.2 … … … … … … … morning %dailyusage evening What is Time Series data? A timestamped series of values Many time series data Difference between forecasting and predicting? Typically: • One predicts a value • Forecast a series of values – time based For example: Australian smart meter data contains 48 variables/day (30 minute interval). So if wanted to forecast/predict tomorrow’s electricity consumption for a customer:  We could build 48 individual regression models, or  Forecast one day forward
  • 19.
    Time Series -Load forecasting Spark Meets Smart Meters The stock market of energy | 19 Very important to be able to forecast load: • ‘Gentailer’ energy industry in Australia, the energy retailer (whom you pay) often owns generation also. • Generator sells into market, retailer buys energy and sells it to customer at fixed rate. • When prices are high, the retailer pays more and effectively sells to customers at a loss • When prices are low, the retailer pays less and sells at a profit If we could accurately forecast demand: • We could buy cheaper energy in advance • Provision our own generators better • Avoid energy demand spikes that force us to purchase expensive gas/diesel generation Michael Plazzer, August 2016
  • 20.
    Time Series –Load(shape) forecasting Spark Meets Smart Meters Top-down and bottom-up | 20 It’s straight forward to forecast ‘aggregate’ demand i.e. The sum of all energy consumers. Michael Plazzer, August 2016 The challenge is to forecast disaggregated demand i.e. What is the forecast for each energy consumer. morning 1kWh evening disaggregated aggregated 1GWh morning evening Why is this important?
  • 21.
    Loadshape forecasting Spark MeetsSmart Meters The internet of electricity – the intelec | 21 Knowing the future state of sink/source will determine what action it takes before hand. SolarPV •Consume •Sell •Store Heating •Now •Later Battery •Charge •Discharge •Sell Car •Charge •Sell HotWater •Now •Later I want hot water at night time, and my car charged for the morning, my battery charged by solar during the day, and sold to the grid late afternoon. Too complicated/boring for a human to control. Enterprise energy management capability will be a service. • Sell management of your home energy to the highest bidder? Energy companies today are the consumer energy brokers of the future. Michael Plazzer, August 2016
  • 22.
    Spark-ts Spark Meets SmartMeters Time series at scale | 22 Michael Plazzer, August 2016 The TimeSeriesRDD supports distributed in-memory operations, but  Time series data is ordered  Hadoop data is distributed  Data on different workers  Potential for time-series split across workers  Cross-talk decreases performance Over a million solar PV installs across Australia today The volume of data lends itself to distributed storage and processing Back of the envelope calculation:  1 million digital meters/cars/batteries  Collecting 1 minute interval data  1,440 x 1Mil = 1.44B time series data points/day ? Basic forecasting (ARIMA) available, but  More advanced models exist (implemented in R)  Less fashionable field then predictive modelling in data science community  Academically it is quite active, with tailored smart meter models
  • 23.
    Summary Spark Meets SmartMeters ? Big data and energy Smart meters Spark power Energy time series data Batteries and cars The internet of energy | 23 Michael Plazzer, August 2016 1800s 1950s 2000s 2010s 2015s ?
  • 24.
    Thankyou! Questions Spark Meets SmartMeters | 24 Michael Plazzer, August 2016

Editor's Notes

  • #12 Rare to see these published since they expose a company’s supply profile
  • #13 Rare to see these published since they expose a company’s supply profile