Downloaded 1,215 times


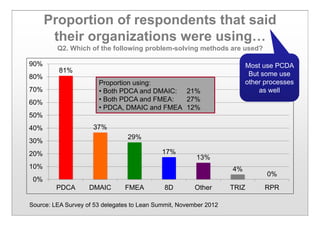
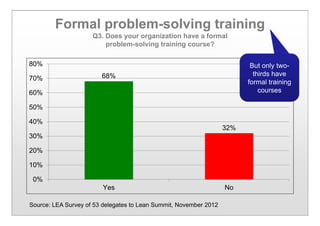


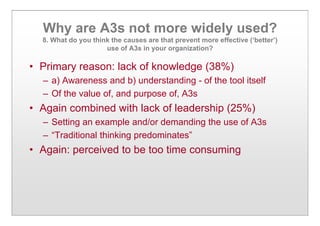


The workshop presented insights on the application of PDCA and A3 thinking in problem-solving within organizations, revealing that many lack a common process. While a significant number of respondents reported using multiple problem-solving methods, only two-thirds have formal training in this area. Key barriers to the broader use of A3 thinking include a lack of knowledge, leadership support, and perceived time constraints.