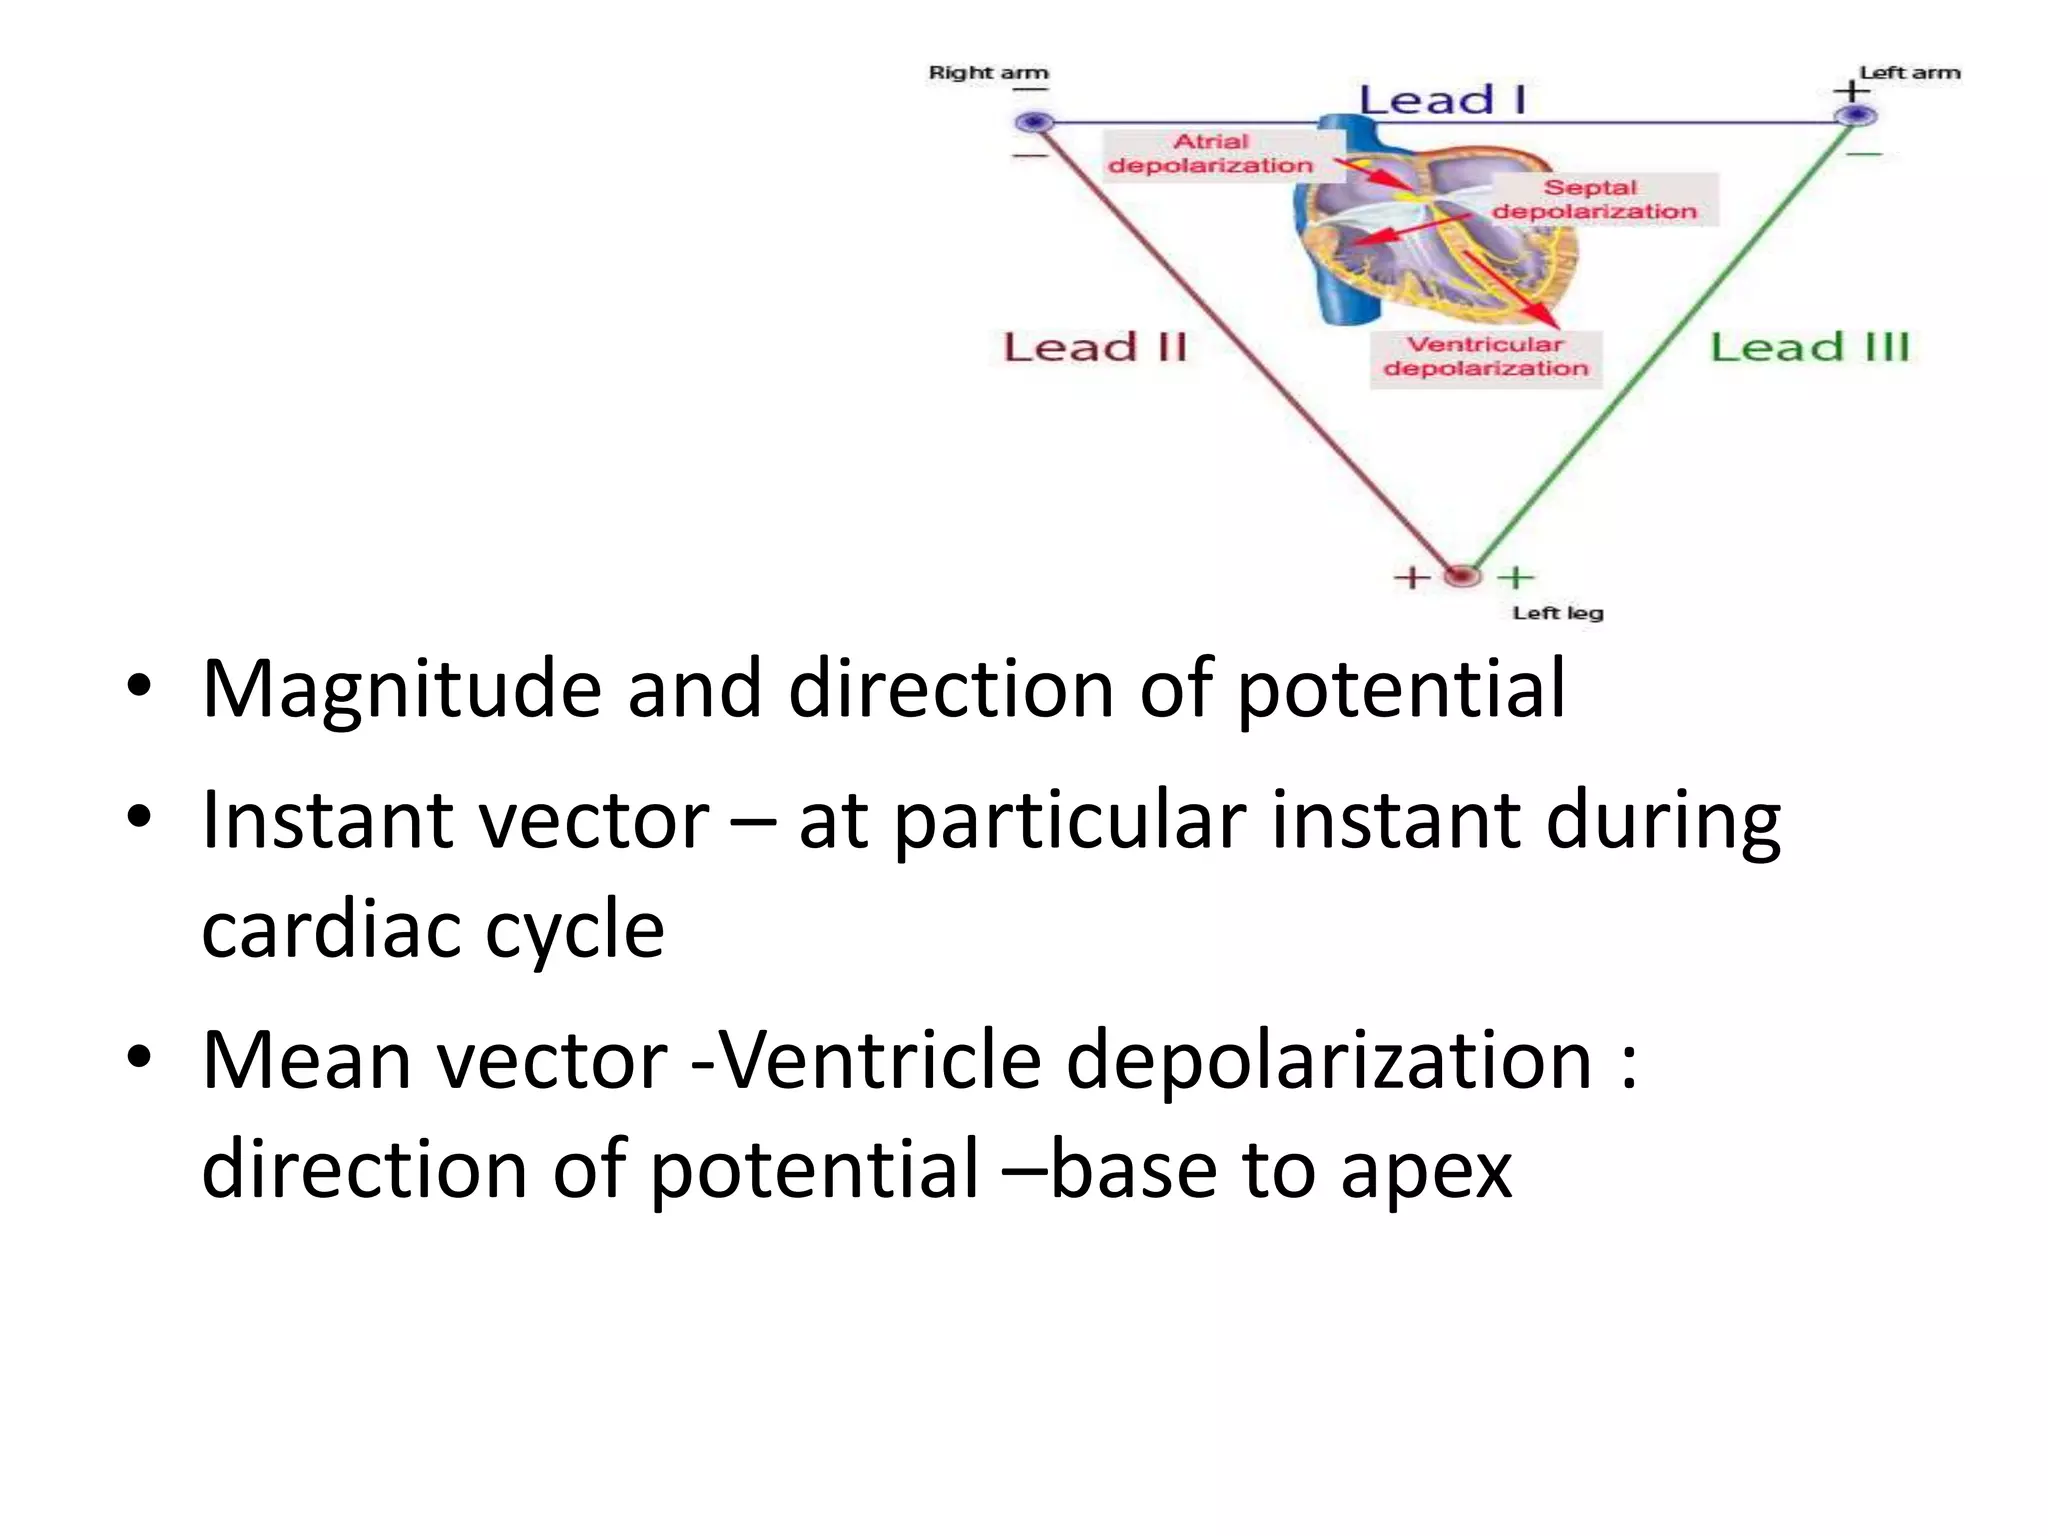
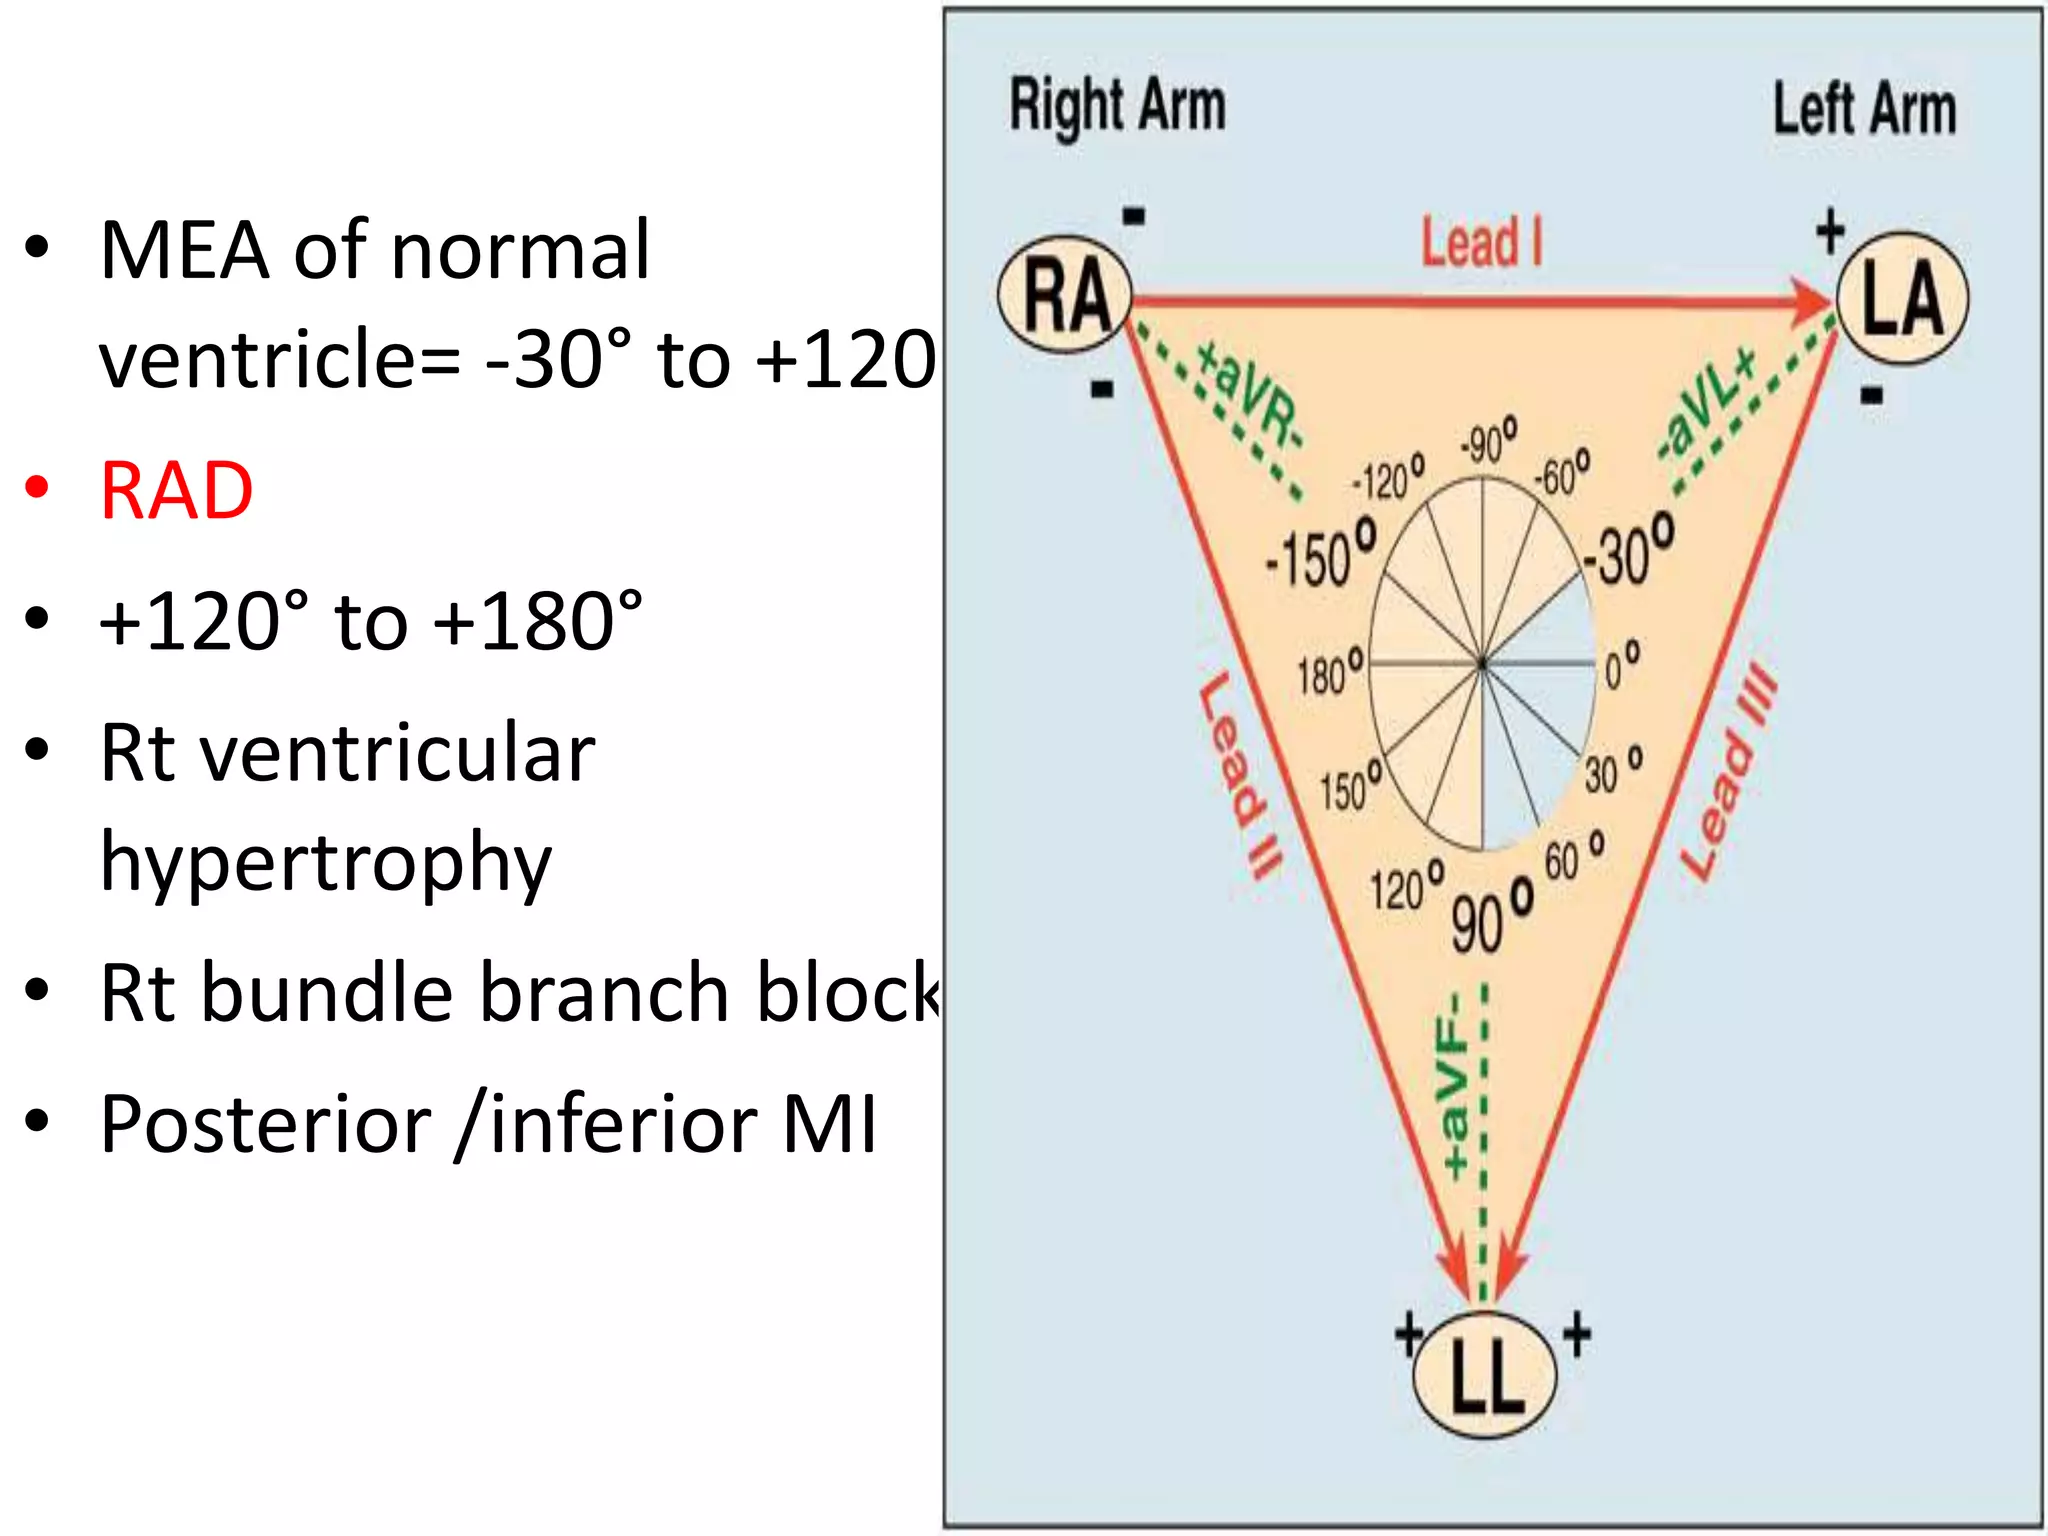
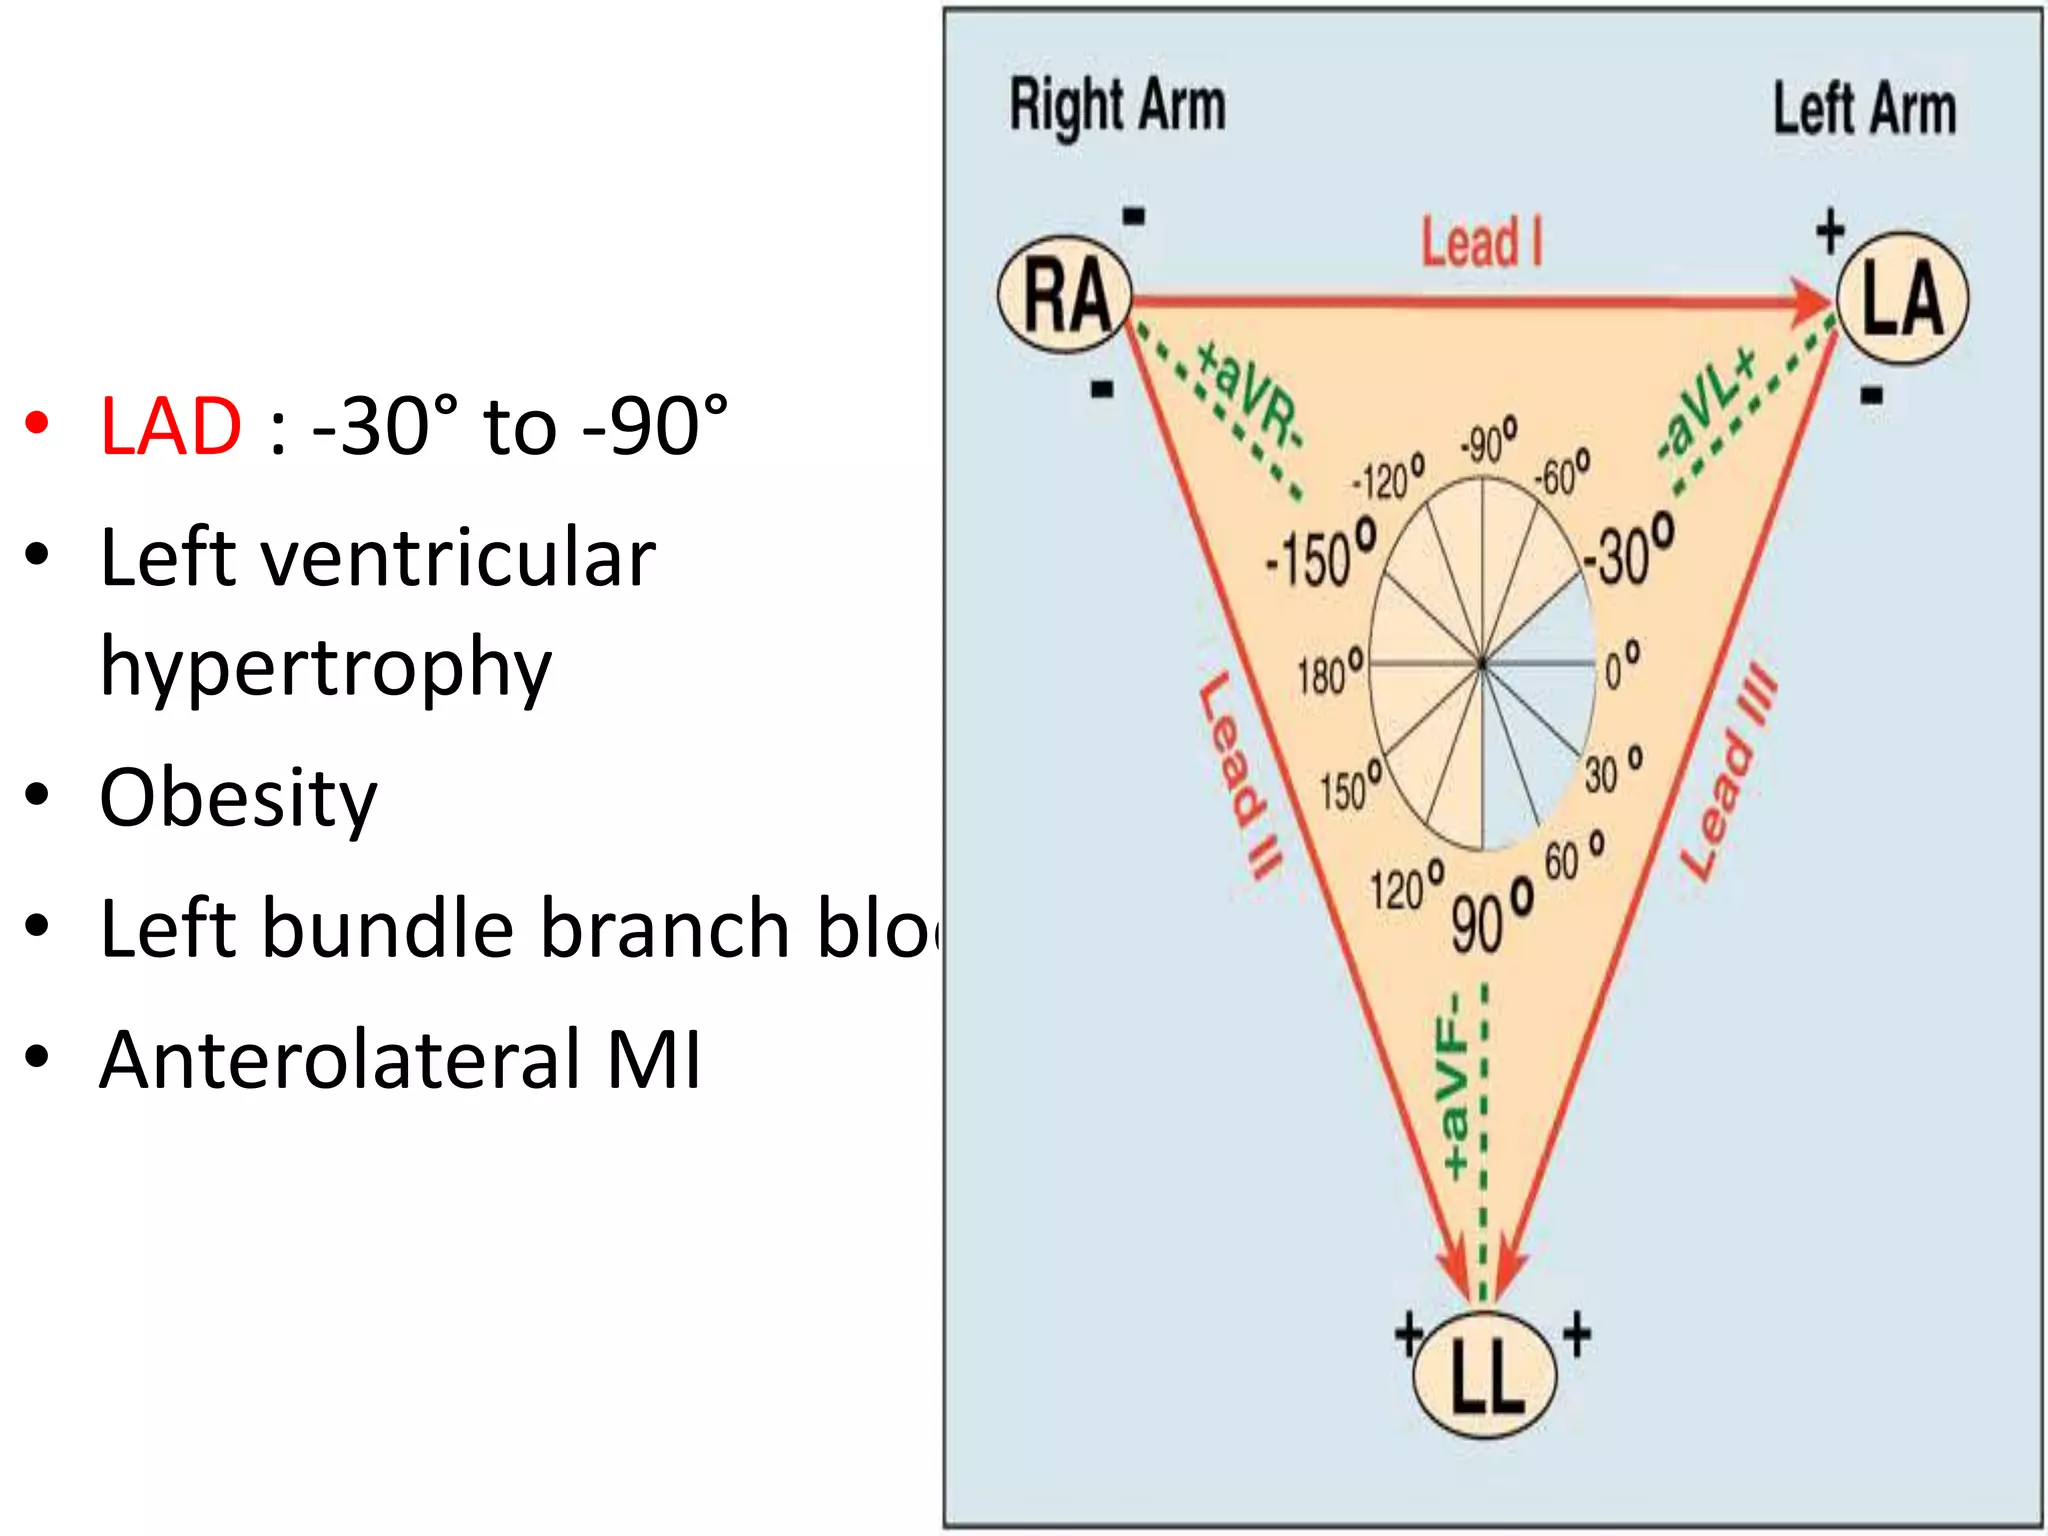
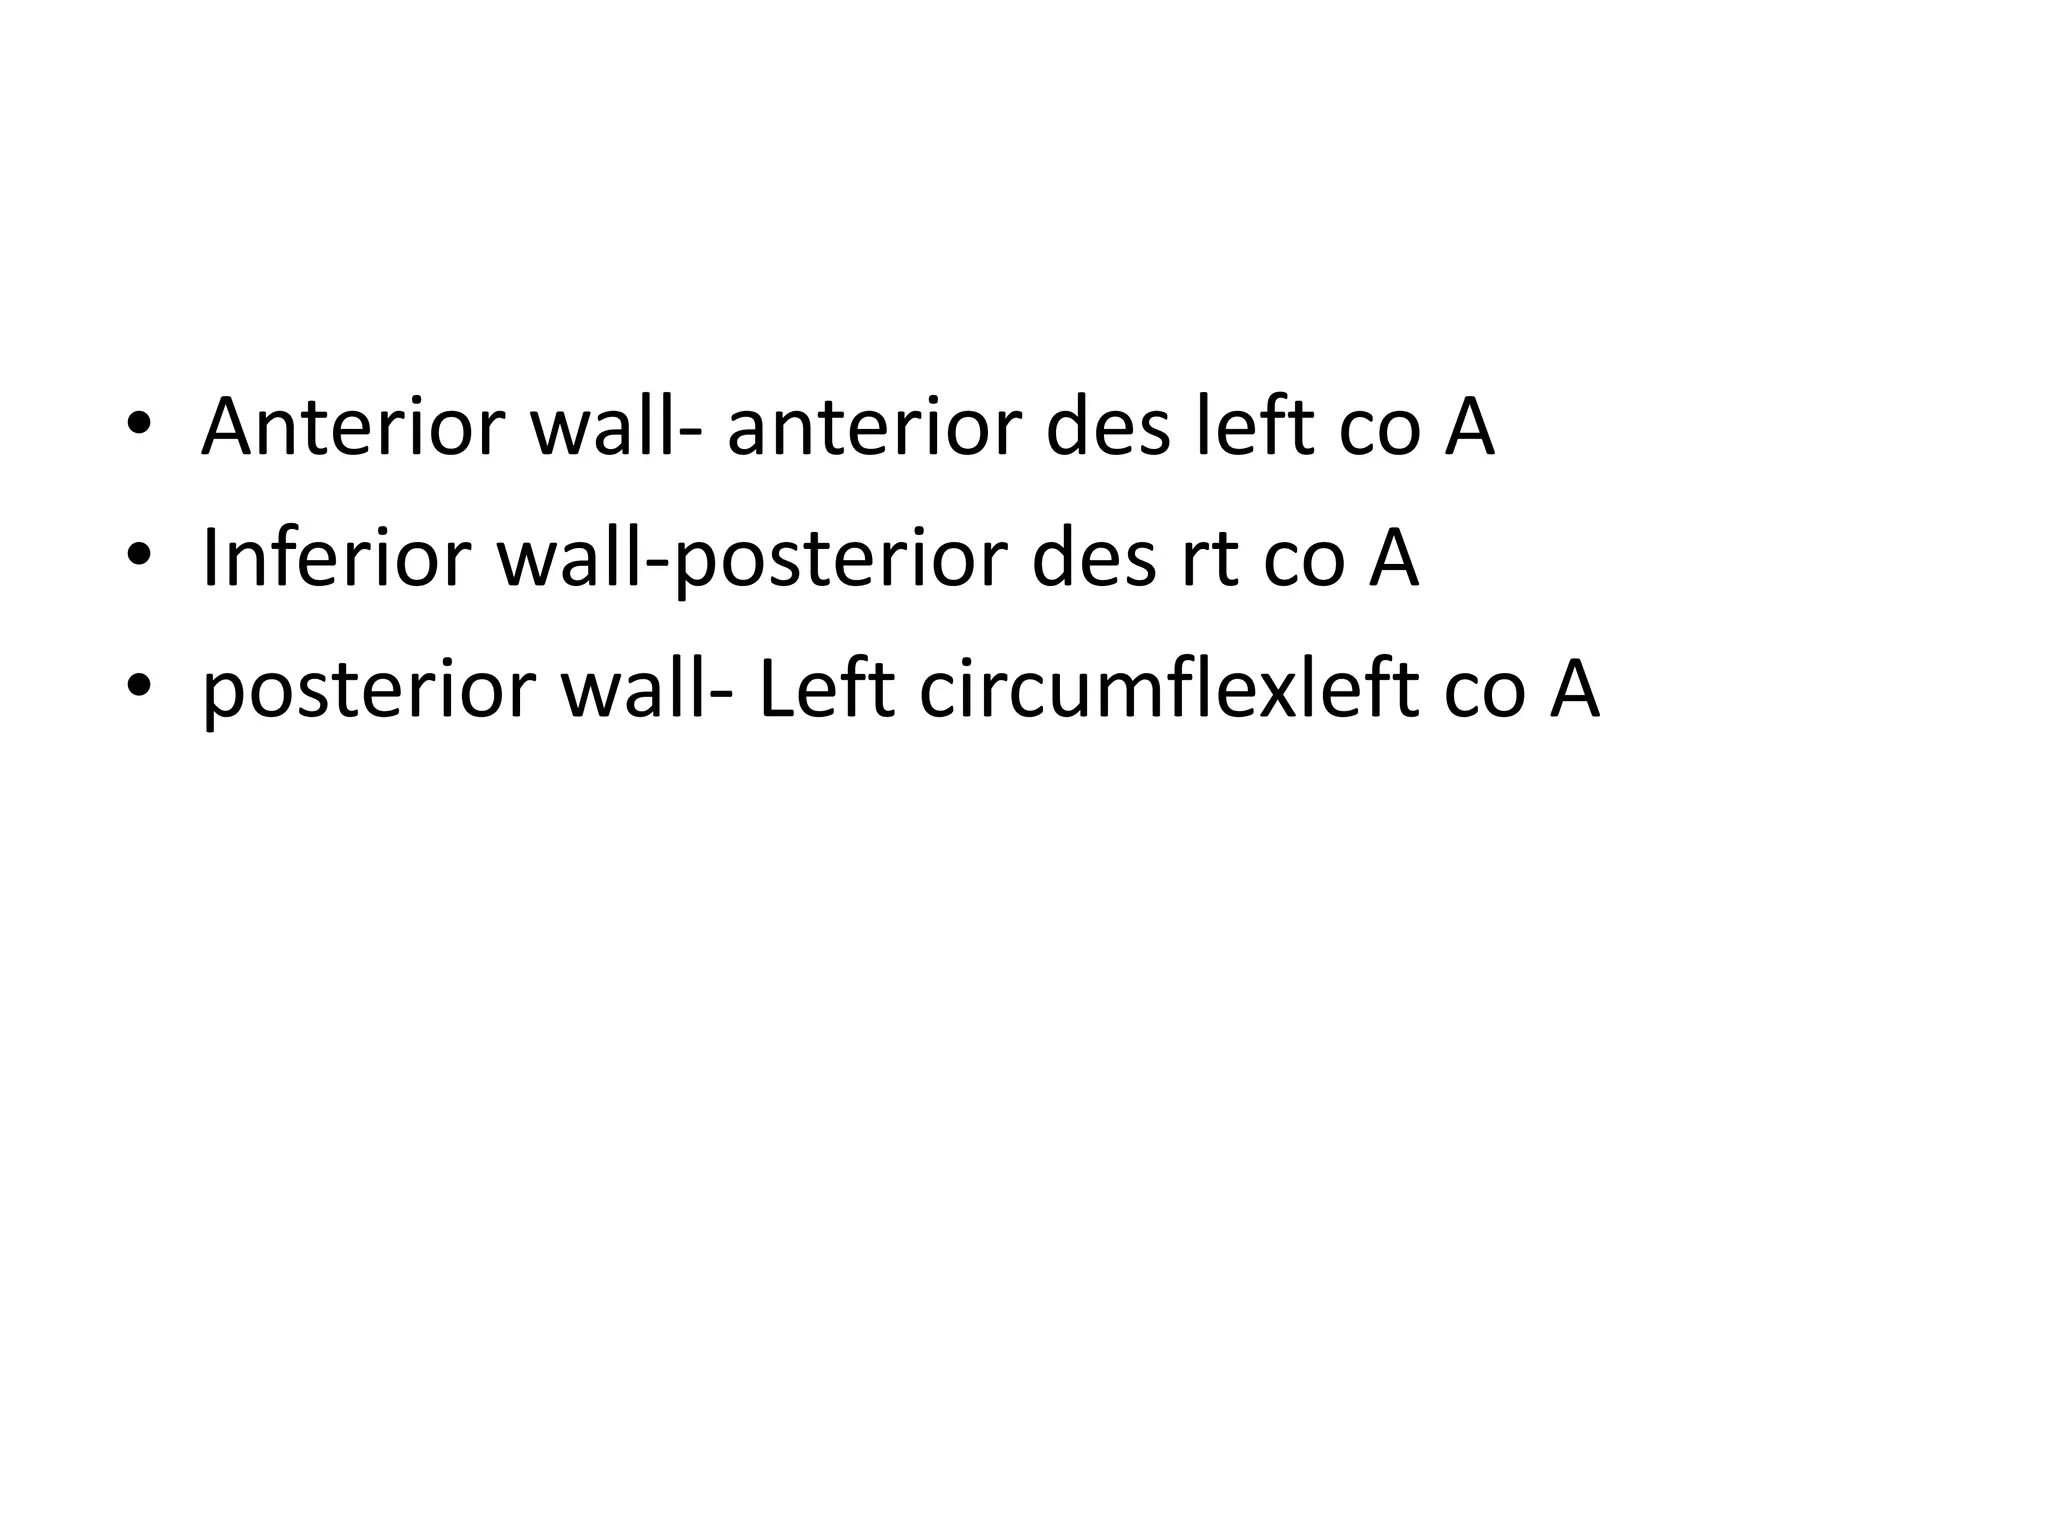
2. Background
• The spread of the cardiac impulse gives rise to
the main deflections of the ECG.
• The total electrical activity at any one moment
of time can be summated and represented by
a single electrical force.
• This force has magnitude and direction and is
termed the instantaneous vector.
3. • All the vectors occurring in the ventricles
during the production of the QRS can be
averaged.
• The direction of the resulting vector of
electrical spread is called the MEAN QRS AXIS.
4. • It is customary to measure this only in the
frontal plane.
• It is based on the orientation of the limb
leads, I, II , III, aVR, aVL & aVF.
• The limb lead with the tallest R wave will be
the closest to the QRS axis.
5. • Magnitude and direction of potential
• Instant vector – at particular instant during
cardiac cycle
• Mean vector -Ventricle depolarization :
direction of potential –base to apex
11. • HIS bundle electrogram
• Using intracardiac electrodes
• A deflection-
activation of AV node
• H spike-
Transmission through
His bundle
• V deflection-
ventricular depolarisation
• Uses
• In heart blocks
12. • PA interval
• First appearance of atrial depolarization to A
wave
• 27msec
• AH interval -92msec
• HV interval – 43msec
13. • Cardiac arrhthymias
• Distruption of normal rhthym
• Sinus rhthym – SA node –pacemaker, P wave
followed by QRS complex, P-R & Q-T interval –
normal.
• Sinus arrhthymia
• Normal sinus rhthym except varied RR interval
• Phases of respiration
• Children
• Endurance athelets
16. • SA nodal block
• Elderly pt recovering from coronary artery
occlusion
• AV node becomes pacemaker –AV nodal
rhthym/ junctional rhythm
• Inverted P wave , normal QRS , slow HR
17. • AV nodal block
• First degree
• Second degree
• Complete
• First degree
• Slowing of conduction at AV node
18. • Second degree
• Not all atrial impluses are conducted to
ventricles
• One ventricular contraction after every 2,3 /4
atrial contractions
• Mobitz type I (Wenckebach phenomenon)
• Progressive lengthening of PR interval & finally
failure of one impulse
• Mobitz type II(Periodic block)
• Occasional failure of conduction
• Atrial:ventricular rate= 6:5 or 8:7
19. • Third degree /complete AV nodal block
• No impulse transmission to ventricles
• Ventricles beats at their own rhthym-
idioventricular rhthym
• Ventricular asystole –dizziness & fainting –
Stokes-Adams syndrome
• ECG- complete dissociation between P wave &
QRS complex-atrioventricular dissociation
• In organic heart diseases
• Septal MI
20.
21. • Myocardial Infarction
• ST segment elevation (zone of injury)
• Inverted T wave(surrounding tissue)
• Deep Q wave(dead muscle)
22.
23. • Within mins to hrs ST seg elevation with Tall T
wave
• After 2days T waves-inverted
• After a week deep Q wave
• ST seg and T waves starts become normal
24. Infarction. When myocardial injury persists, MI is
the result.
• During the earliest stage of MI, known as the
hyperacute phase, the T waves become tall
and narrow. This configuration is referred to as
hyperacute or peaked T waves.
• Within a few hours, these hyperacute T waves
invert.
• Next, the ST segments elevate, a pattern that
usually lasts from several hours to several
days.
25. • In addition to the ST segment elevations in the
leads of the ECG facing the injured heart, the
leads facing away from the injured area may
show ST segment depression.
• This finding is known as reciprocal ST segment
changes.
• Reciprocal changes are most likely to be seen at
the onset of infarction, but their presence on the
ECG does not last long.
• Reciprocal ST segment depressions may simply be
a mirror image of the ST segment elevations.
26. • Anterior wall-Lead I, aVL & chest leads
• Inferior wall- II, III, aVF
• Lateral wall – Lead I, aVL, & V6
• Reciprocal changes- L-II, L-III, aVF & V1
27.
28. • Physiological changes in acute MI
• Injury current- affected to unaffected part
• 1.Decline in RMP
• 2.Delayed depolarization
• 3.Rapid repolarization
29. • Decline in RMP
• Ischaemic necrosis- K efflux & Na influx
• Inside of cell- less negative
• Extracellular current flows into the infarct
30. • During depolarization
• Infarcted area- slowly depolarized
• Inside of infarcted cells attains positivity later
(remains negative)
• Extracellular current flows out of infarct
31. • During repolarization
• Infarct cell-Rapid repolarization due to
opening of K channels (K efflux)
• Inside becomes negative
32. • Therefore there is
• Resultant extracellular current flow out of
infarct during depolarization & repolarization
• Flow of current towards recording electrode
over infarcted area causes increased positivity
between S and T wave- ST seg elevation.
33.
34. • Anterior wall- anterior des left co A
• Inferior wall-posterior des rt co A
• posterior wall- Left circumflexleft co A