Keynote commodity daily report 211111
•
0 likes•442 views

The daily commodity outlook report summarizes the performance of gold, silver, and crude oil futures contracts on the MCX exchange. Gold prices closed marginally higher after bouncing back from intraday lows. Technical indicators suggest further selling pressure. Silver prices closed with modest gains after recovering from losses, and technicals indicate short-term buying support. Crude oil futures ended the day higher despite trading lower intraday, and technical indicators point to intermediate profit taking.

Recommended
Recommended
More Related Content
What's hot
What's hot (19)
Viewers also liked
Viewers also liked (20)
Similar to Keynote commodity daily report 211111
Similar to Keynote commodity daily report 211111 (15)
More from Keynote Capitals Ltd.
More from Keynote Capitals Ltd. (20)
Recently uploaded
Recently uploaded (20)
Keynote commodity daily report 211111
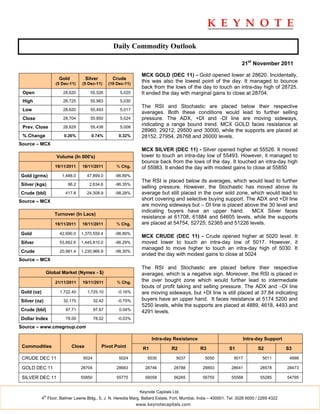
- 1. Daily Commodity Outlook 21st November 2011 MCX GOLD (DEC 11) - Gold opened lower at 28620. Incidentally, Gold Silver Crude (5 Dec-11) (5 Dec-11) (19 Dec-11) this was also the lowest point of the day. It managed to bounce back from the lows of the day to touch an intra-day high of 28725. Open 28,620 55,526 5,020 It ended the day with marginal gains to close at 28704. High 28,725 55,983 5,030 The RSI and Stochastic are placed below their respective Low 28,620 55,493 5,017 averages. Both these conditions would lead to further selling Close 28,704 55,850 5,024 pressure. The ADX, +DI and -DI line are moving sideways, Prev. Close 28,629 55,438 5,008 indicating a range bound trend. MCX GOLD faces resistance at 28960, 29212, 29500 and 30000, while the supports are placed at % Change 0.26% 0.74% 0.32% 28152, 27954, 26768 and 26000 levels. Source – MCX MCX SILVER (DEC 11) - Silver opened higher at 55526. It moved Volume (In 000's) lower to touch an intra-day low of 55493. However, it managed to bounce back from the lows of the day. It touched an intra-day high 19/11/2011 18/11/2011 % Chg. of 55983. It ended the day with modest gains to close at 55850 Gold (grms) 1,488.0 47,899.0 -96.89% The RSI is placed below its averages, which would lead to further Silver (kgs) 96.2 2,634.6 -96.35% selling pressure. However, the Stochastic has moved above its Crude (bbl) 417.8 24,308.9 -98.28% average but still placed in the over sold zone, which would lead to Source – MCX short covering and selective buying support. The ADX and +DI line are moving sideways but – DI line is placed above the 30 level and indicating buyers have an upper hand. MCX Silver faces Turnover (In Lacs) resistance at 61708, 61884 and 64605 levels, while the supports 19/11/2011 18/11/2011 % Chg. are placed at 54754, 52725, 52365 and 51226 levels. Gold 42,690.0 1,370,559.4 -96.89% MCX CRUDE (DEC 11) - Crude opened higher at 5020 level. It Silver 53,662.6 1,445,810.0 -96.29% moved lower to touch an intra-day low of 5017. However, it managed to move higher to touch an intra-day high of 5030. It Crude 20,981.4 1,230,966.9 -98.30% ended the day with modest gains to close at 5024 Source – MCX The RSI and Stochastic are placed before their respective Global Market (Nymex - $) averages, which is a negative sign. Moreover, the RSI is placed in 21/11/2011 19/11/2011 % Chg. the over bought zone which would further lead to intermediate bouts of profit taking and selling pressure. The ADX and –DI line Gold (oz) 1,722.40 1,725.10 -0.16% are moving sideways, but +DI line is still placed at 37.84 indicating Silver (oz) 32.175 32.42 -0.75% buyers have an upper hand. It faces resistance at 5174 5200 and 5250 levels, while the supports are placed at 4889, 4618, 4493 and Crude (bbl) 97.71 97.67 0.04% 4291 levels. Dollar Index 78.00 78.02 -0.03% Source – www.cmegroup.com Intra-day Resistance Intra-day Support Commodities Close Pivot Point R1 R2 R3 S1 S2 S3 CRUDE DEC 11 5024 5024 5030 5037 5050 5017 5011 4998 GOLD DEC 11 28704 28683 28746 28788 28893 28641 28578 28473 SILVER DEC 11 55850 55775 56058 56265 56755 55568 55285 54795 Keynote Capitals Ltd. th 4 Floor, Balmer Lawrie Bldg., 5, J. N. Heredia Marg, Ballard Estate, Fort, Mumbai, India – 400001. Tel: 3026 6000 / 2269 4322 www.keynotecapitals.com
- 2. US Economic Calendar: Monday Tuesday Wednesday Friday Monday Nov. 21 Nov. 22 Nov. 23 Nov. 25 Nov. 28 Existing Home Sales GDP Data Jobless Claims Data Weekly Bill Settlement New Home Sales Chicago Fed National Corporate Profits Durable Goods Orders Money Supply Data 6-Month Bill Auction Activity Index Personal Income and 4-Week Bill 2-Yr Note Auction 5-Yr Note Auction Fed Balance Sheet Outlays Announcement Consumer Sentiment Keynote Capitals Ltd. th 4 Floor, Balmer Lawrie Bldg., 5, J. N. Heredia Marg, Ballard Estate, Fort, Mumbai, India – 400001. Tel: 3026 6000 / 2269 4322 www.keynotecapitals.com
- 3. Disclaimer This document is not for public distribution and has been furnished to you solely for your information and must not be reproduced or redistributed to any other person. Persons into whose possession this document may come are required to observe these restrictions. This material is for the personal information of the authorized recipient, and we are not soliciting any action based upon it. This report is not to be construed as an offer to sell or the solicitation of an offer to buy any security in any jurisdiction where such an offer or solicitation would be illegal. It is for the general information of clients of Keynote Capitals Ltd. It does not constitute a personal recommendation or take into account the particular investment objectives, financial situations, or needs of individual clients. We have reviewed the report, and in so far as it includes current or historical information, it is believed to be reliable though its accuracy or completeness cannot be guaranteed. Neither Keynote Capitals Ltd., nor any person connected with it, accepts any liability arising from the use of this document. The recipients of this material should rely on their own investigations and take their own professional advice. Price and value of the investments referred to in this material may go up or down. Past performance is not a guide for future performance. Certain transactions -including those involving futures, options and other derivatives as well as non-investment grade securities - involve substantial risk and are not suitable for all investors. Reports based on technical analysis centers on studying charts of a stock’s price movement and trading volume, as opposed to focusing on a company’s fundamentals and as such, may not match with a report on a company’s fundamentals. Opinions expressed are our current opinions as of the date appearing on this material only. While we endeavor to update on a reasonable basis the information discussed in this material, there may be regulatory, compliance, or other reasons that prevent us from doing so. Prospective investors and others are cautioned that any forward-looking statements are not predictions and may be subject to change without notice. Our proprietary trading and investment businesses may make investment decisions that are inconsistent with the recommendations expressed herein. We and our affiliates, officers, directors, and employees world wide may: (a) from time to time, have long or short positions in, and buy or sell the securities thereof, of company (ies) mentioned herein or (b) be engaged in any other transaction involving such securities and earn brokerage or other compensation or act as a market maker in the financial instruments of the company (ies) discussed herein or act as advisor or lender / borrower to such company (ies) or have other potential conflict of interest with respect to any recommendation and related information and opinions. The analyst for this report certifies that all of the views expressed in this report accurately reflect his or her personal views about the subject company or companies and its or their securities, and no part of his or her compensation was, is or will be, directly or indirectly related to specific recommendations or views expressed in this report. No part of this material may be duplicated in any form and/or redistributed without Keynote Capitals Ltd’s., prior written consent. Keynote Capitals Ltd. th 4 Floor, Balmer Lawrie Bldg., 5, J. N. Heredia Marg, Ballard Estate, Fort, Mumbai, India – 400001. Tel: 3026 6000 / 2269 4322 www.keynotecapitals.com