Download as PDF, PPTX


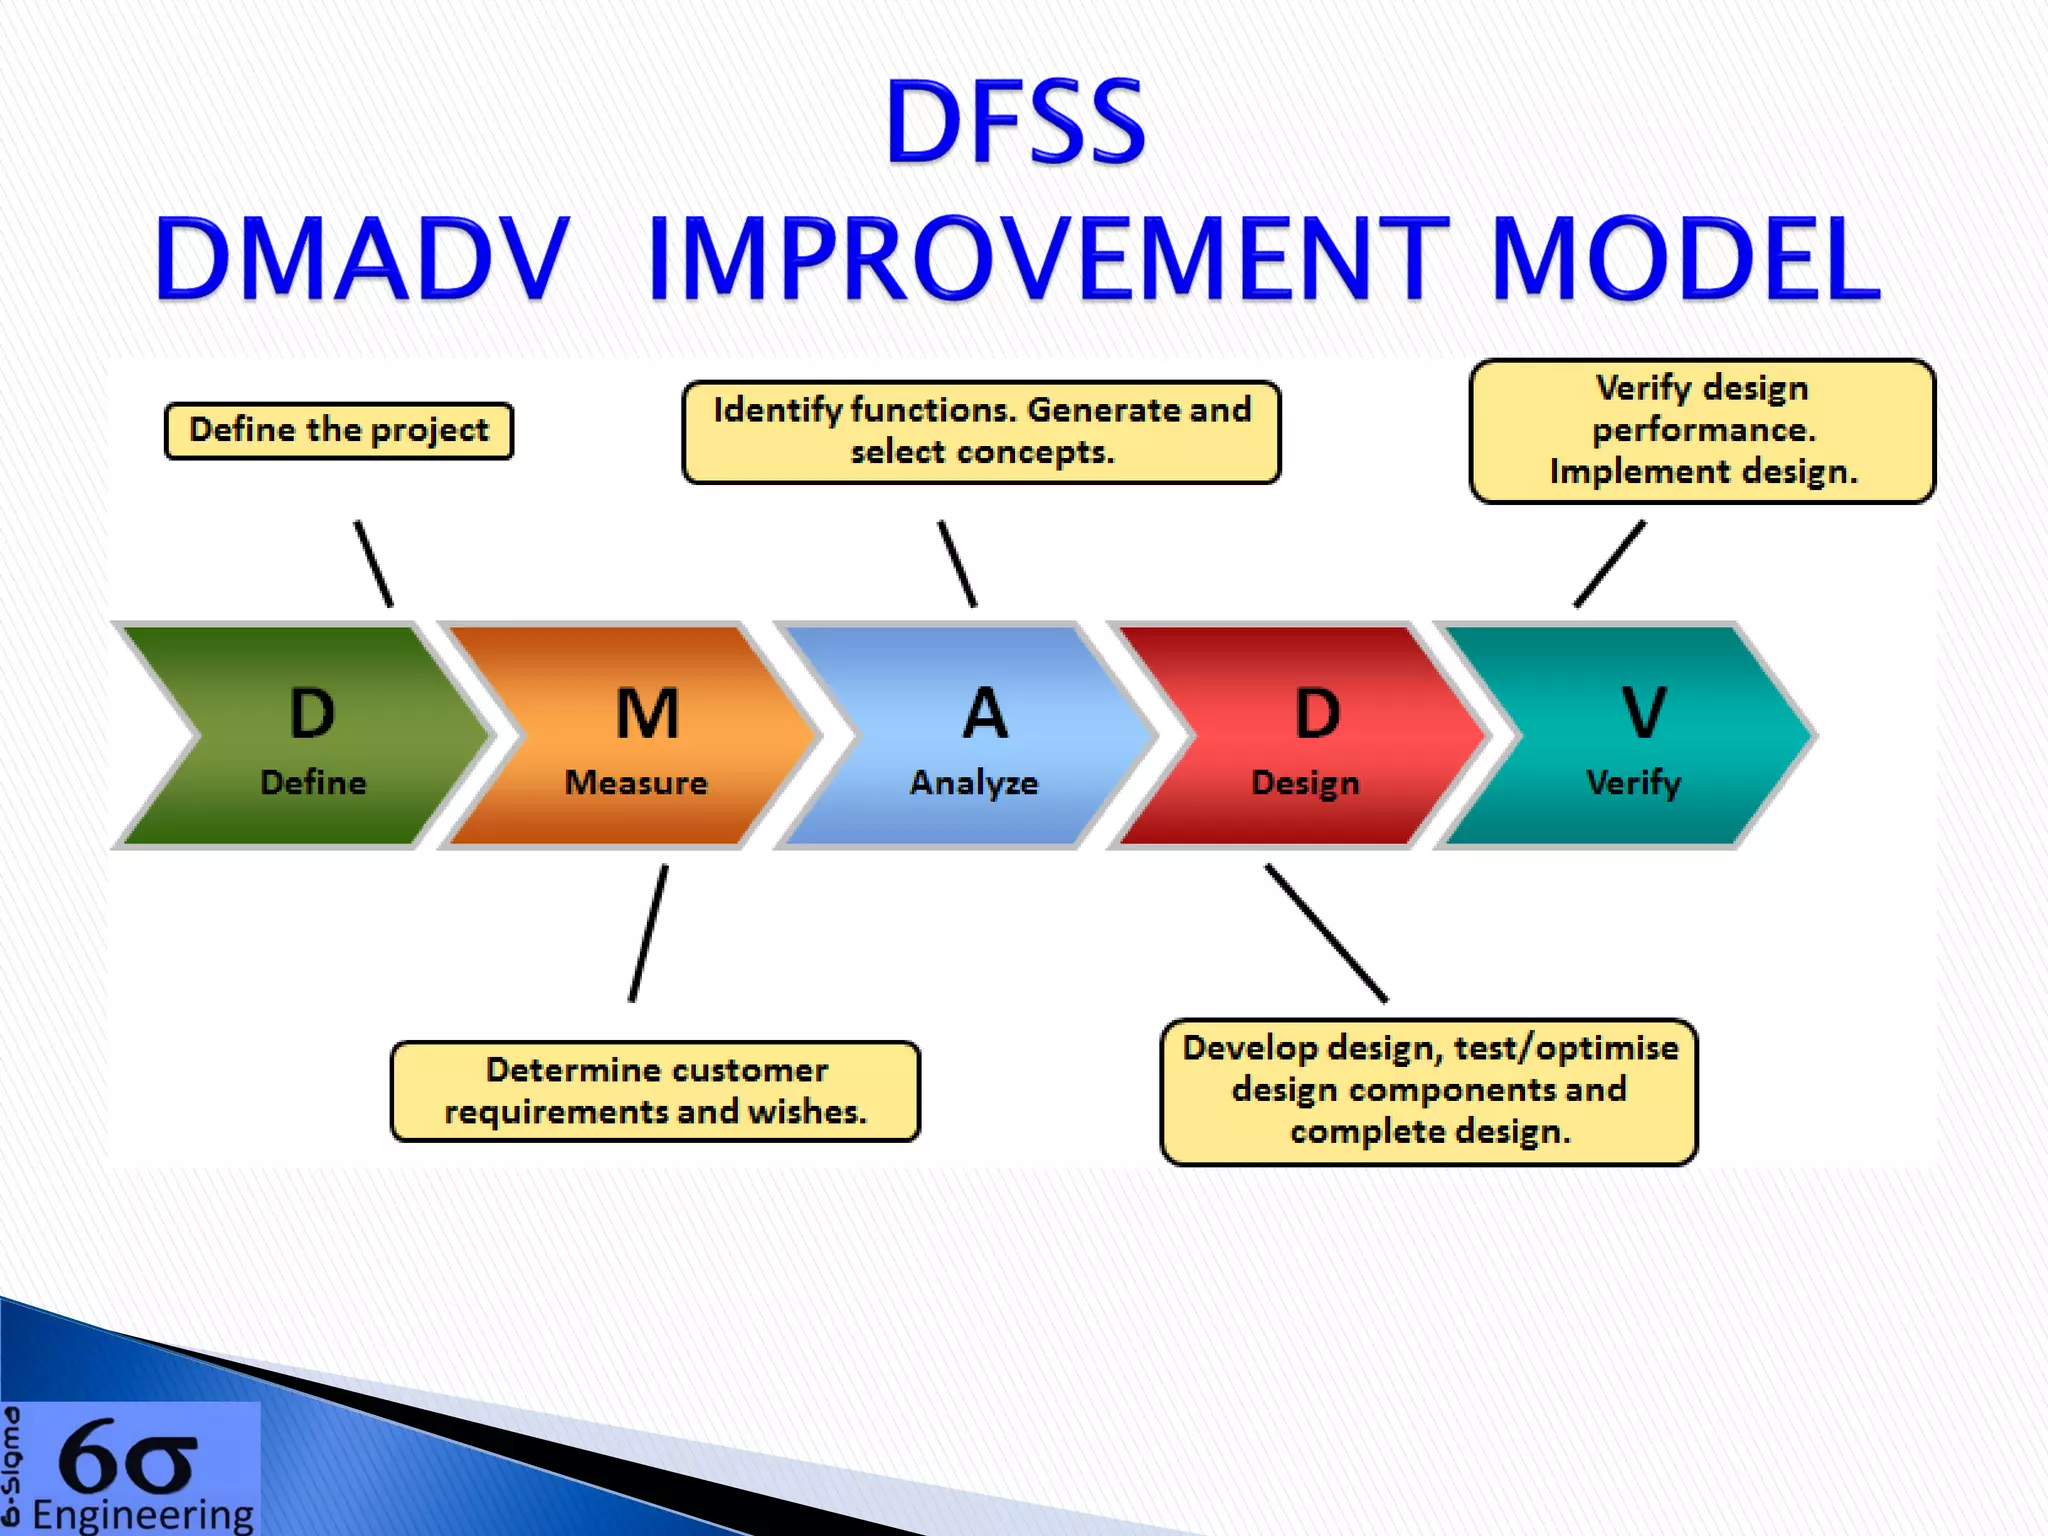


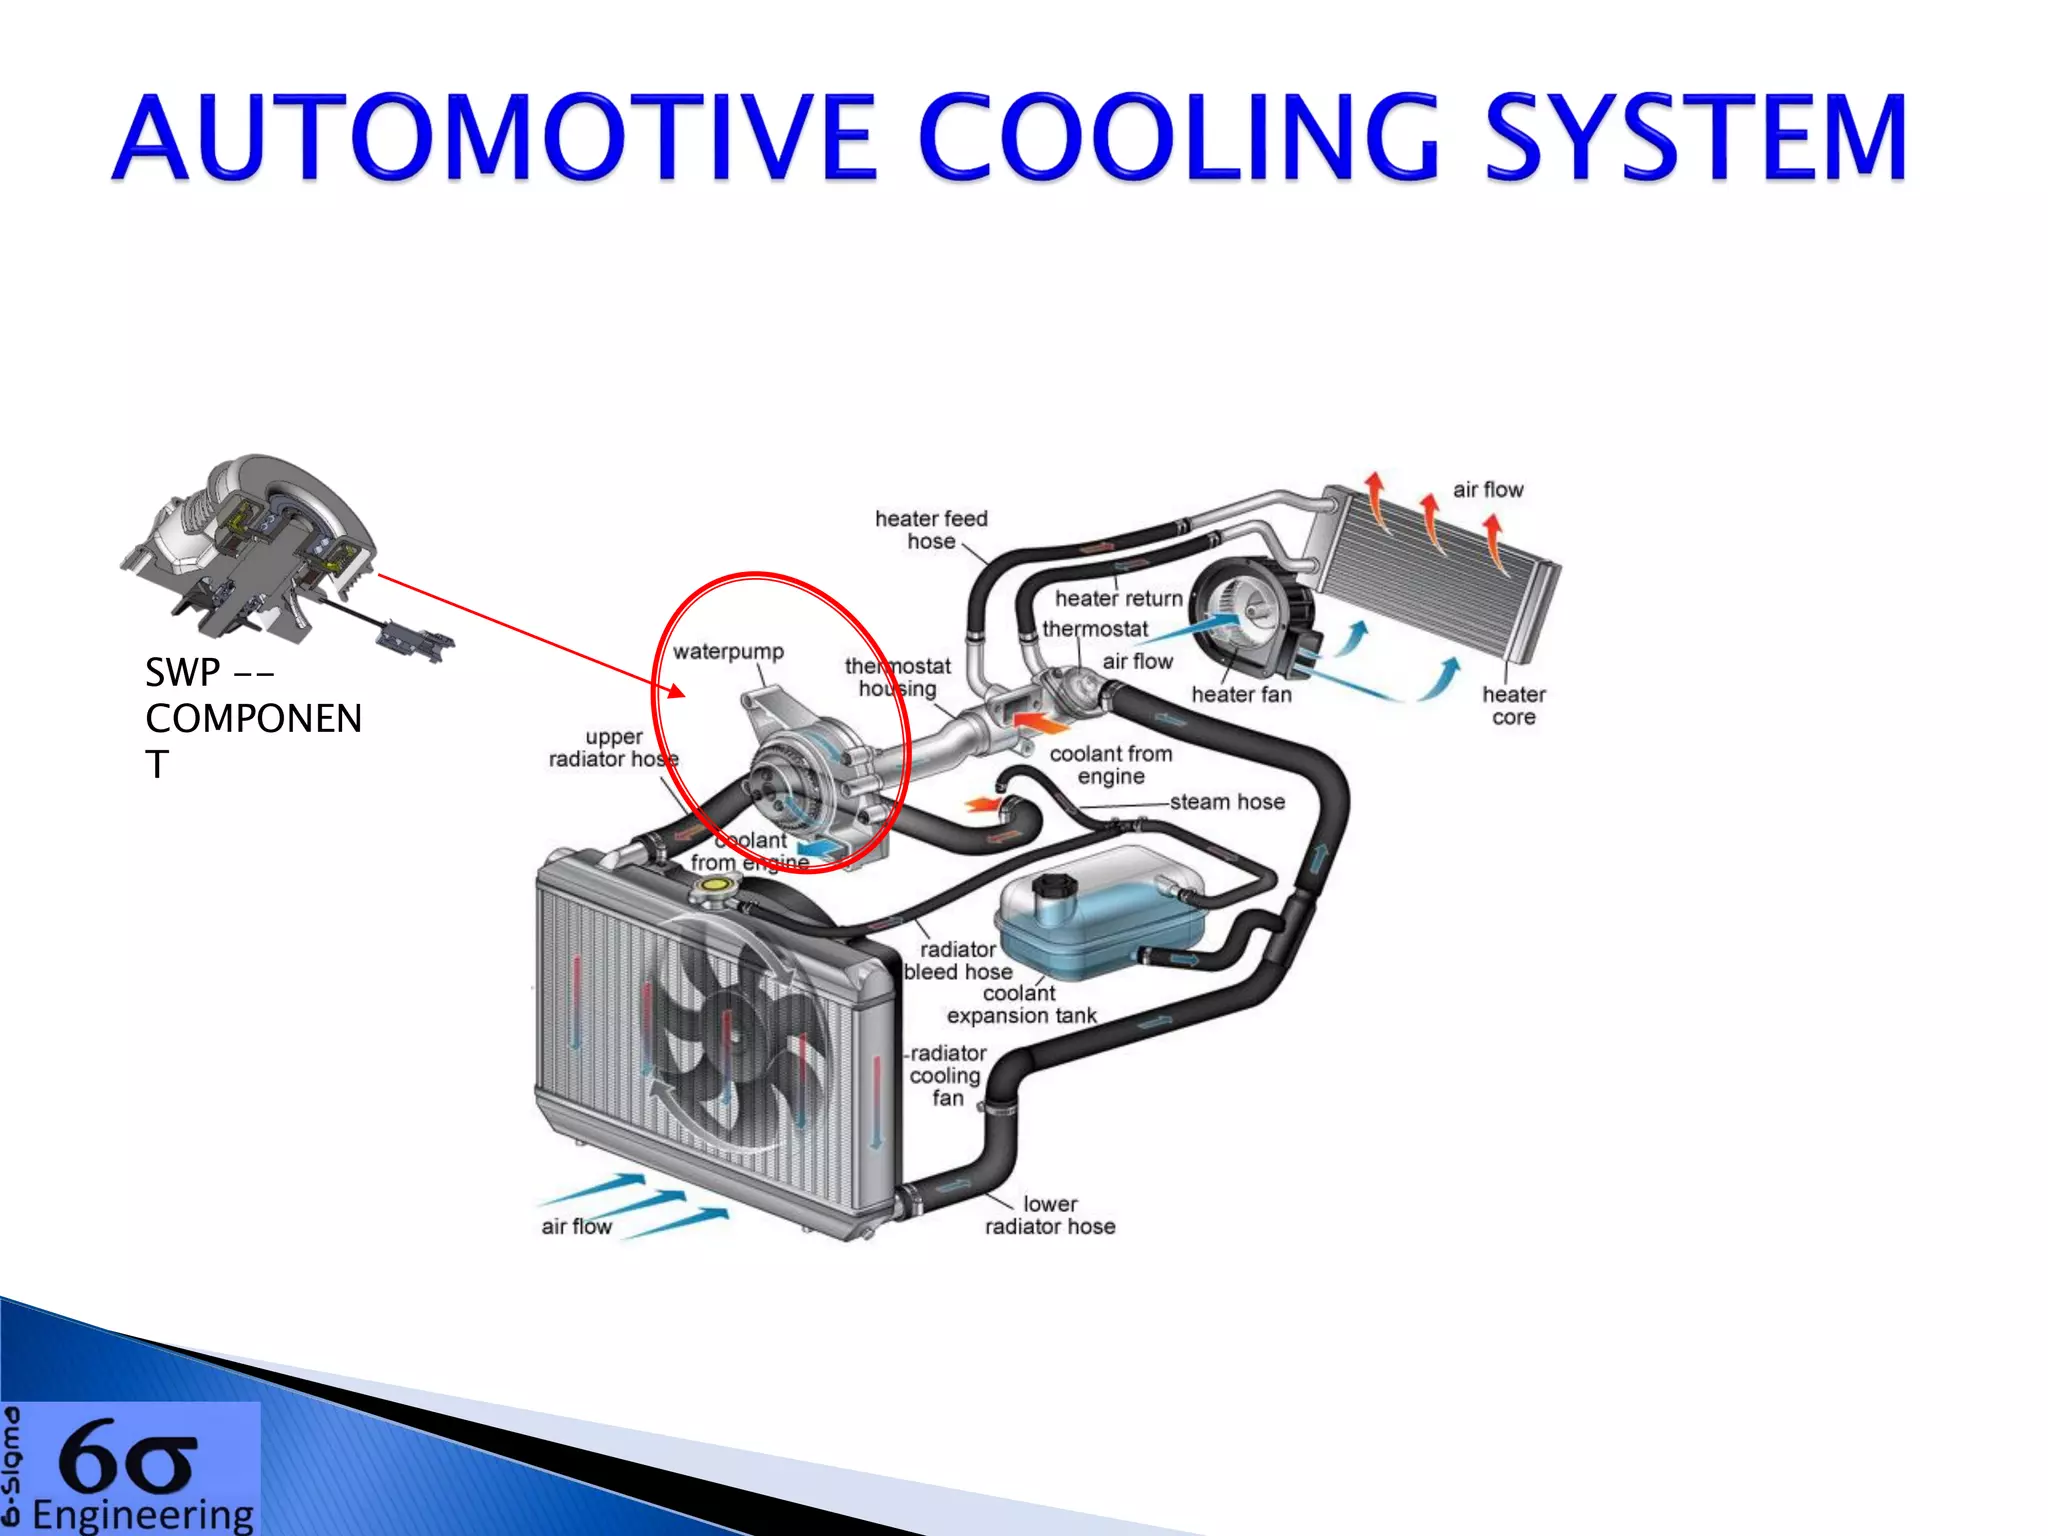


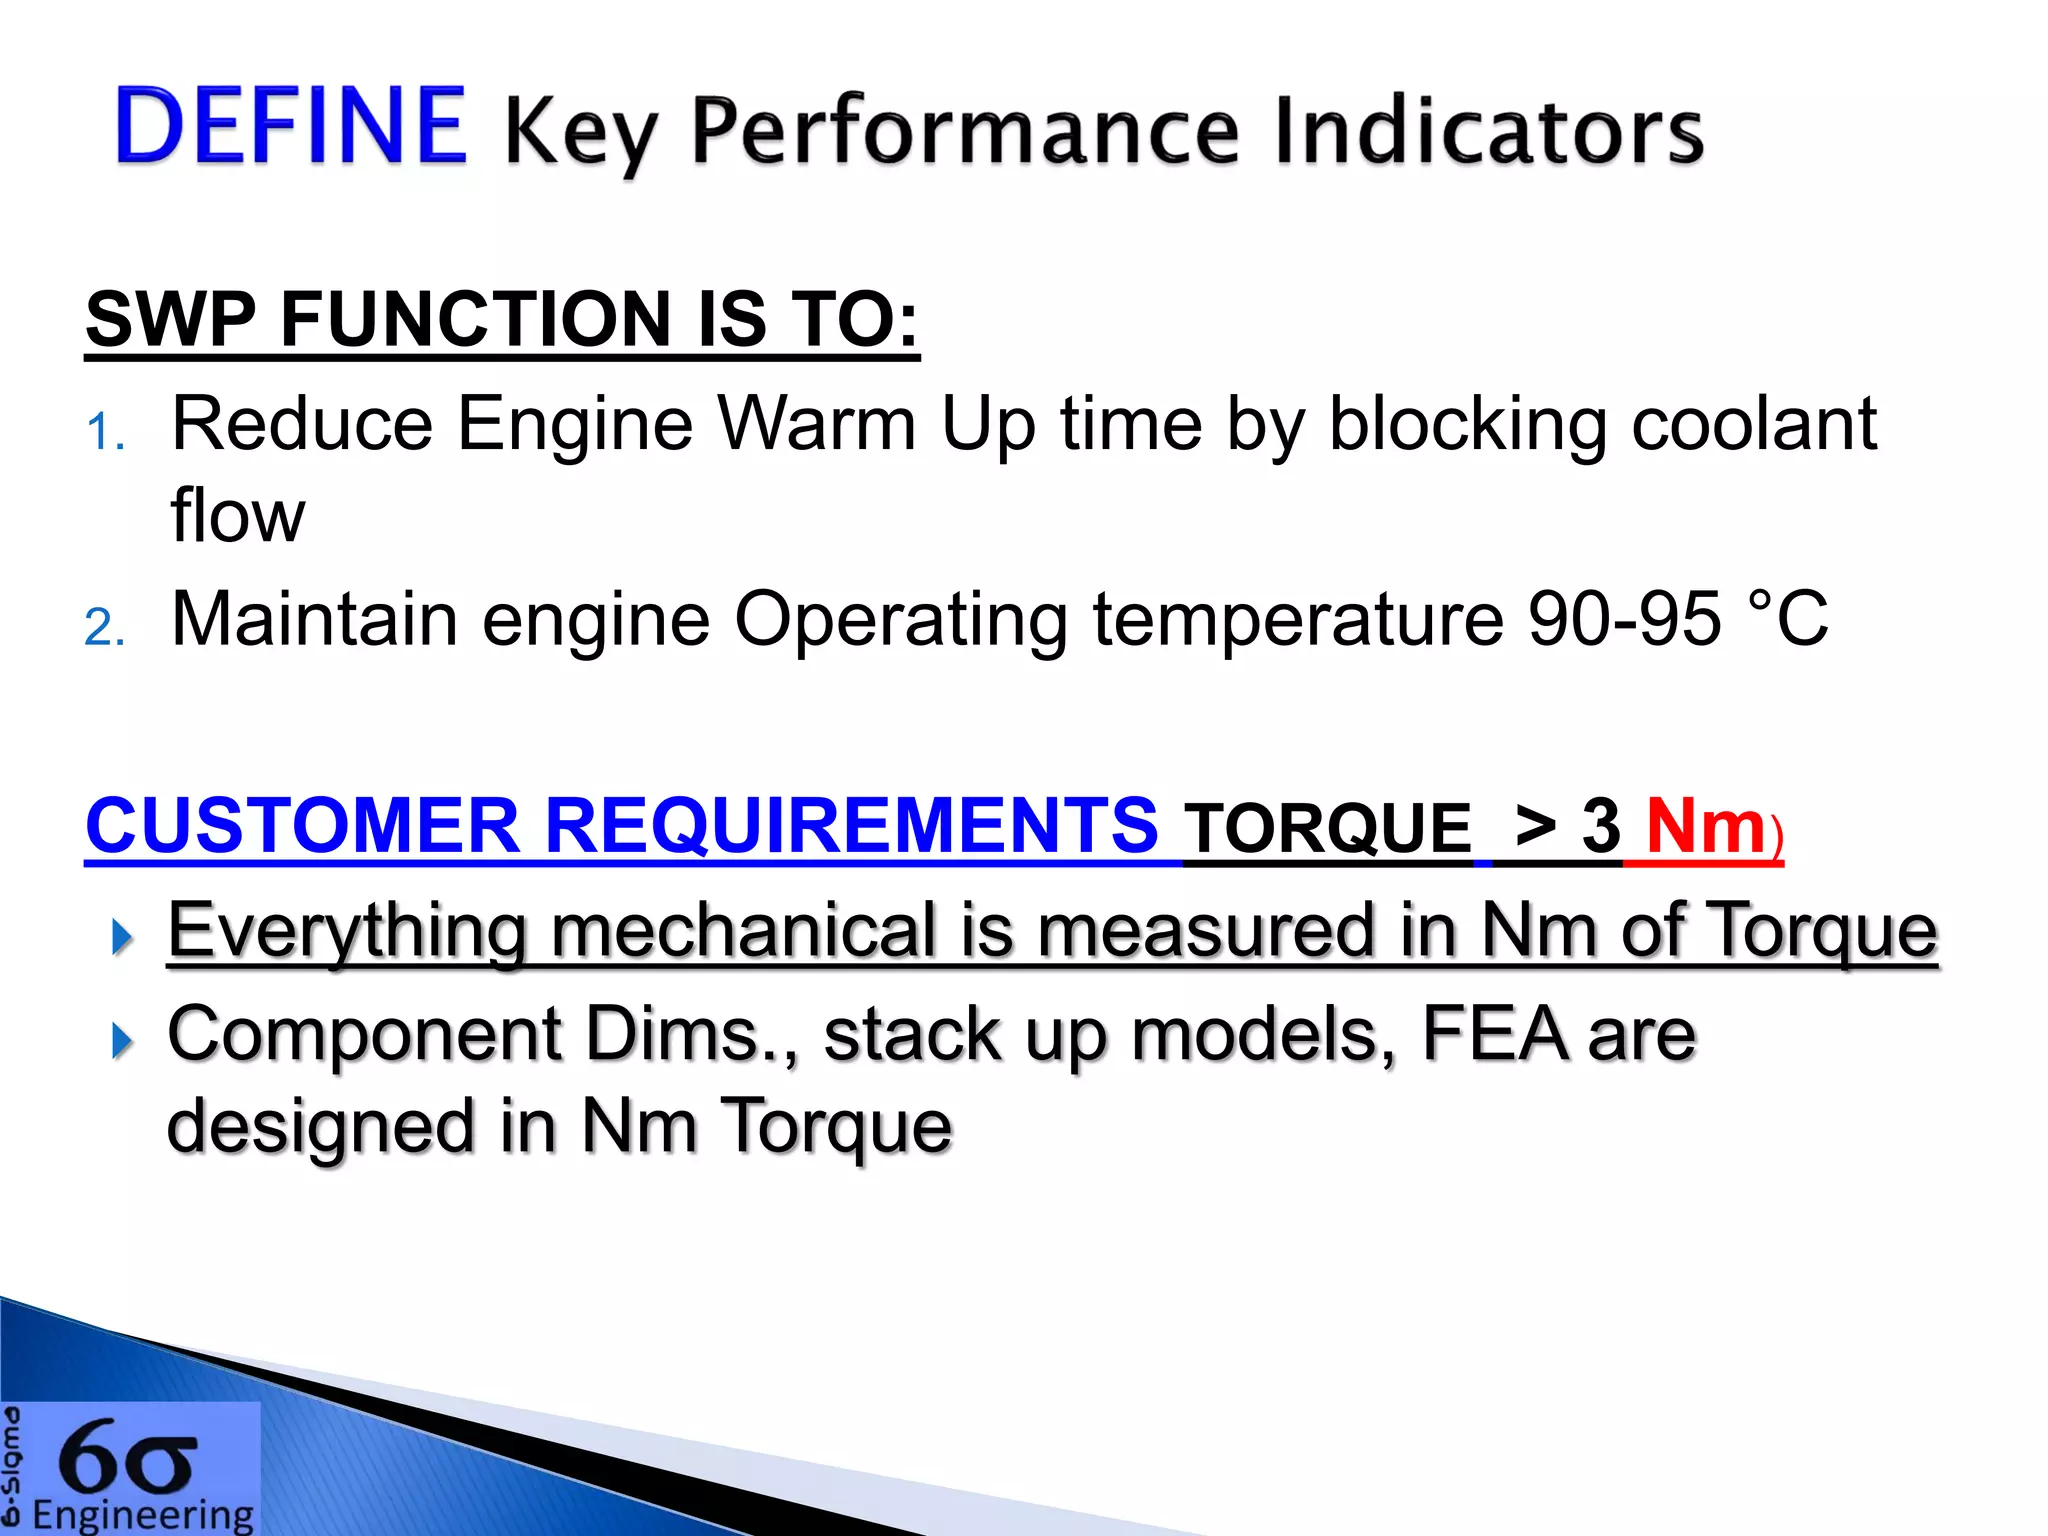
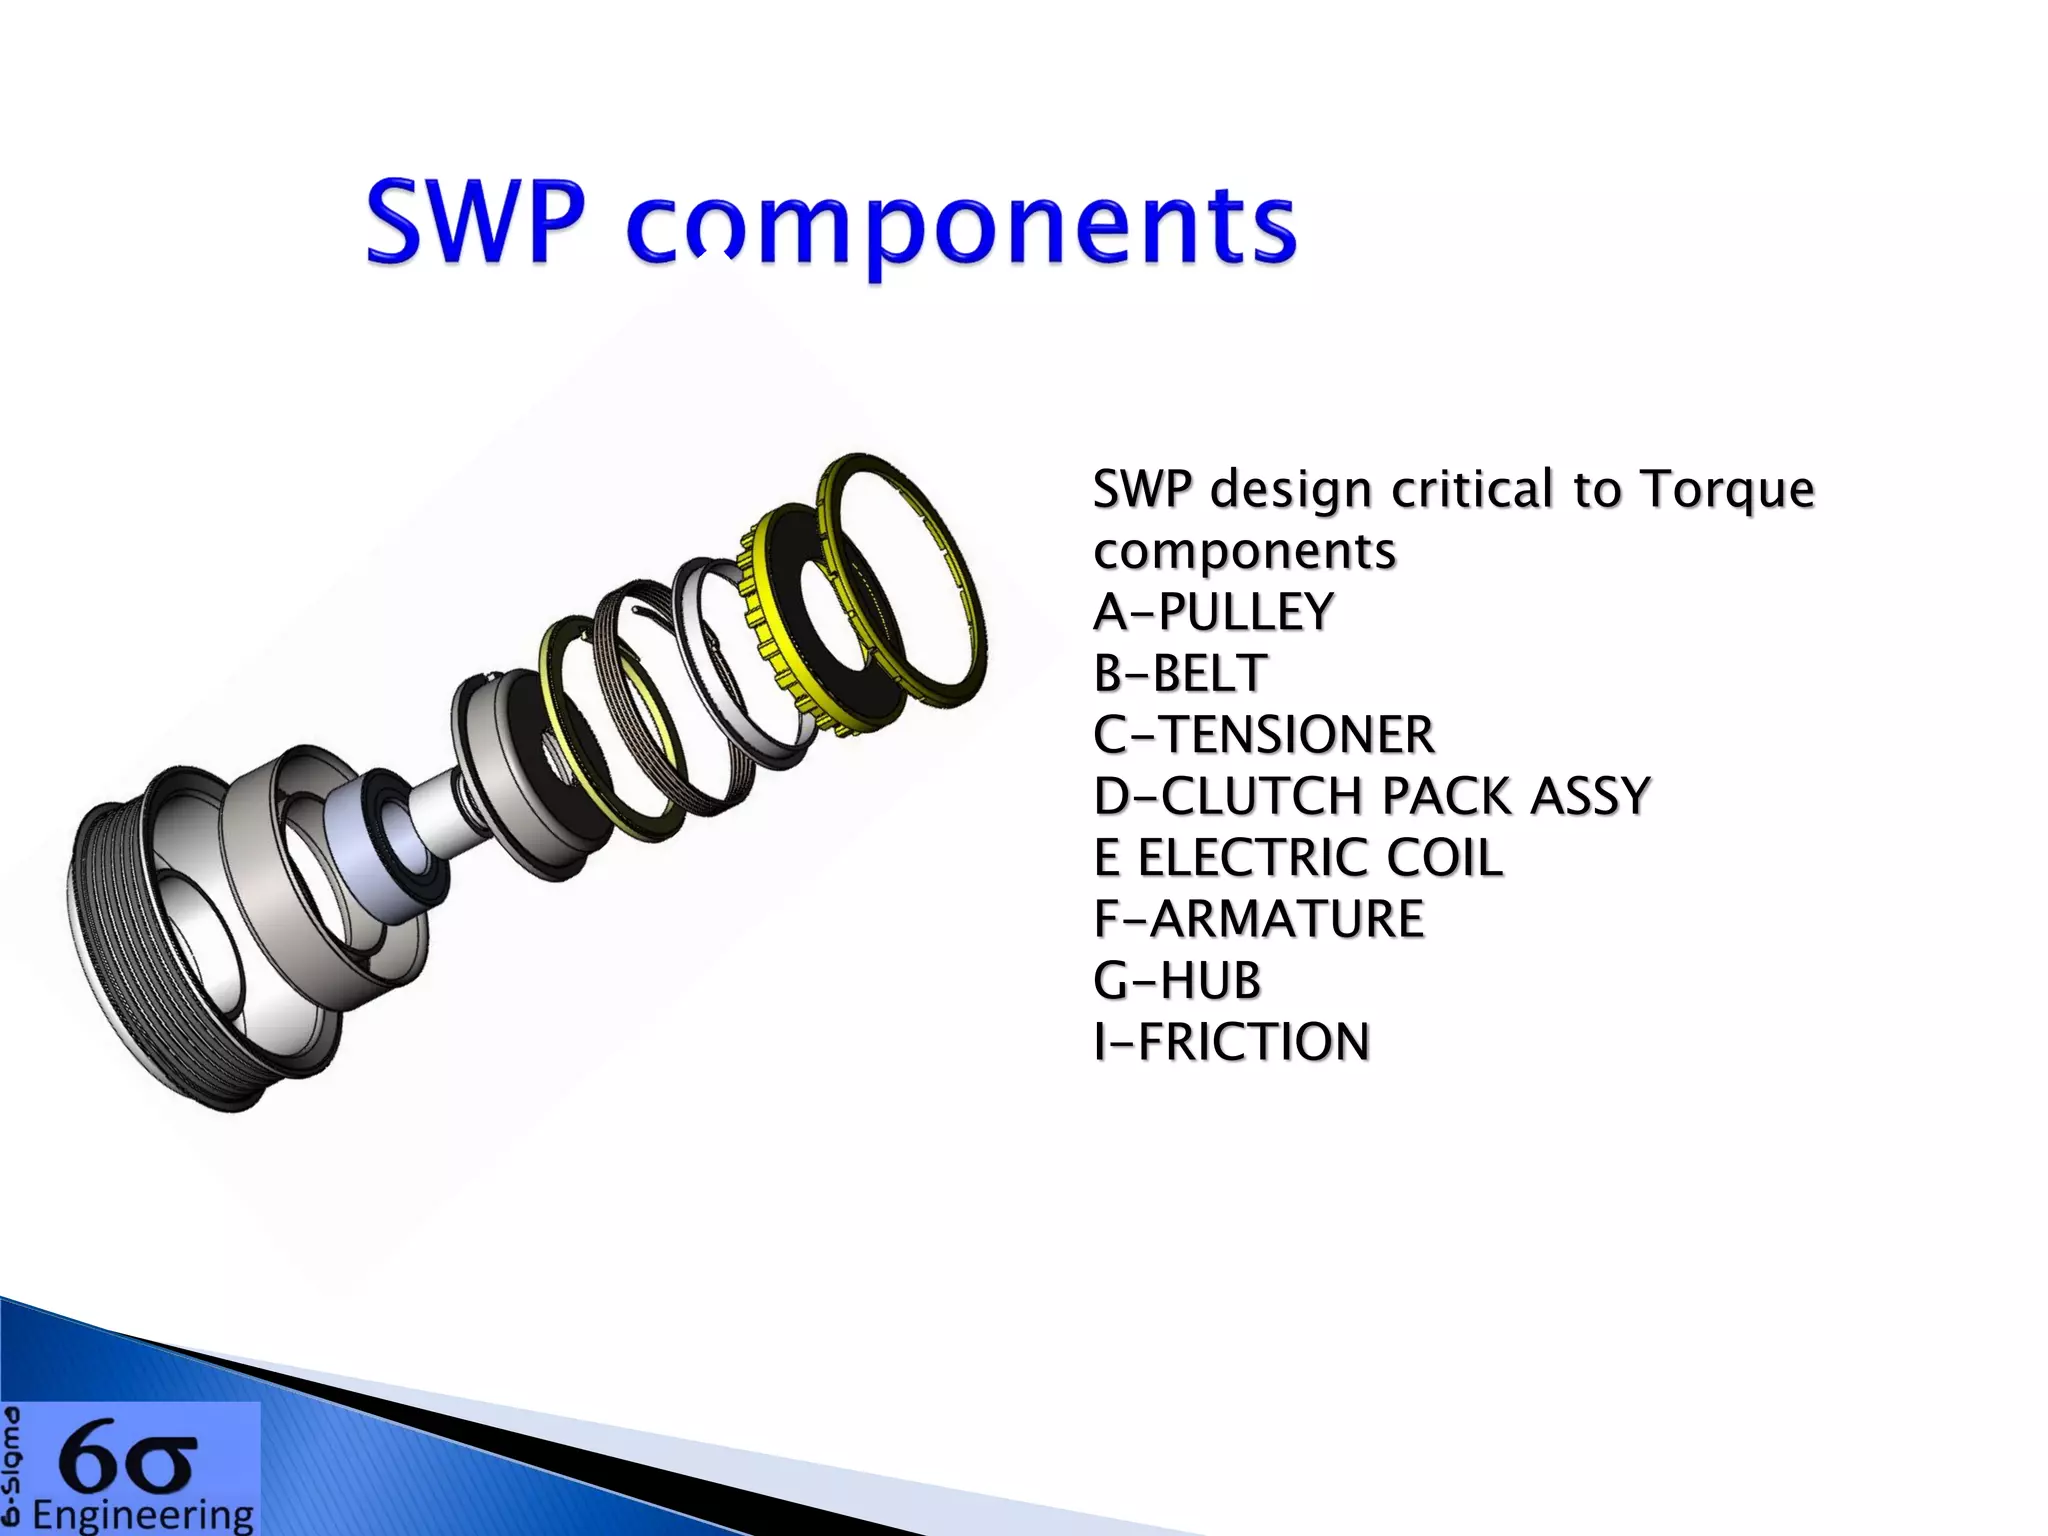

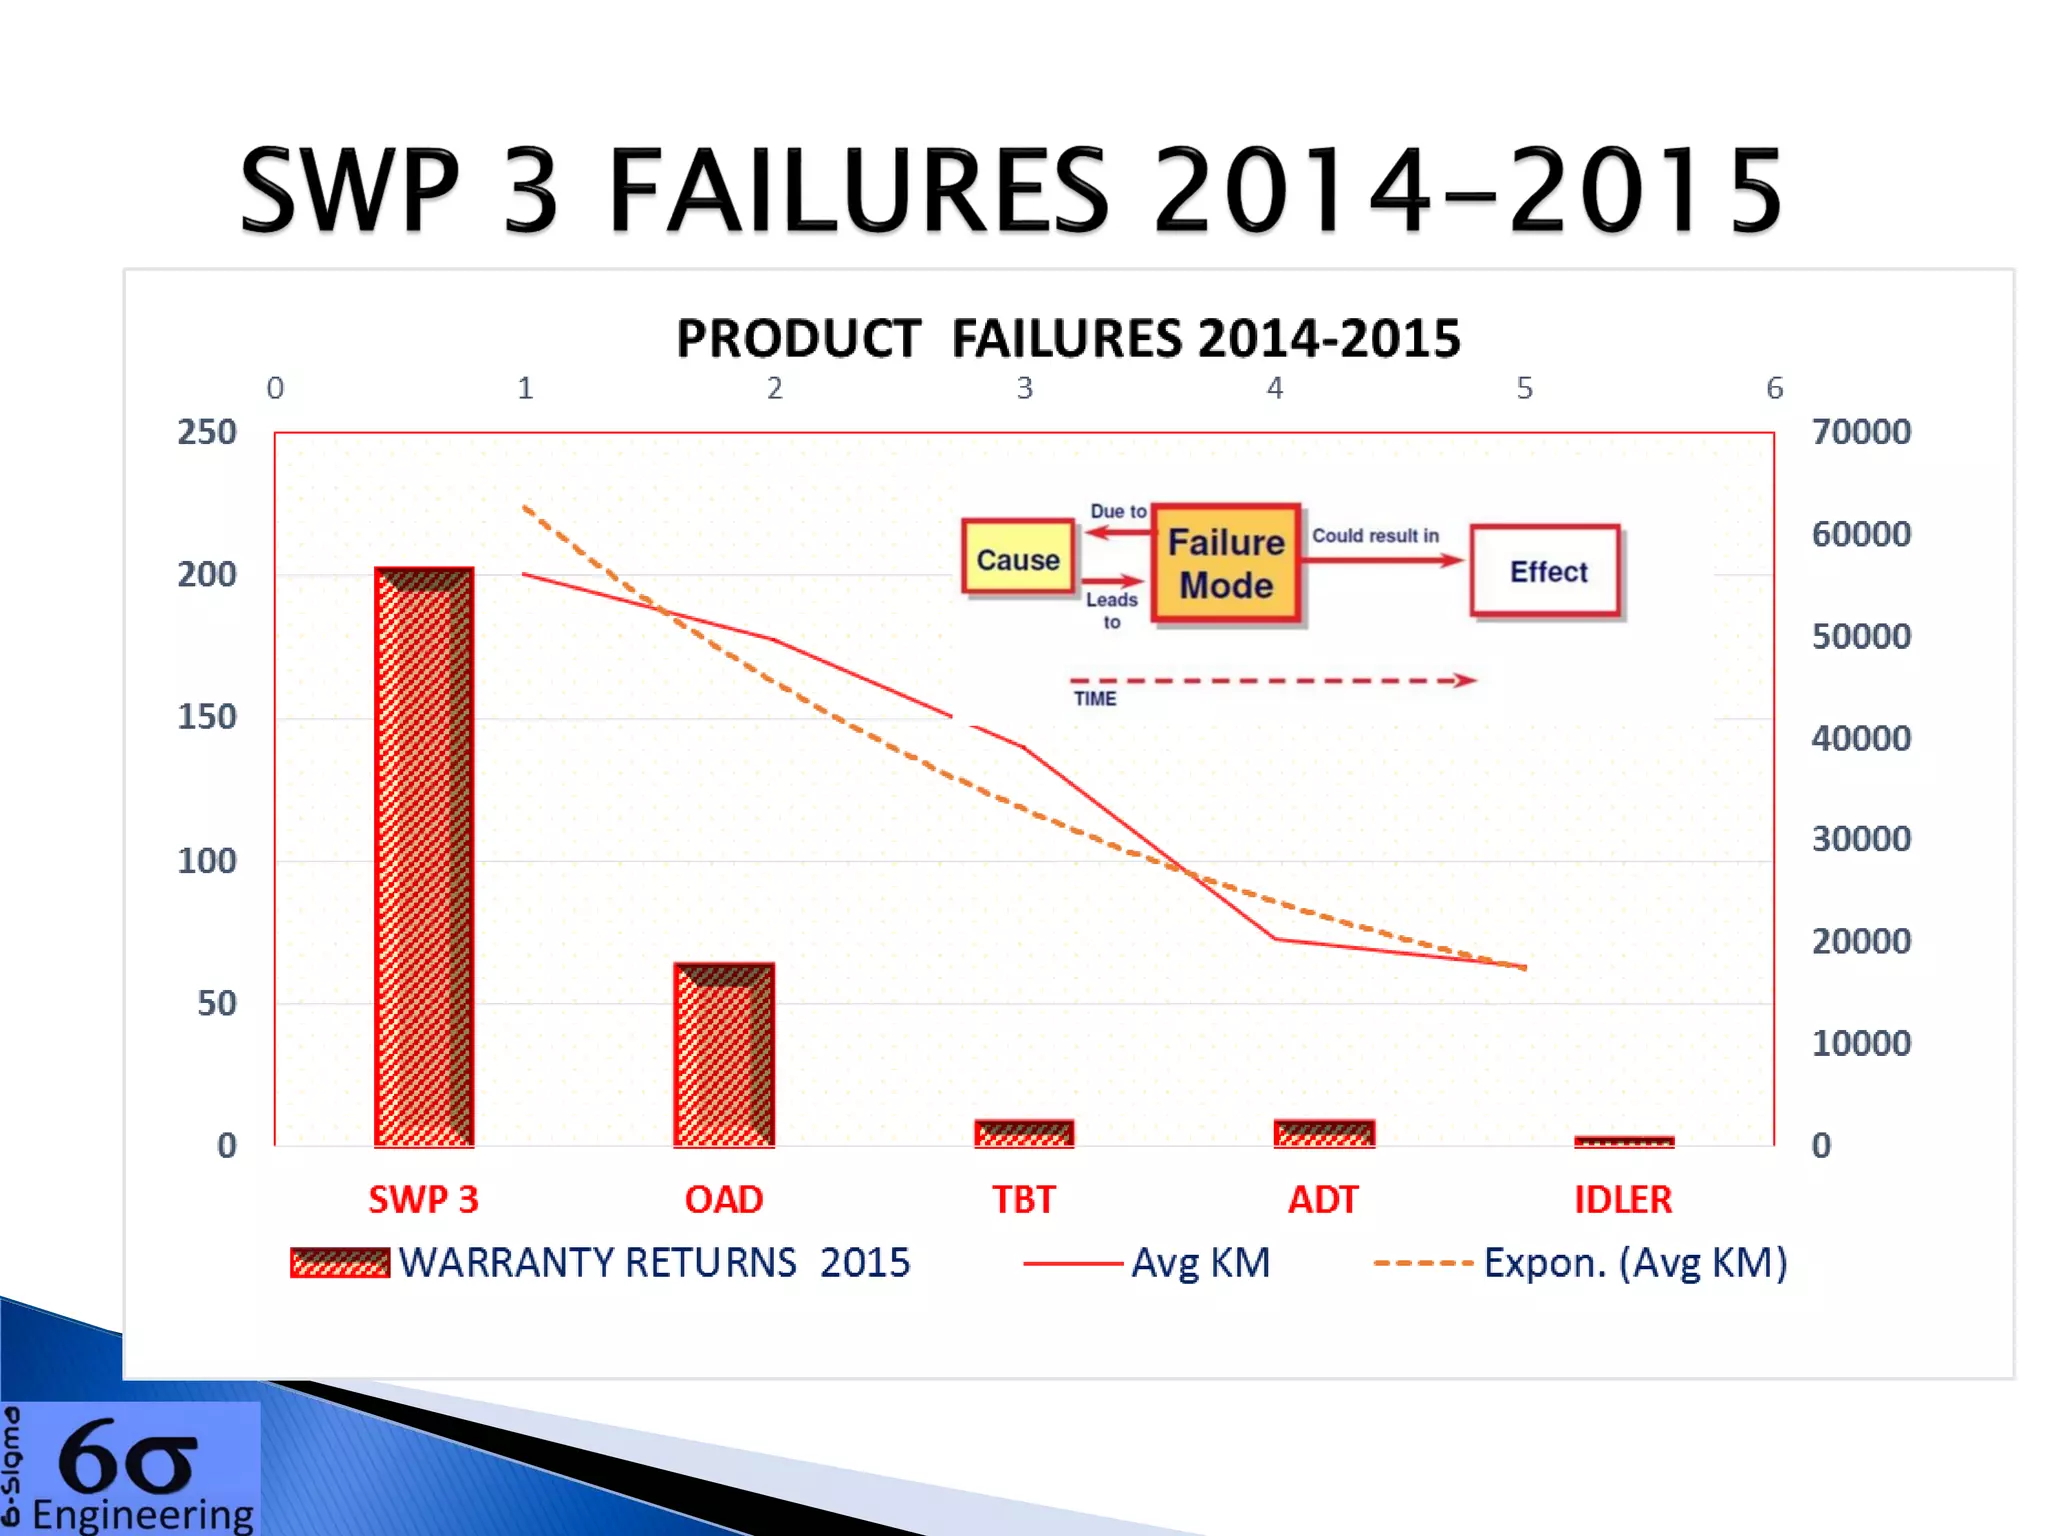
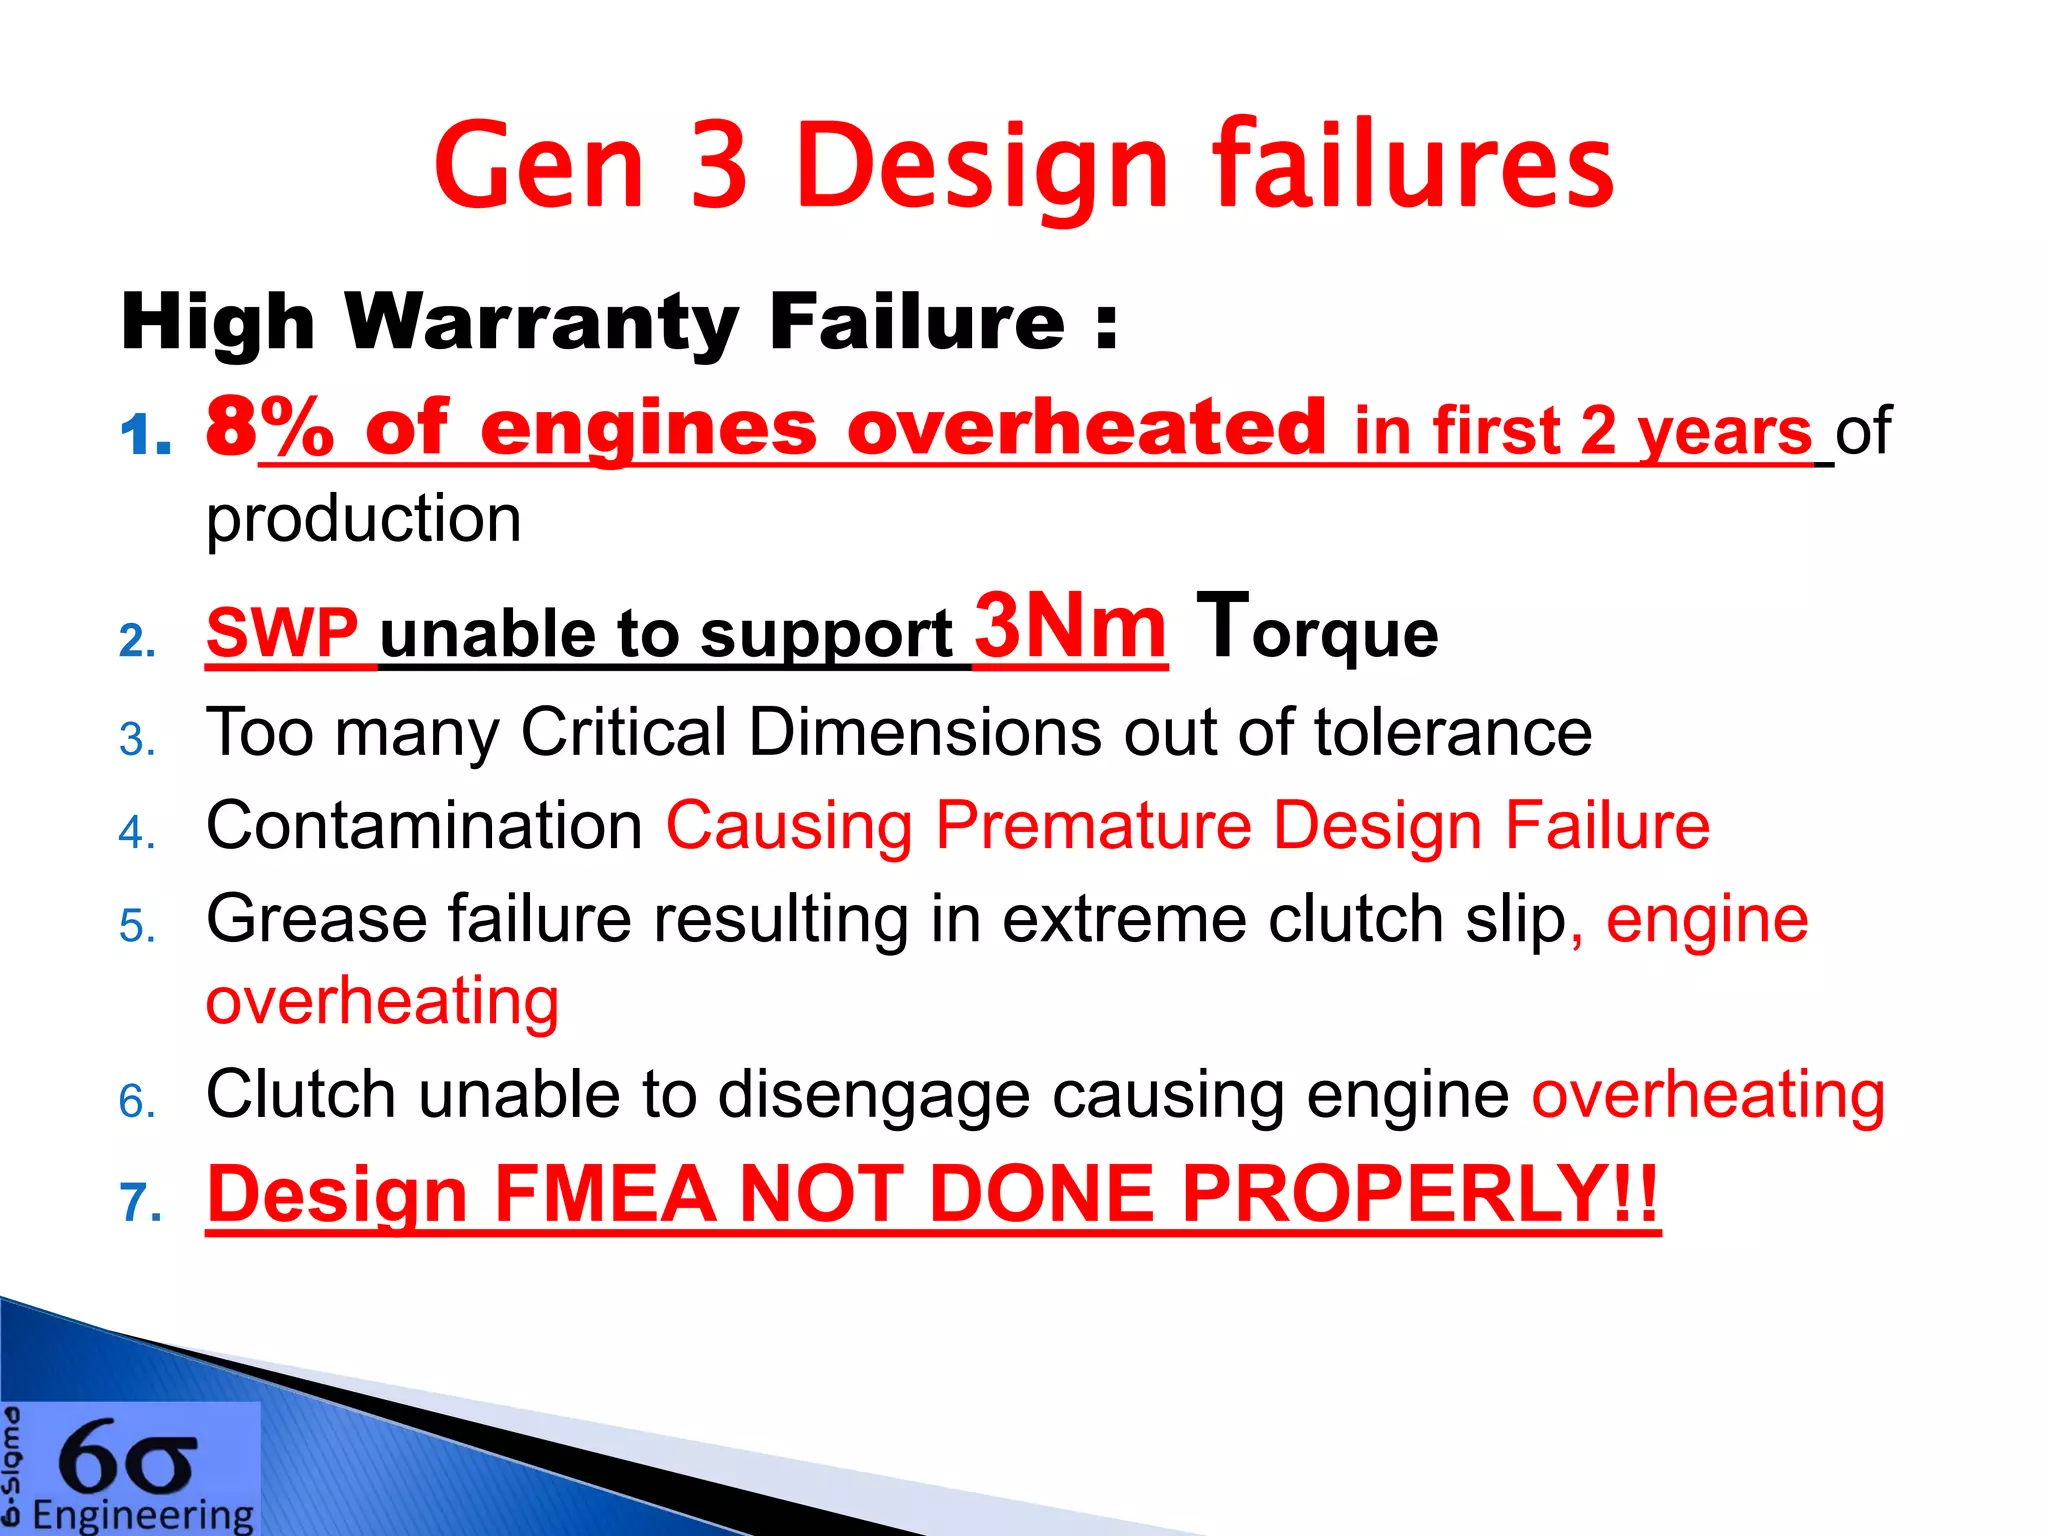
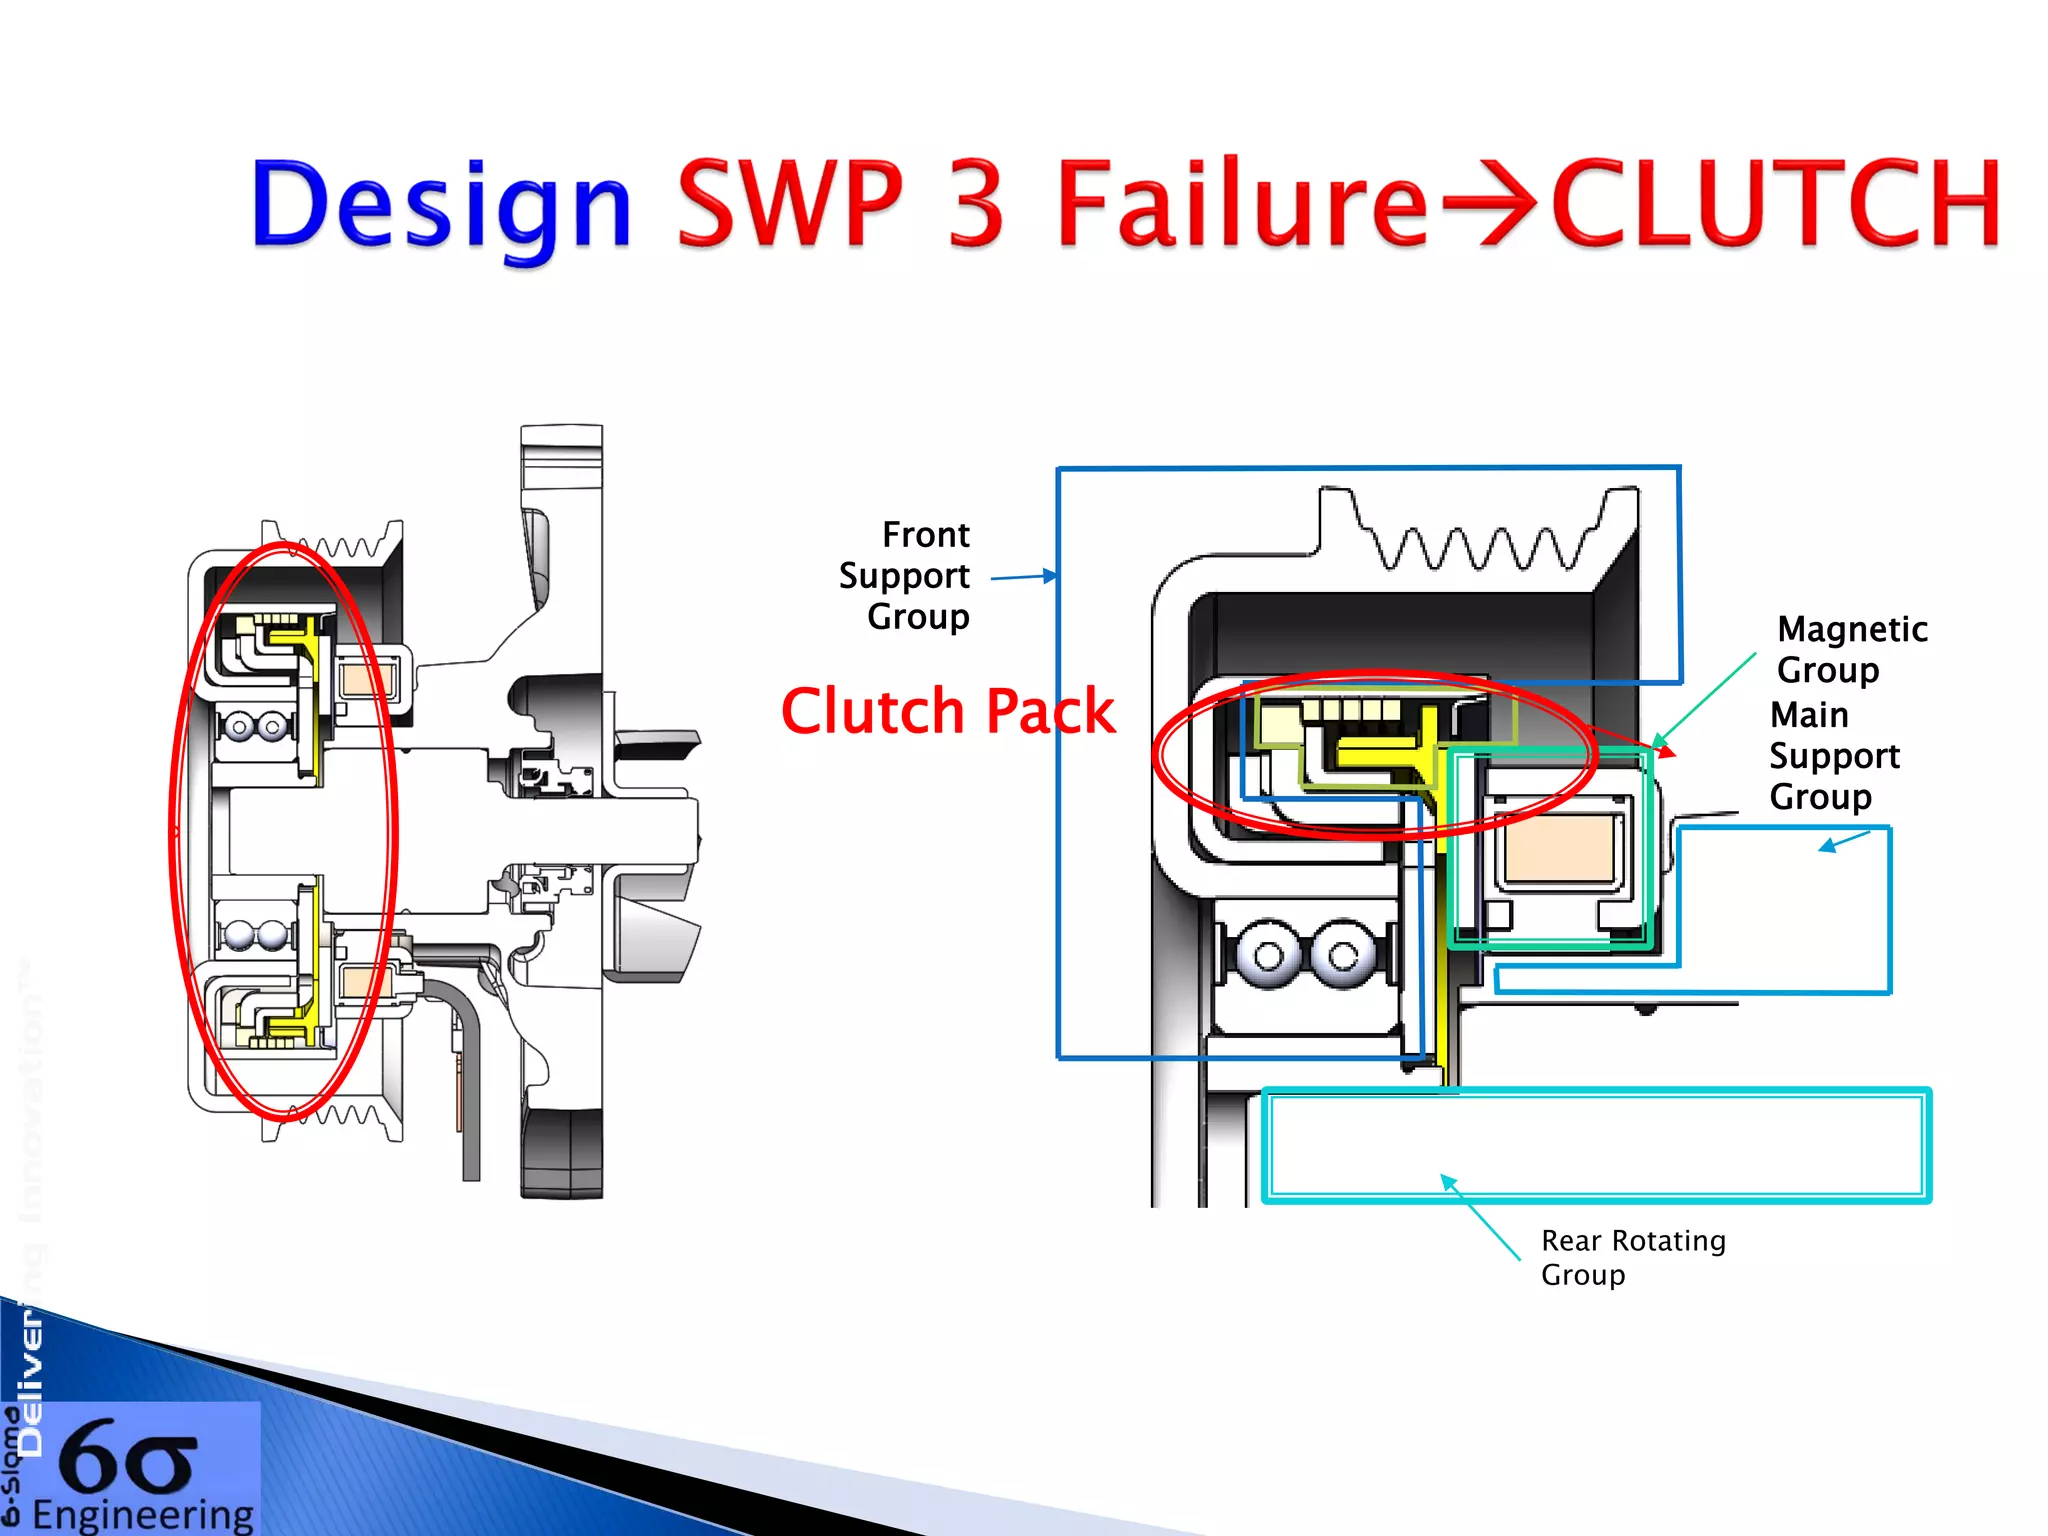
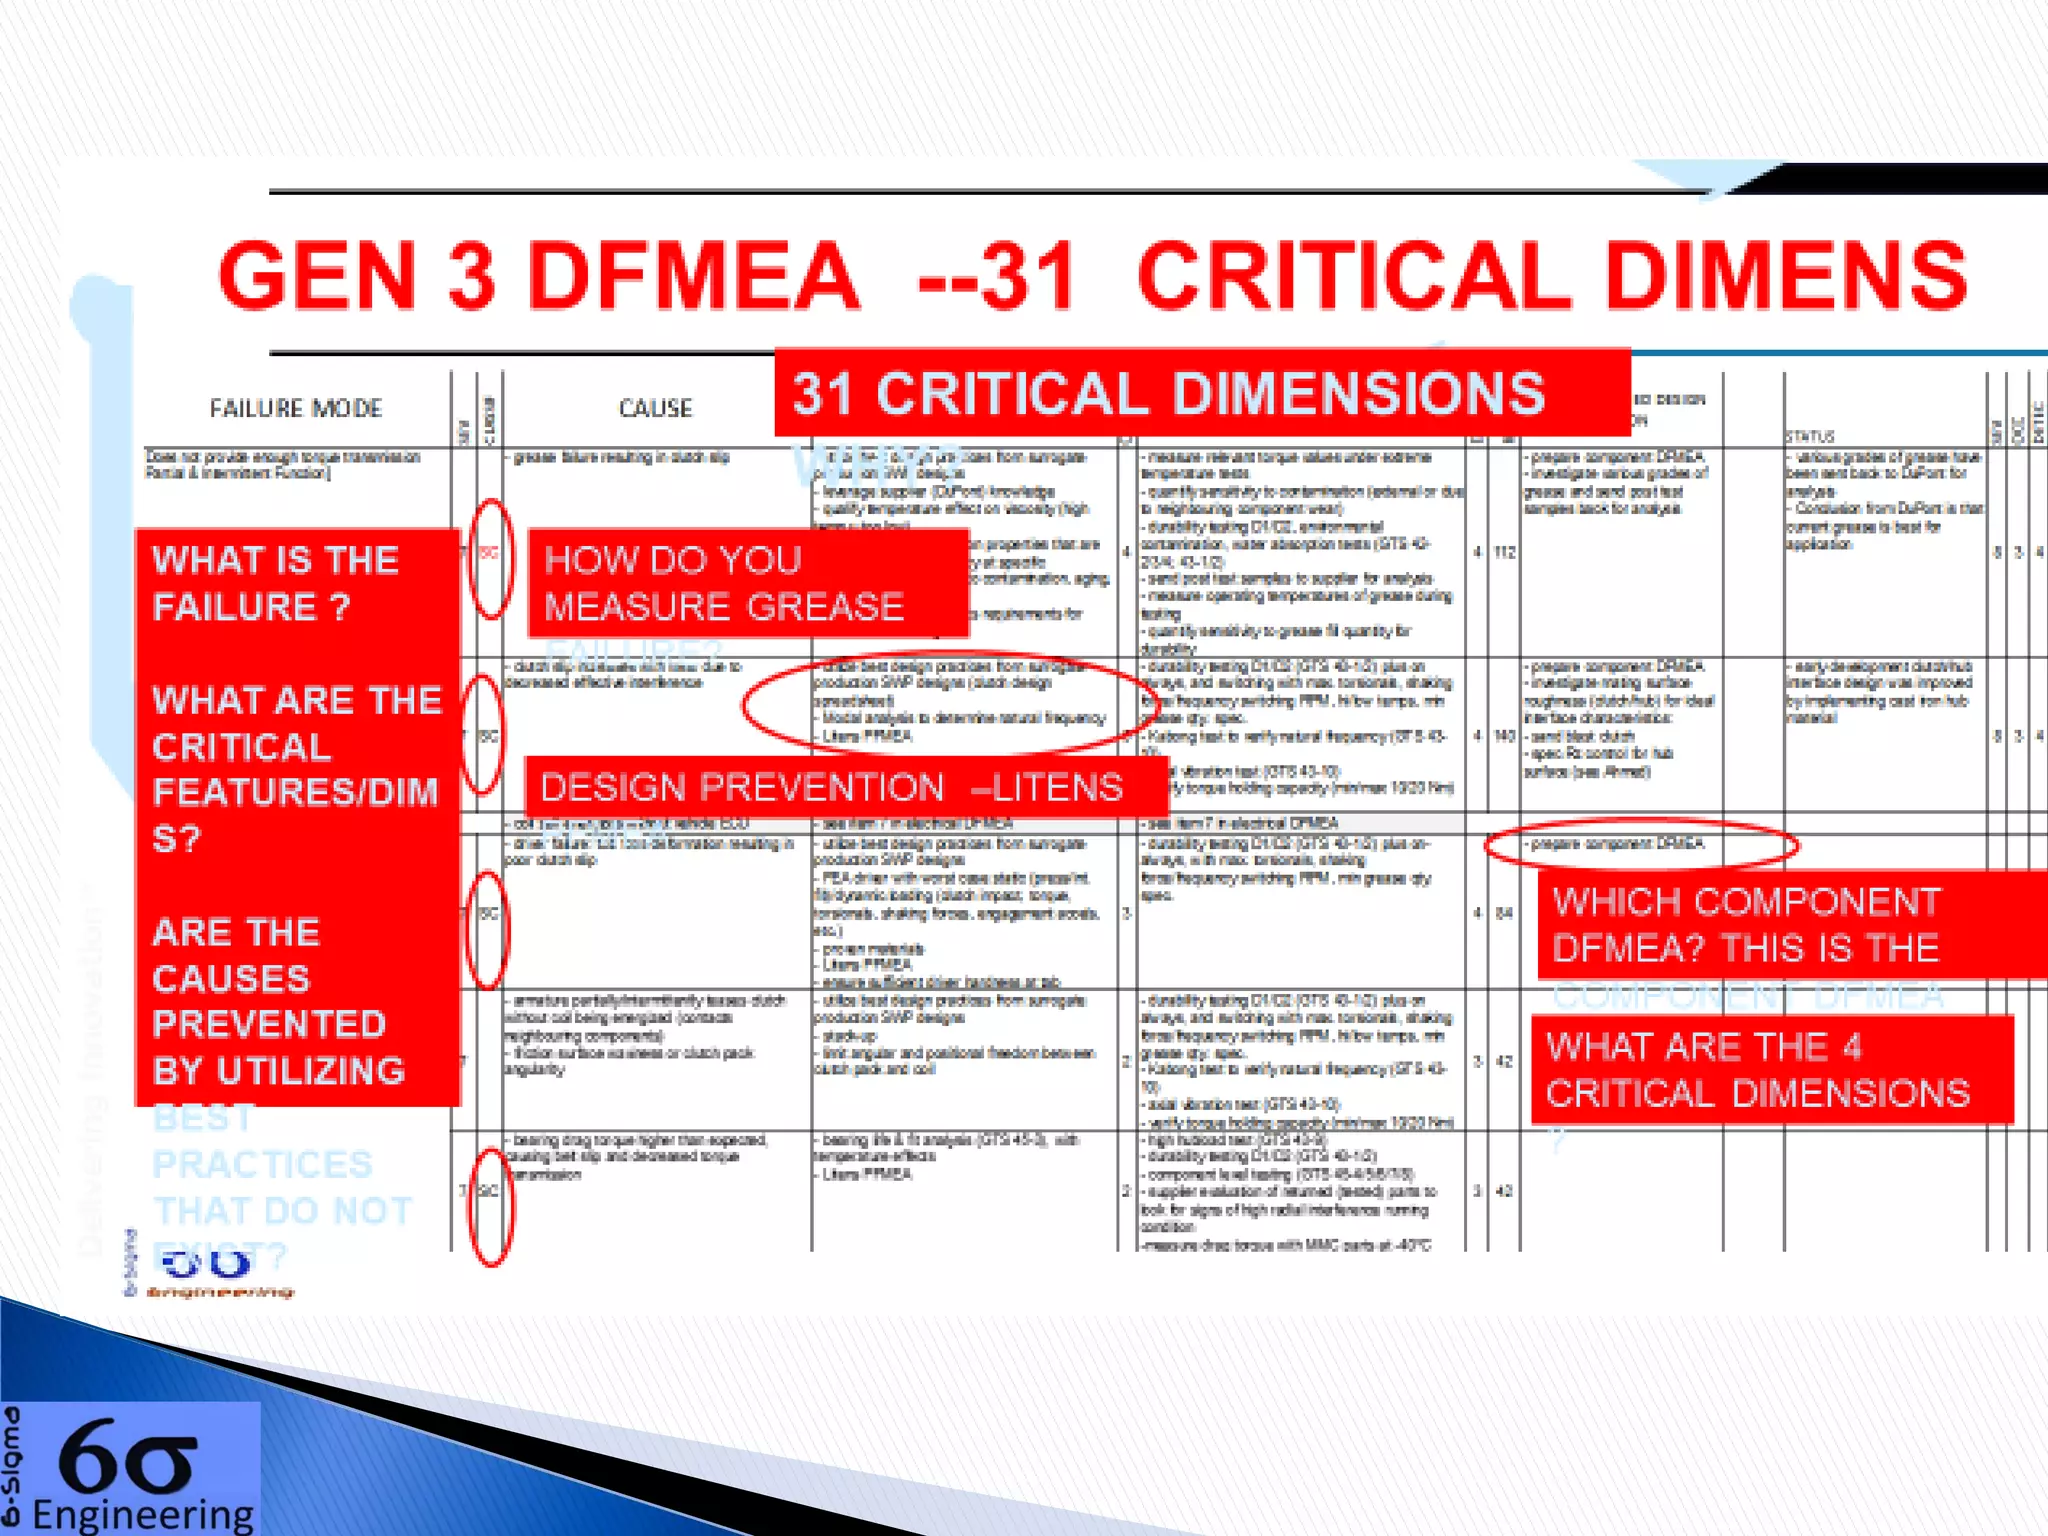


This document discusses the Six Sigma methodology, particularly focusing on Design for Six Sigma (DFSS) which aims to improve product design reliability by reducing process variation and ensuring quality in the manufacturing process. It highlights the importance of implementing robust control plans, performing failure mode and effects analysis (FMEA), and ensuring quality controls to prevent product failures, as illustrated through issues encountered with a switchable water pump in Volvo vehicles. The document also provides insights into various components, risks, and testing requirements necessary for achieving high reliability and performance in automotive designs.


