Download to read offline

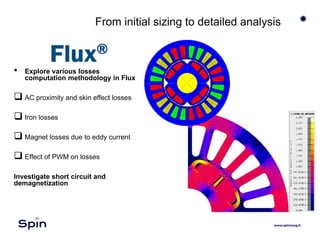
![Impact of PWM on losses
S1 without PWM
[rpm] ElMag torque [N∙m]
ElMag power
[kW]
Rotor iron losses
[W]
Stator teeth iron losses
[W]
Stator yoke iron losses
[W]
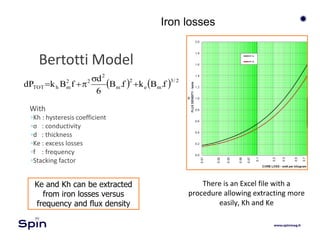
Iron losses
[W]
17000 59.37 105.70 546.42 3772.24 781.63 5100.29
S1 with PWM (switching frequency 10 kHz)
[rpm] ElMag torque [N∙m]
ElMag power
[kW]
Rotor iron losses
[W]
Stator teeth iron losses
[W]
Stator yoke iron losses
[W]
Iron losses
[W]
17000 59.58 106.07 495.82 3692.43 969.85 5158.09
S1 with PWM (switching frequency 20 kHz)
[rpm] ElMag torque [N∙m]
ElMag power
[kW]
Rotor iron losses
[W]
Stator teeth iron losses
[W]
Stator yoke iron losses
[W]
Iron losses
[W]
17000 59.34 105.63 806.06 4262.78 1015.00 6083.84](https://image.slidesharecdn.com/spinseminarioaquila-180523074427/85/Spin-Seminario-L-Aquila-18-320.jpg)
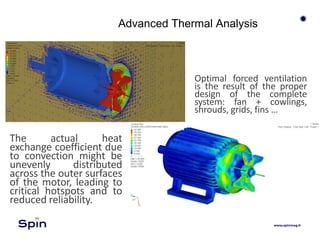
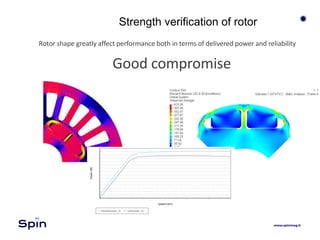
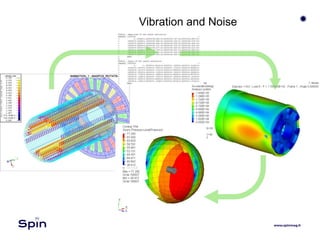
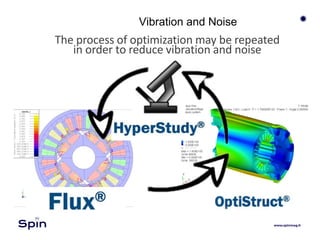
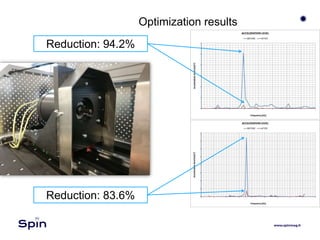


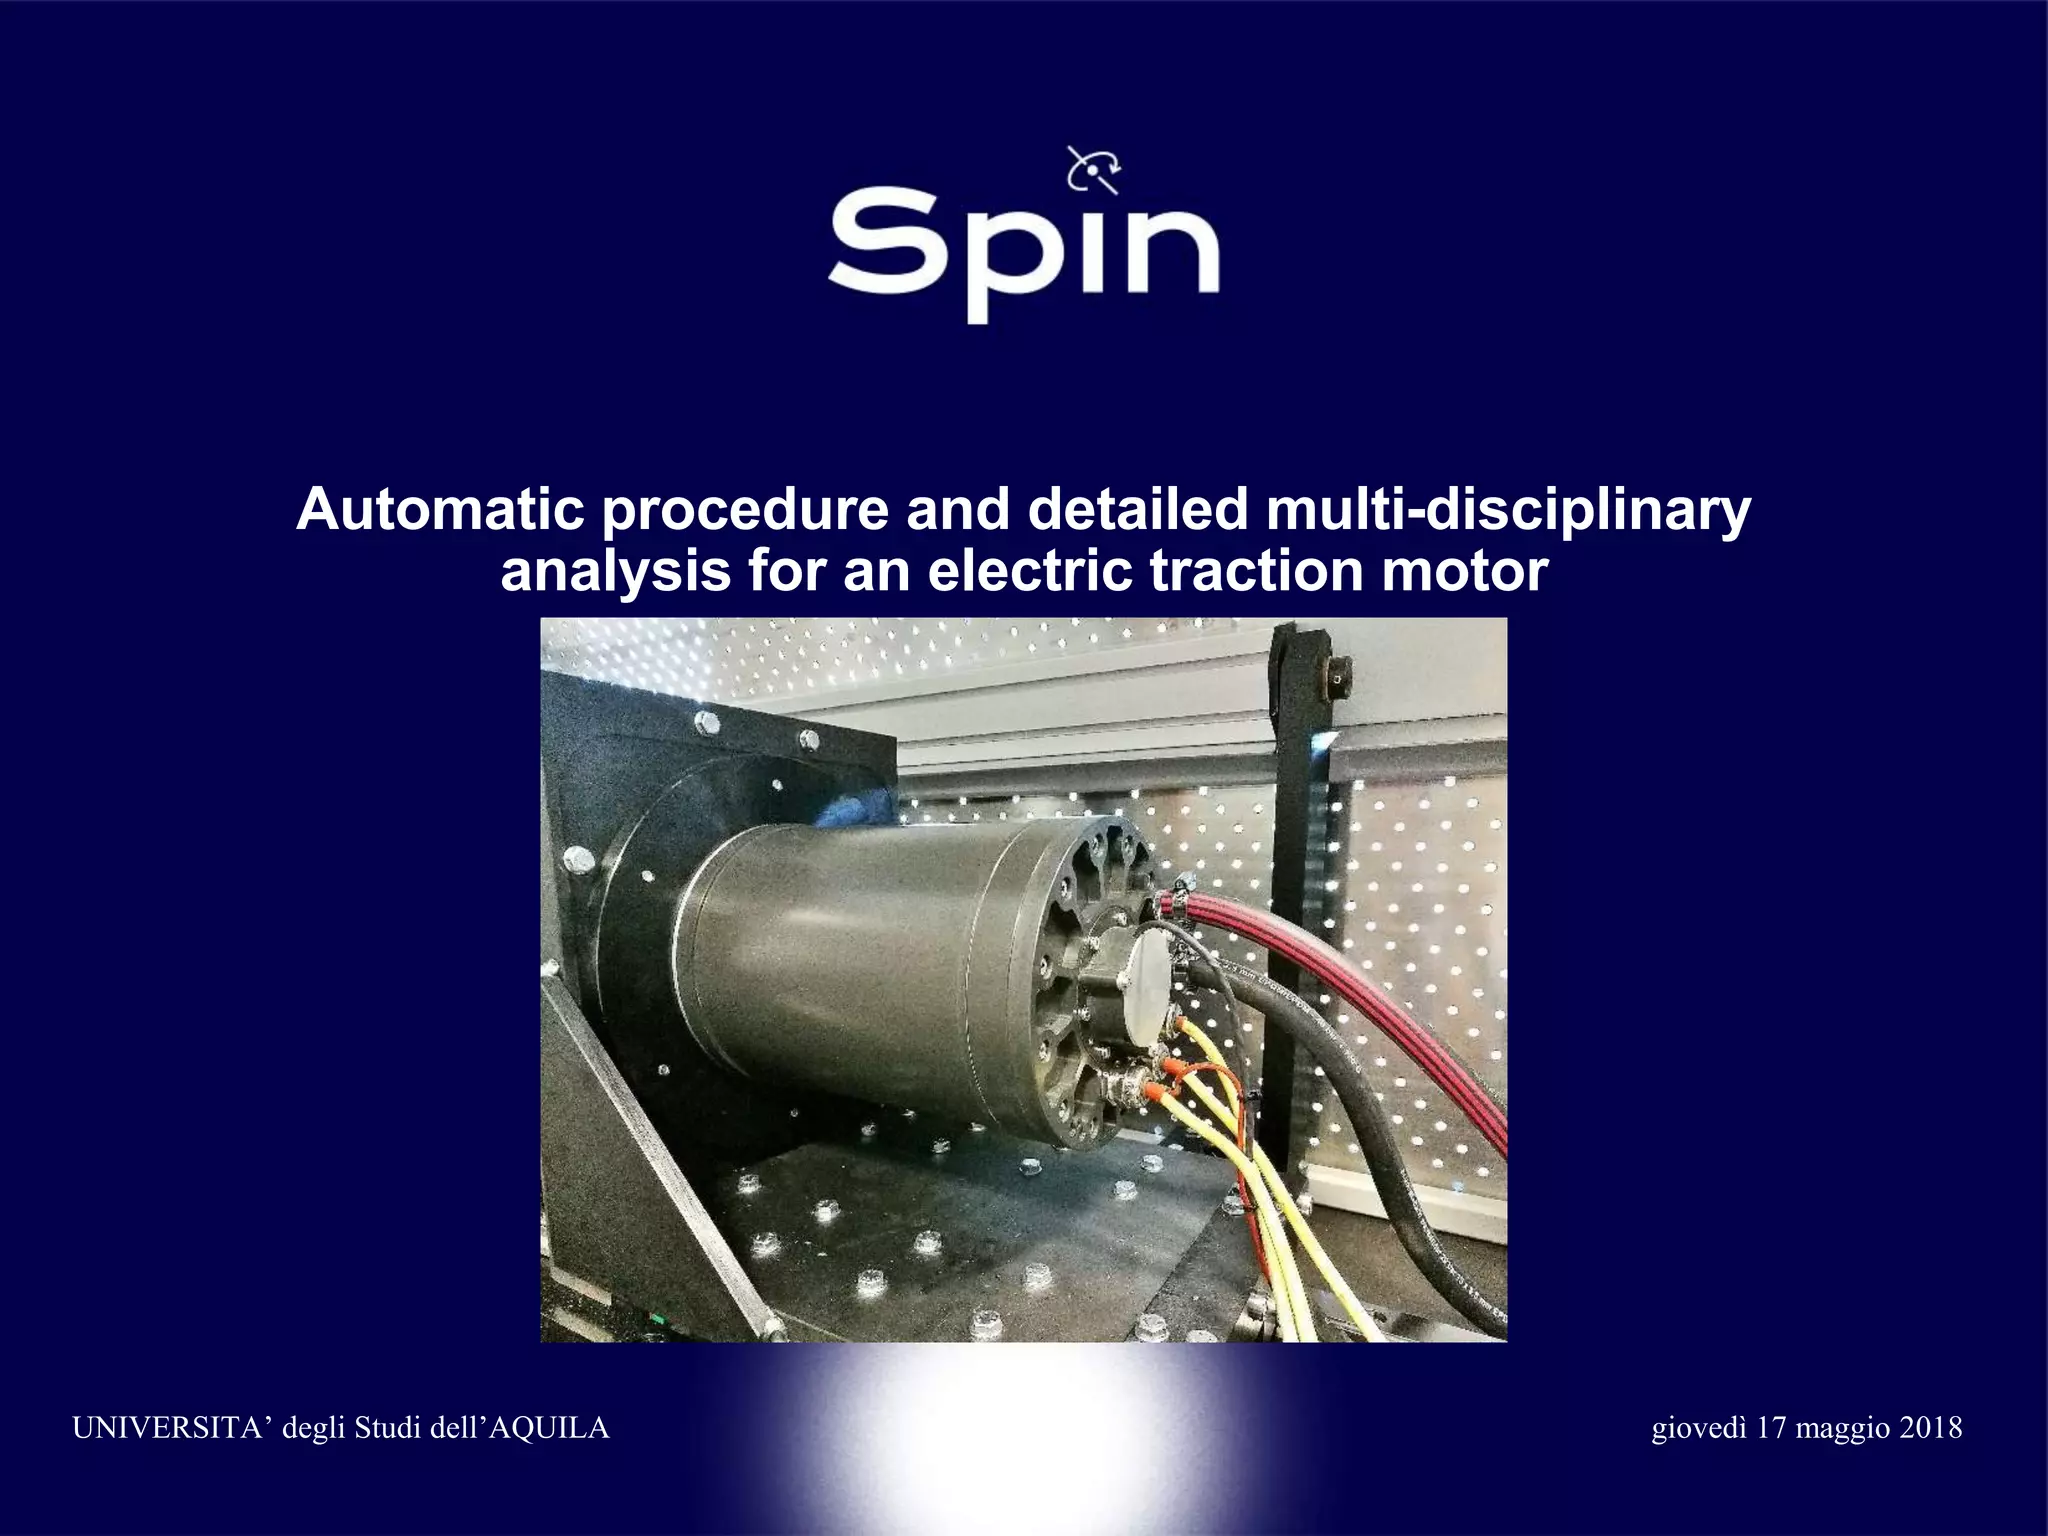
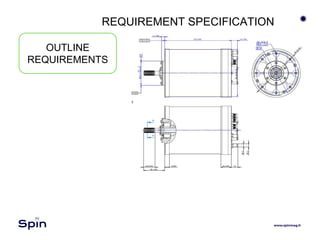
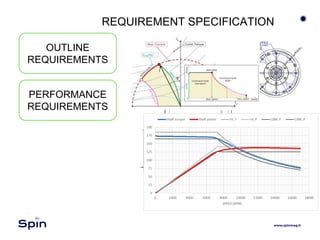
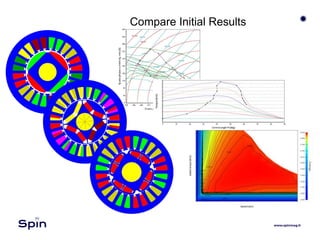
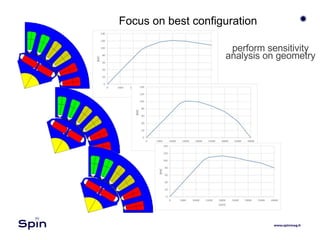
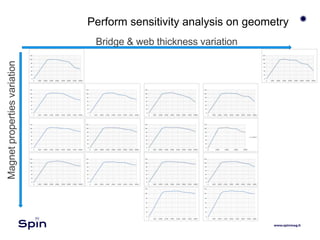
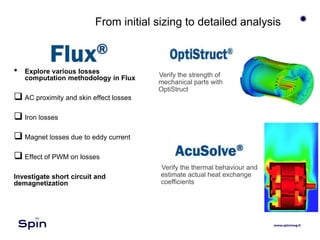
This document outlines an automatic procedure for designing and analyzing electric traction motors through multi-disciplinary analysis. It describes performing initial sizing and sensitivity analysis to explore different motor configurations. Key analyses include computing various loss mechanisms like AC proximity losses, investigating short circuits and demagnetization, verifying mechanical strength, and performing advanced thermal and vibration analyses. The goal is to optimize the motor design through this process to reduce losses, vibrations, and noise while ensuring adequate life, reliability, and performance.