Recommended

Recommended
More Related Content
What's hot
What's hot (19)
Viewers also liked
Similar to Summary and interpretation of monitoring data for synthetic pyrethroids in U.S. surface water and sediment
Similar to Summary and interpretation of monitoring data for synthetic pyrethroids in U.S. surface water and sediment (20)
Recently uploaded
Recently uploaded (20)
Summary and interpretation of monitoring data for synthetic pyrethroids in U.S. surface water and sediment
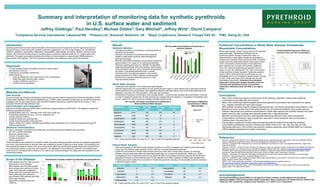
- 1. Summary and interpretation of monitoring data for synthetic pyrethroids in U.S. surface water and sediment Jeffrey Giddings1, Paul Hendley2, Michael Dobbs3, Gary Mitchell4, Jeffrey Wirtz1, David Campana1 Introduction Synthetic pyrethroids have been used for decades in North America and throughout the world for agricultural and non- agricultural insect control. Among the synthetic pyrethroids registered for use in the United States (U.S.) are bifenthrin, cyfluthrin, cyhalothrin, cypermethrin, deltamethrin, fenpropathrin, esfenvalerate, permethrin, tefluthrin, and their isomer variants. The Pyrethroid Working Group is compiling data on pyrethroid analytical results for U.S. surface waters and sediments. This poster summarizes the data and provides an initial evaluation on approximately 35000 analyses in approximately 7300 samples. The PWG continues to add data to the database as new reports are published. 1Compliance Services International, Lakewood WA 2Phasera Ltd., Bracknell, Berkshire, UK 3Bayer CropScience, Research Triangle Park NC 4FMC, Ewing NJ, USA Materials and Methods Data Sources Sources included open literature publications, public reports, and the California Department of Pesticide Regulation (CDPR) Surface Water Database. Other general databases (e.g. STORET) were evaluated but data were not included because they overlapped with the other data sources, often provided insufficient detail about sampling methods and results, or used analytical methods with high detection limits. Data Evaluation and Compilation Data were evaluated following USEPA Office of Pesticide Programs guidance (USEPA 2007). The database included the following supporting information: • Sampling station type (e.g., drainage canal, storm drain outfall, etc.) • Predominant watershed use (e.g., row crop, residential, etc.) • Sample collection method • Analytical method and reporting limits • Quality Assurance/Quality Control approach • Organic carbon (OC) content. Sediment concentrations were normalized to OC content and expressed as µg/g OC. • Sediment particle size Statistical Characterization For each combination of pyrethroid and sample type, the following descriptive statistics were generated: • 90th, 95th, and 99th percentiles • Maximum reported value • Number of reported values • Number of detections • Percent detections These calculations were performed for subsets of water body types (flowing and static) and land use categories (agricultural and urban). Data distributions for sediment were also analyzed by location (California vs other states). Concentrations that were reported as ranges or means in the source documents (rather than as individual sample results) were excluded from the distributional analysis, though they were retained in the database for future reference. Sediment concentrations that could not be OC-normalized due to absence of OC data (a very small percentage of the data) were also excluded from the distributional analysis. Results Sediment Samples • The highest pyrethroid concentrations in sediments were for bifenthrin and permethrin. • Sediment concentrations of pyrethroids were generally greater in water bodies receiving urban drainage than agricultural drainage. • Most 95th percentiles of sediment concentrations ranged from approximately 0.3 to 3 µg/g OC for individual pyrethroids. • Sediment sampling protocols (e.g., SWAMP, Puckett 2002) target depositional areas, which are typically a small fraction of the streambed (Hall et al. 2012). Pyrethroid concentrations are higher in fine-grained sediments than in coarser sediments which are preferred habitat for many benthic species (Rempel et al. 2000). Sediment monitoring data therefore over-represent pyrethroid exposure to many important benthic species. Conclusions • Many of the monitoring programs included event-driven sampling, intended to capture peak pyrethroid concentrations associated with storm events. • Many of the monitoring programs targeted sites where pesticide concentrations were expected to be highest (e.g., irrigation channels and storm drain sumps). • Most sediment sampling programs targeted depositional areas, and results overestimate concentrations in non- depositional areas (usually most of the wetted stream bed, and preferred habitat for many aquatic species). • Detection frequencies and pyrethroid concentrations in whole water samples and sediment samples from water bodies receiving urban drainage were generally greater than in agricultural areas. • Bifenthrin and permethrin were the most frequently detected pyrethroids in both water and sediment. • Concentrations and detection rates of pyrethroids, especially in urban sediments, were much greater in California than in the rest of the U.S. • Concentrations measured in surface water and sediment were far below the bulk water and sediment concentrations predicted by exposure modeling (see IUPAC Posters 757, 758, 759, 760, 765, and 766 Wednesday afternoon). This confirms that exposure modeling (especially using PRZM/EXAMS as in standard USEPA pesticide assessments) is highly conservative. Acknowledgements The Pyrethroid Working Group (PWG) is a US task force whose members include eight primary pyrethroid registrants (AMVAC Chemical Corporation, BASF Corporation, Bayer CropScience LP, Cheminova A/S, DuPont Crop Protection, FMC Corporation, Syngenta Crop Protection, LLC, Valent U.S.A. Corporation). Objectives • Compile available pyrethroid analytical results for surface waters and sediment in the U.S. • Characterize concentration distributions • Identify trends by: • Land use categories (urban, agricultural, mixed, undeveloped) • Water body types (flowing, static, marine) • Location (California, rest of U.S.) • Pyrethroid active ingredients Scope of the Database • Most samples were from sites receiving agricultural or urban drainage. • Most samples were from flowing water. • Most samples were sediment or whole water. Some data were available for filtered water and suspended sediment. • Most pyrethroids were analyzed in approximately 2000 sediment and 2000 whole water samples. • Nearly 90% of samples were from California. Distributions of sample numbers by watershed use and pyrethroid. Whole Water Samples • Pyrethroids were detected in 12% of the whole water samples. • Detection frequencies and concentrations of most pyrethroids were higher in urban streams than in agricultural streams. • Percent detections and concentrations were highest for bifenthrin (see table below). None of the other pyrethroids were detected in more than 4% of the samples in which they were analyzed. • Distributions of measured concentrations were strongly skewed – a small number samples had concentrations more than an order of magnitude greater than all other samples (see example below for bifenthrin). The highest concentrations were found in urban storm sewer sumps and irrigation drainage retention ponds. 95th Percentile Concentrations of Pyrethroids in Sediment Samples References • Hall LW Jr, Anderson RD, Killen WD. 2012. Mapping the spatial extent of depositional areas in agricultural, urban and residential California streams: Implications for pyrethroid toxicity. Human and Ecological Risk Assessment 18:368-392. • Hladik ML, Kuivila KM. 2009. Assessing the occurrence and distribution of pyrethroids in water and suspended sediments. J Agric Food Chem 57:9079-9085. • Hladik ML, Orlando JL, Kuivila KM. 2009. Collection of pyrethroids in water and sediment matrices: development and validation of a standard operating procedure. U.S. Geological Survey, Scientific Investigations Report 2009-5012. Available at http://pubs.usgs.gov/sir/2009/5012. • Puckett M. 2002. Quality assurance management plan for the State of California’s Surface Water Ambient Monitoring Program. Report prepared for California State Water Resources Control Board, Division of Water Quality, Sacramento, California. • Rempel LL, Richardson JS, Healey MC. 2000. Macroinvertebrate community structure along a gradient of hydraulic and sedimentary conditions in a large gravel-bed river. Freshwater Biology 45: 57-73. • Smith S Jr, Lizotte RE Jr. 2007. Influence of selected water quality characteristics on the toxicity of λ-cyhalothrin and γ-cyhalothrin to Hyalella azteca. Bull Env Contam Toxicol 79:548-551. • USEPA. 2007. Water quality data submissions: OPP standard operating procedures. Available online at: http://www.epa.gov/oppsrrd1/registration_review/water_quality_sop.htm#appendix_a. • Yang WC, Hunter W, Spurlock F, Gan J. 2007. Bioavailability of permethrin and cyfluthrin in surface waters with low levels of dissolved organic matter. J Env Qual 36:1678-1685. Freely Dissolved Chemical in Water as a Function of Koc and TOC Concentration Whole water samples contain varying amounts of suspended particulate matter. Hydrophobic chemicals such as pyrethroids partition strongly to particulate matter, so measurements in whole water samples are dominated by particle-bound material (Hladik and Kuivila 2009). The figure at right shows the relationship between total organic carbon (TOC) concentration and the fraction of chemical that is freely dissolved as a function of the partition coefficient (Koc). Koc values for pyrethroids are typically in the 106 range, so even with relatively low TOC, only a small fraction of total pyrethroid is freely dissolved. Pyrethroids sorbed to organic matter (dissolved as well as particulate) are not bioavailable and do not contribute to aquatic toxicity (Yang et al. 2007; Smith and Lizotte 2007) although they become bioavailable if they desorb. Pyrethroid concentrations measured in whole water samples therefore cannot be compared with pyrethroid toxicity concentrations measured in laboratory water with little or no organic matter. Pyrethroid Concentrations in Whole Water Samples Overestimate Bioavailable Concentrations Pyrethroid Number of Samples 95th %ile (ng/L) 99th %ile (ng/L) Detections (%) Bifenthrin 2141 39 373 20 Cyfluthrin 2183 <RLa 19 4 Cypermethrin 2388 <RL 15 3 Deltamethrin 665 <RL 8.9 2 Esfenvalerate 2335 <RL 3.1 2 Fenpropathrin 631 <RL 29 4 λ-cyhalothrin 2419 <RL 5.9 3 Permethrin 4428 <RL 62 3 Tefluthrin 293 <RL <RL 0 95th and 99th Percentile Concentrations of Pyrethroids in Whole (Unfiltered) Water Samples a <RL = below reporting limits. RLs were 0.5 to 1 ng/L in most of the samples analyzed. Distribution of Bifenthrin Concentrations in Whole Water Samples Filtered Water Samples • Data were available for 300 filtered water samples, primarily from USGS investigations in California and 6 other states. • Fewer than 5% of filtered water samples, all from California, contained detectable pyrethroids. • Pyrethroid concentrations in filtered water samples were much lower than in whole water samples, as expected. • Filtration removes particulate matter and associated pyrethroids, but not dissolved pyrethroids. Hladik et al. (2009) investigated the loss of dissolved pyrethroid onto glass fiber filters from samples processed using the USGS Standard Operating Procedure and found that less than 5% was retained on the filters. Analyses of filtered water samples were therefore presumed to reflect the concentrations of dissolved pyrethroid (including non-bioavailable pyrethroid adsorbed to dissolved organic matter). Pyrethroid Maximum (ng/L) Detections (%) Pyrethroid Maximum (ng/L) Detections (%) Bifenthrin 15 2.9 Fenpropathrin <RL 0.0 Cyfluthrin 7 0.7 λ-Cyhalothrin 65 0.7 Cypermethrin 12 0.3 Permethrin 15 2.7 Deltamethrin <RL 0.0 Tefluthrin <RL 0.0 Esfenvalerate 1.3 0.3 a <RL = below reporting limits. RLs were 0.5 to 1 ng/L in most of the samples analyzed.