SlideShare a Scribd company logo
1 of 186
Download to read offline
0 5 10 15 20 ECw
I i , I I I I 'I
0 5 15 20 25 30 35 EC.
100
ECo = Electrical Conductivity
of the Saturation
80
Extract (dS/m)
ECw =Electrical Conductivity
.. of the Irrigation
Water (dS/m)
i 60 EGe =1.5 ECw;;:
c.
eCJ
.I 40
~ UNSUITABLE
II: FOR CROPS
20
TOLERANT
•
0
EC.0 5 10 15 20 25 30 35
I I I I I d
0 5 10 15 20 ECw
dS/m
Water
for agr
Water uality
for agriculture
Library COpy
CALIFORIJ.1A REGIONAL WATER
QUALITY CONTROL BOARD
Central Valley Region
3448 RJuti:~iHond
.Sacramento, CA 95821'
I.ibt:
~q~
--ve,,...'Ii! C
' -~'ltl~~~~ O,o"y.
by '"''' 1Ii,,""'( l ...
R.S.Ayers ~,~,
Soil and Water Specialist (Emeritus) ,
University of California
Davis, California, USA
and
D.W. Westcot
Senior Land and Water Resources Specialist
California Regional Water Quality Control Board
/ Sacramento, California, USA
The designationsJ~~p18~yed and the presentation
of material il)"Jtiis.~Pu6I1catLon do not imply the
expression ~..ot 'any op:in.igd whatsoever on the
part o~, the' Food "and~Ag~iculture Organization
of th'(r;',~U·nited"";Niiii01Js;:'i{:'oncerningthe legal
s~atus of 'lily boi;ptry;:"territory, city or area or
of !t~o,a~th~~i,!les, ~!~~onc~rning the delimitation
O~,!~'fr,9ftlers Pt b~undane~d~}'
.'~~:~""".:,~{/"
M-56
ISBN 92-5-102263-1
All rights reserved. No part of this publication may be reproduced,
stored in a retrieval system, or transmitted in any form or by any means,
electronic, mechanical, photocopying or otherWise, without the prior
permission of the copyright owner. Applications for such permission,
with a statement of the purpose and extent of the reproduction, should
be addressed to the Director, Publications Division, Food and Agriculture
Organization of the United Nations, Via delle Terme di Caracalla, 00100
Rome, Italy.
© FAD 1985
PREFACE
Water Quality for Agriculture was first published in 1976 as
Irrigation and Drainage Paper 29. Although many of the basic concepts
of salinity control and dealing with poor quality water remain the
same, new data and experience have prompted us to revise the 1976 paper
in order to keep the user up-to-date.
The document is now presented as a field guide for evaluating
the suitability of a water for irrigation. Included are suggestions for
obtaining maximum utilization of an existing or potential water supply.
Guideline values given identify a potential problem water based on
possible restrictions in use related to 1) salinity, 2) rate of water
infiltration into the soil, 3) a specific ion toxicity, or 4) to some
other miscellaneous effects. Discussions and examples are given along
with possible management alternatives to deal with these potential
problems.
This paper is intended to provide guidance to farm and project
managers, consultants and engineers in evaluating and identifying
potential problems related to water quality. It discusses possible
restrictions on the use of the water and presents management options
which may assist in farm or project management, planning and operation.
The guidelines and discussions are based on reported experiences gained
from many farm areas throughout the world, mostly in arid and semi-arid
areas. A vast majority of the data has come from agriculture in the
Western United States, therefore, caution and a critical attitude
should be taken when applying the guidelines to specific local condi-
tions. The guidelines can indicate potential problems and possible
restrictions on use of the water but the true suitability of a given
water depends on the specific conditions of use and on the management
capability of the user. The guidelines should be useful in placing
water quality effects in perspective with the other factors affecting
crop production, the ultimate goal being to obtain maximum production
per unit of available water.
Salinity is discussed from the standpoint of a reduction in
soil-water availability to the crop. Recent research findings on plant
response to salinity within the root zone have been incorporated into
the guidelines to improve their predictive capability. Updated crop
tolerance values have also become available and ~re included. A method
is presented for calculating the leaching requirement for the crop
considering the quality of water available. Values calculated by this
procedure, if adopted, represent an appreciable water saving as
compared to most older procedures.
A water infiltration problem related to water quality is usually
associated with both the salinity and sodium content of the water. A
procedure is presented to evaluate the potential of a water to cause an
infiltration problem based on a combination of its salinity (Ee ) and
sodium adsorption ratio (SAR). w
A specific ion toxicity is discussed as to the concentration of
boron, sodium or chloride and their effect on yield of sensitive crops.
Other less frequently encountered problems are discussed as miscellane-
ous problems. Tables showing recommended maximum concentrations of
trace elements for irrigation water and for toxic substances in
drinking water for livestock are also presented.
ACKNOWLEDGEMENTS
These guidelines are based on various preceding
guidelines developed and used in irrigated agriculture in
the Western United States. The format follows that used
by the staff of the University of California, USA. Many
of the basic data and the concepts of saline water use and
management have been developed or proposed by the US
Salinity Laboratory and the authors would like to express
their grateful appreciation for this help, particularly to
Drs. G.J. Hoffman, E.V. Maas, J.D. Rhoades, D.L. Suarez,
and the Laboratory Director, J. van Schilfgaarde.
Drs. R.L. Branson and J.D. Oster (University of
California), Dr. J. Van Hoorn (Wageningen), Mr. J.D.
Doorenbos (Ministry of Agriculture, The Netherlands), and
staff of the Land and Water Development Division (FAO)
have been particularly helpful with suggestions and draft
reviews. Thanks are also due to: Chrissi Smith-Redfern,
Hazel Tonkin, Charlene Arora and Mary Westcot.
The paper is dedicated to the field person who must
make decisions on the effective use of irrigation water.
This paper attempts to take the solution and prevention of
water quality problems to the field. The ultimate goal is
that of maximum food production from the available supply
of water.
NOTE:
In running text where symbols are used, e. g. ECdw, for
mechanical reasons they have been typed level on the line.
However, they appear correctly in the equations where
greater flexibility is possible e.g. EC dw'
Preface
Acknowledgements
CONTENTS
iv
1
1
2
3
4
4
5
59
13
5
6
59
59
77
13
13
15
21
77
65
72
73
74
74
23
23
29
41
47
52
56
65
77
79
81
iii
Page
Salinity
Water infiltration rate
Toxicity
Miscellaneous
Drainage
Salinity control by leaching
Crop tolerance to salinity
Cultural practices
Changing methods of irrigation
Land development for salinity control
Changing or blending water supphies
Chloride
Sodium
Boron
Soil and water amendments
Blending water supplies
Cultivation and deep tillage
Organic residues
Irrigation management
Approach to Evaluating Water Quality
Water Quality Guidelines
1. 2.1
1.:1.2
1. 2.3
1. 2.4
Introduction
Build-up of Soil Salinity
Salinity Effects on Crops
Management of Salinity Problems
2.4.1
2.4.2
2.4.3
2.4.4
2.4.5
2.4.6
2.4.7
3.2.1
3.2.2
3.2.3
3.2.4
3.2.5
4.1.1
4.1. 2
4.1. 3
3.1.1 Infiltration problem evaluation
WATER QUALITY EVALUATION
1.1 Introduction
1.2 Water Quality Problems
2.1
2.2
2.3
2.4
3.1 The Infiltration Problem
INFILTRATION PROBLEMS
SALINITY PROBLEMS
3.2 Management of Infiltration Problems
1.3
1.4
4.1 Specific Ions and Their Effects
TOXICITY PROBLEMS
1.
3.
2.
4.
vi
4.2 Management of Toxicity Problems
4.3 Toxicity Effects due to Sprinkler Irrigation
4.2.1
4.2.2
4.2.3
4.2.4
Leaching
Crop selection
Cultural practices
Blending water supplies
81
84
86
86
87
87
5. MISCELLANEOUS PROBLEMS
5.1 Excess Nitrogen
5.2 Abnormal pH
5.3 Scale Deposits
5.4 Magnesium Problems
5.5 Trace Elements and Their Toxicity
91
91
92
93
94
95
5.7 Clogging Problems in Localized (Drip) Irrigation Systems 99
5.8 Corrosion and Encrustation 104
5.6 Nutrition and Water Quality
5.5.1
5.5.2
5.5.3
5.6.1
5.6.2
5.6.3
5.6.4
Natural occurrence in water
Toxicities
Evaluation criteria
Nutrition and salinity
Water infiltration problems and nutrition
Nutrition and toxicity
Miscellaneous
95
95
97
97
97
98
98
99
6.
5.8.1 Metal corrosion
5.8.2 Concrete corrosion
5.9 Vector Problems Associated with Water Quality
WATER QUALITY FOR LIVESTOCK AND POULTRY
104
105
107
111
6.1
6.2
6.3
Introduction
Use of Saline Water for Livestock
Toxic Substances in Livestock Water
111
III
114
7.
8.
IRRIGATION WATER QUALITY AND WASTEWATER RE-USE
EXPERIENCES USING WATER OF VARIOUS QUALITIES
8.1 Introduction
8.2 Protection of Irrigation Water Quality
- Sacramento-San Joaquin Delta, USA
8.3 Re-use of Agricultural Drainage Water
- ?roadview Water District, USA
8.4 Use of an Exceptionally Low Salinity Water
- Friant-Kern Canal, San Joaquin Valley,
California, USA
117
121
121
121
122
123
8.15 Groundwater Degradation - Wadi Dhuleil, Jordan 132
8.22 Wastewater Irrigation - Bakersfield, California, USA 140
8.6 Use of Poor Quality Water - Bahrain 124
159
163
8.24 Irrigation with Wastewater - Santa Rosa, California, USA 142
vii
8.25 Use of Wastewater High in Boron - Calistoga,
California, USA 144
8.21 Agricultural Use of Treated Wastewater
- Braunschweig, FR Germany 139
8.23 Wastewater Irrigation - Tuolumne Regional Water
District, California, USA 141
8.17 Sediment in the Irrigation Water Supply - Ethiopia 133
•8.20 Fresno Irrigation Scheme Using Treated Wastewater
- California, USA 138
8.19 Poor Quality Groundwater for Livestock Drinking Water
- New Mexico, USA 137
8.18 High Fluoride in Animal Drinking Water - New Mexico, USA 135
8.5 High Bicarbonate Water Used for Overhead Sprinkler
Irrigation - Denver, Colorado, USA 123
8.14 River Water Quality Variations - Ethiopia and Somalia 132
8.11 Use of Marginal Quality Water - Medjerda Valley,
Tunisia 129
8.8 Need for Drainage - Tigris-Euphrates River Basin, Iraq 126
8.10 Use of Agricultural Drainage Water for Production
of Selected Crops - Imperial Valley and San
Joaquin Valley, California, USA 127
8.13 Irrigation Water Quality - Lake Chad, Africa 130
8.9 High Salinity Water - Arizona, USA 126
8.7 Drainage Problems - Imperial Valley, California, USA 125
8.12 Use of Poor Quality Water for Irrigation
- United Arab Emirates 129
.8.16 Surface Water Quality Degradation - Yemen Arab Republic 133
REFERENCES
Annex I Table - Water analysis of 250 selected irrigation
supplies from various locations in the world 145
Annex II Glossary
62
70
71
78
sodium 80
82
83
88
1.
2.
3.
4.
5.
6.
7.
8.
9.
10.
11.
12.
13 .
14.
15.
16.
17.
18.
19.
20.
21.
22.
23.
ix
LIST OF TABLES
Guidelines for interpretations of water quality for
irrigation
Laboratory determinations needed to evaluate common
irrigation water quality problems
Concentration factors (Xl for predicting soil salinity
(ECel from irrigation water salinity (EC ) and the
leaching fraction (LF) w
Crop tolerance and yield potential of selected crops as
influenced by irrigation water salinity (ECwl or soil
salinity (EC )
e
Relative salt tolerance of agricultural crops
Guidelines for interpreting laboratory data on water
suitability for grapes
Relative salt tolerance of various crops at germination
Effect of planting rates on seedling establishment of
crops sprinkle-irrigated with different quality
water in Israel
Relative effect of fertilizer materials on the soil
solution
Water quality from blended canal and well water
Calcium concentration (Ca ) expected to remain in
near-surface soil-water xfollowing irrigation with
water of given HC0
3
/Ca ratio and ECw
Water and soil amendments and their relative
effectiveness in supplying calcium
Average composition and equivalent acidity or
basicity of fertilizer materials
Chloride tolerance of some fruit crop cultivars and
rootstocks
Relative tolerance of selected crops to exchangeable
Relative boron tolerance of agricultural crops
Citrus and stone fruit rootstocks listed in order of
increasing boron accumulation and transport to leaves
Relative tolerance of selected crops to foliar injury
from saline water applied by sprinklers
Leaf burn on alfalfa with three rates of water
application by sprinkler irrigation in Imperial
Valley, California
~odium content in cotton leaves in percent oven dry weight
Recommended maximum concentrations of trace elements
in irrigation water
Physical, chemical and biological contributors to
clogging or localized (drip) irrigation systems as
related to irrigation water quality
Standard water quality tests needed for design and
operation of localized (drip) irrigation systems
Page
8
10
18
31
34
40
40
44
48
58
89
89
96
100
100
24.
25.
26.
27.
28.
29.
30.
31.
32.
33.
34.
35.
36.
37.
38.
39.
40.
41.
42.
43.
44.
45.
x
Influence of water quality on the potential for clogging
problems in localized (drip) irrigation systems
Procedure for calculation of pHc
Chlorine dosages for control of biological growths
Limit values for evaluating the aggressivity of water
and soil to concrete
Water quality guide for livestock and poultry uses
Suggested limits for magnesium in drinking water for
livestock
Guidelines for levels of toxic substances in livestock
drinking water
Existing standards governing the use of renovated
water in agriculture
Treatment processes suggested by the World Health
Organization for wastewater re-use
Selected crop yield from the Safford Experiment Station
as compared to average farm yields
Red Mountain Farms lint cotton yields (kg/ha)
Salinity of the Medjerda River at El Aroussia,
Tunisia (monthly mean in dS/m)
Effect of irrigation method on tomato yield (kg/ha)
Effect of irrigation method on sodium and chloride
concentration of the foliage of lemon trees (dry
weight basis)
Trace element concentrations of three water supply
wells in selected areas of New Mexico, USA
Fluoride in well water in mg/l
Salt and trace element content of a cattle water source
Water analyses for the Agua Negra Ranch (mg/l)
Trace element concentrations in Fresno municipal
wastewater
Water quality in and around the Braunschweig treated
wastewater use area
Trace element concentrations in wastewater from the
Tuolumne Regional Water District
Trace element and nutrient content of wastewater from
the City of Santa Rosa
101
103
104
106
112
112
114
118
119
127
127
129
130
130
136
136
137
138
139
140
142
143
1.
2.
3.
4.
5.
6.
7.
8.
9.
10.
11.
12.
13.
14.
15.
16.
17.
18.
19.
20.
21.
xi
LIST OF FIGURES
Nomogram for determining the SAR value of irrigation
water and for estimating the corresponding ESP value
of a soil that is at equilibrium with the water
Salinity profile expected to develop after long-term
use of water of EC
w
= 1.0 dS/m at various leaching
fractions (LF)
Soil moisture retention curves for a clay loam soil
at varying degrees of soil salinity (EC· )
e
Change in salinity of soil-water (EC ) between
irrigations of alfalfa due to ET useswof stored water
Salinity profile with a high water table
Relation between capillary flow velocity and depth of
water table
Effect of applied water salinity (EC ) upon root zone
soil salinity (EC) at various wleaching fractions
e
Soil salinity (EC ) of a sandy-loam soil before and
after 150 rom ofe rainfall
Soil salinity (EC ) profiles at the end of the irrigation
season and after ewinter rainfall in citrus plantings
Divisions for relative salt tolerance ratings of
agricultural crops
Method of determining maximum EC
e
Flat top beds and irrigation practice
Salinity control with sloping beds
Sloping seedbeds
Sloping seedbeds used for salinity and temperature control
Bed shapes and salinity effects
Salt accumulation patterns for a) surface flooding,
b) furrow irrigation, c) border irrigation, and
d) localized irrigation
Influence of the irrigation system on the soil salinity
pattern and yield of bell pepper at two levels of
irrigation water quality
Depth of leaching water per unit depth of soil required
to reclaim a saline soil by continuous ponding
Depth of leaching water per unit depth of soil required
to reclaim a saline soil by ponding water intermittently
Relative rate of water infiltration as affected by
salinity and sodium adsorption ratio
Page
11
18
20
20
22
22
25
28
28
36
38
45
45
46
46
46
49
52
54
54
60
22.
23.
xii
Depth of leaching water per unit depth of soil required
to reclaim a soil inherently high in boron
Heavy metal content of the soil profile after 80 years
of irrigation with wastewater
85
95
24. Concentration factor from applied water
salinity (Ee) under sUbirrigation
peatland in e the Sacramento-San Joaquin
California, USA
(EC ) to soil
w .
on organlc
Delta,
122
25.
1.
2.
3.
4.
5.
6.
7.
8.
Electrical conductivity of Lake Chad from 26 February
to 10 April 1967
LIST OF EXAMPLES
Calculation of concentration of deep percolation from
the bottom of the root zone
Determination of average root zone salinity
Leaching requireme~t calculation
Determination of yield potential
Blending irrigation water for maize
Comparison of methods to calculate the sodium hazard
of a water
Use of gypsum as an amendment
Blending irrigation water to reduce the SAR of a
poor quality supply
131
14
16
26
38
57
64
67
72
- 1 -
1. WATER QUALITY EVALUATION
1.1 INTRODUCTION
Irrigated agriculture is dependent on an adequate water supply of
usable quality. Water quality concerns have often been neglected
because good quality water supplies have been plentigul and readily
available. This situation is now changing in many areas. Intensive use
of nearly all good quality supplies means that new irrigation projects
and old projects seeking new or supplemental supplies must rely on
lower quality and less desirable sources. To avoid problems when using
these poor quality water supplies, there must be sound planning to
ensure that the quality of water available is put to the best use.
The objective of this paper is to help the reader to a better
understanding of the effect of water quality upon soil and crops and to
assist in selecting suitable alternatives to cope with potential water
quality related problems that might reduce production under prevailing
conditions of use.
Conceptually, water quali ty refers to the characteristics of a
water supply that will influence its suitability for a specific use,
i.e. how well the quality meets the needs of the user. Quality is
defined by certain physical, chemical and biological characteristics.
Even a personal preference such as taste is a simple evaluation of
acceptabili ty. For example, if two drinking waters of equally good
quality are available, people may express a preference for one supply
rather than the other; the better tasting water becomes the preferred
supply. In irrigation water evaluation, emphasis is placed on the
chemical and physical characteristics of the water and only rarely are
any other factors considered important.
Specific uses have different quality needs and one water supply
is considered more acceptable (of better quality) if it produces better
results or causes fewer problems than an alternative water supply. For
example, good qual i ty river water which can be used successfully for
irrigation may, because of its sediment load, be unacceptable for muni-
cipal use without treatment to remove the sediment. Similarly, snowmelt
water of excellent quality for municipal use may be too corrosive for
industrial use without treatment to reduce its corrosion potential.
The ideal situation is to have several supplies from which to
make a selection, but normally only one supply is available. In this
case, the quality of the available supply must be evaluated to see how
it fits the intended use. Most of the experience in using water of
different qualities has been gained from observations and detailed
study of problems that develop following use. The cause and effect
relationship between a water constituent and the observed problem then
results in an evaluation of quality or degree of acceptability. With
sufficient reported experiences and measured responses, certain
constituents emerge as indicators of quality-related problems. These
characteristics are then organized into guidelines related to suit-
ability for use. Each new set of guidelines builds upon the previous
set to improve the predictive capability. Numerous such guidelines have
become available covering many types of use.
There have been a number of different water quality guidelines
related to irrigated agriculture. Each has been useful but none has
been entirely satisfactory because of the wide variability in field
condi tions. Hopefully, each new set of guidel ines has improved our
predictive capability. The guidelines presented in this paper have
relied heavily on previous ones but are modified to give more practical
- 2 -
procedures for evaluating and managing water quality-related problems
of irrigated agriculture. They are an updated version of those in the
1976 edition of this paper. Changes from the 1976 edition are discussed
in the appropriate sections of the paper.
1.2 WATER QUALITY PROBLEMS
Water used for irrigation can vary greatly in quality depending
upon type and quantity of dissolved salts. Salts are present in irri-
gation water in relatively small but significant amounts. They origi-
nate from dissolution or weathering of the rocks and soil, including
dissolution of lime, gypsum and other slowly dissolved soil minerals.
These salts are carried with the water to wherever it is used. In the
case of irrigation, the salts are applied with the water and remain
behind in the soil as water evaporates or is used by the crop.
The suitability of a water for irrigation is determined not only
by the total amount of salt present but also by the kind of salt.
Various soil and cropping problems develop as the total salt content
increases, and special management practices may be required to maintain
acceptable crop yields. Water quality or suitability for use is Judged
on the potential severity of problems that can be expected to develop
during long-term use.
The problems that result vary both in kind and degree, and are
modified by soil, climate and crop, as well as by the skill and
knowledge of the water user. As a result, there is no set limit on
water quality; rather, its suitability for use is determined by the
conditions of use which affect the accumulation of the water con-
stituents and which may restrict crop yield. The soil problems most
commonly encountered and used as a basis to evaluate water quality are
those related to salinity, water infiltration rate, toxicity and a
group of other miscellaneous problems.
WATER QUALITY-RELATED PROBL1llIS IN IRRIGATED AGRICULTUIlE
SALINITY
Salts in Bailor water reduce water availability to the crop
to such an extent that yield is affected.
WATER INI!'ILTlIATION RATE
Relatively high sodium or low calcium content of sailor water
reduces the rate at which irrigation water enters soil to such
an extent that sufficient water cannot be infiltrated to
supply the crop adequately from one irrigation to the next.
SPECIFIC ION TOXICITY
Certain ions (sodium, chloride, or boron) from Bailor water
accumulate in a sensitive crop to concentrations high enough
to cause crop damage and reduce yields.
MIScm,I.ANEOUS
Excessive nutrients reduce yield or quality; unsightly
deposits on fruit or foliage reduce marketability; excessive
corrosion of equipment increases maintenance and repairs.
- 3 -
1. 2.1 Salinity
A salinity problem exists if salt accumulates in the crop root
zone to a concentration that causes a loss in yield. In irrigated
areas, these salts often originate from a saline, high water table or
from salts in the applied water. Yield reductions occur when the salts
accumulate in the root zone to such an extent that the crop is no
longer able to extract sufficient water from the salty soil solution,
resulting in a water stress for a significant period of time. If water
uptake is appreciably reduced, the plant slows its rate of growth. The
plant symptoms are similar in appearance to those of drought, such as
wilting, or a darker, bluish-green colour and sometimes thicker, waxier
leaves. Symptoms vary with the growth stage, being more noticeable if
the salts affect the plant during the early' stages of growth. In some
cases, mild salt effects may go entirely unnoticed because of a uniform
reduction in growth across an entire field.
Salts that contribute to a salinity problem are water soluble
and readily transported by water. A portion of the salts that accumu-
late from prior irrigations can be moved (leached) below the rooting
depth if more irrigation water infiltrates the soil than is used by the
crop during the crop season. Leaching is the key to controlling a water
quality-related salinity problem. Over a period of time, salt removal
by leaching must equal or exceed the salt additions from the applied
water to prevent salt building up to. a damaging concentration. The
amount of leaching required is dependent upon the irrigation water
quality and the salinity tolerance of the crop grown.
Salt content of the root zone varies with depth. It varies from
approximately that of the irrigation water near the soil surface to
many times that of the applied water at the bottom of the rooting
depth. Salt concentration increases with depth due to plants extracting
water but leaving salts behind in a greatly reduced volume of soil
water. Each subsequent irrigation pushes (leaches) the salts deeper
into the root zone where they continue to accumulate until leached. The
lower rooting depth salinity will depend upon the leaching that has
occurred.
Following an irrigation, the most readily available water is in
the upper root zone - a low salinity area. As the crop uses water, the
upper root zone becomes depleted and the zone of most readily available
water changes toward the deeper parts as the time interval between
irrigations is extended. These lower depths are usually more salty. The
crop does not respond to the extremes of low or high salinity in the
rooting depth but integrates water availability and takes water from
wherever it is most readily available. Irrigation timing is thus
important in maintaining a high soil-water availability and reducing
the problems caused when the crop must draw a significant portion of
its water from the less available, higher salinity soil-water deeper in
the root zone. For good crop production, equal importance must be given
to maintaining a high soil-water availability and to leaching accumu-
lated salts from the rooting depth before the salt concentration
exceeds the tolerance of the plant.
For crops irrigated infrequently, as is normal when using
surface methods and conventional irrigation management, crop yield is
best correlated with the average root zone salinity, but for crops
irrigated on a daily, or near daily basis (localized or drip irriga-
tion) crop yields are better correlated with the water-uptake weighted
root zone salinity (Rhoades 1982). The differences are not great but
may become important in the higher range of salinity. In this paper,
discuss ions are based on crop response to the average root zone
salinity.
- 4 -
In irrigated agriculture, many salinity problems ~re. associated
with or strongly influenced by a shallow water table (w1th1n 2 metres
of the surface). Salts accumulate in this water table and frequently
become an important additional source of salt that moves upward into
the crop root zone. Control of an existing shallow water table is thus
essential to salinity control and to successful long-term irrigated
agriculture. Higher salinity water requires appreciable extra water for
leaching, which adds greatly to a potential water table (drainage)
problem and makes long-term irrigated agriculture nearly impossible to
achieve without adequate drainage. If drainage is adequate, salinity
control becomes simply good management to ensure that the crop is
adequately supplied with water at all times and that enough leaching
water is applied to control salts within the tolerance of the crop.
1.2.2 Water Infiltration Rate
An infiltration problem related to water quality Occurs when the
normal infiltration rate for the applied water or rainfall is appreci-
ably reduced and water remains on the soil surface too long or infil-
trates too slowly to supply the crop with sufficient water to maintain
acceptable yields. Although the infiltration rate of water into soil
varies widely and can be greatly influenced by the quality of the
irrigation water, soil factors such as structure, degree of compaction,
organic matter content and chemical make-up can also greatly influence
the intake rate.
The two most cornmon water quality factors which influence the
normal infiltration rate are the salinity of the water (total quantity
of salts in the water) and its sodium content relative to the calcium
and magnesium content. A high salinity water will increase infiltra-
tion. A low salinity water or a water with a high sodium to calcium
ratio will decrease infiltration. Both factors may operate at the same
time. Secondary problems may also develop if irrigations must be pro-
longed for an extended period of time to achieve adequate infiltration.
These include crusting of seedbeds, excessive weeds, nutritional dis-
orders and drowning of the crop, rotting of seeds and poor crop stands
in low-lying wet spots. One serious side effect of an infiltration
problem is the potential to develop disease and vector (mosquito)
problems.
An infiltration problem related to water quality in most cases
occurs in the surface few centimetres of soil and is linked to the
structural stability of this surface soil and its low calcium content
relative to that of sodium. When a soil is irrigated with a high sodium
water, a high sodium surface soil develops which weakens soil struc-
ture. The surface soil aggregates then disperse to much smaller
particles which clog soil pores. The problem may also be caused by an
extremely low calcium content of the surface soil. In some cases, water
low in salt can cause a similar problem but this is related to the
corrosive nature of the low salt water and not to the sodium content of
the water or soil. In the case of the low salt water, the water
dissolves and leaches most of the soluble minerals, including calcium,
from the surface soil.
1. 2.3 Toxic.i ty
Toxicity problems occur if certain constituents (ions) in the
soil or water are taken up by the plant and accumulate to concentra-
tions high enough to cause crop damage or reduced yields. The degree of
damage depends on the uptake and the crop sensitivity. The permanent,
perennial-type crops (tree crops) are the more sensitive. Damage often
- 5 -
occurs at relatively low ion concentrations for sensitive crops. It is
usually first evidenced by marginal leaf burn and interveinal chloro-
sis. If the accumulation is great enough, reduced yields result. The
more tolerant annual crops are not sensitive at low concentrations but
almost all crops will be damaged or killed if concentrations are
sufficiently high.
The ions of primary concern are chloride, sodium and boron.
Al though toxici ty problems may occur even when these ions are in low
concentrations, toxicity often accompanies and complicates a salinity
or water infiltration problem. Damage results when the potentially
toxic ions are absorbed in significant amounts with the water taken up
by the roots. The absorbed ions are transported to the leaves where
they accumulate during transpiration. The ions accumulate to the
greatest extent in the areas where the water loss is greatest, usually
the leaf tips and leaf edges. Accumulation to toxic concentrations
takes time and visual damage is often slow to be noticed. The degree of
damage depends upon the duration of exposure, concentration by the
toxic ion, crop sensitivity, and the volume of water transpired by the
crop. In a hot climate or hot part of the year, accumulation is more
rapid than if the same crop were grown in a cooler climate or cooler
season when it might show little or no damage.
Toxicity can also occur from direct absorption of the toxic ions
through leaves wet by overhead sprinklers. Sodium and chloride are the
primary ions absorbed through leaves, and toxicity to one or both can
be a problem with certain sensitive crops such as citrus. As concentra-
tions increase in the applied water, damage develops more rapidly and
becomes progressively more severe.
1.2.4 Miscellaneous
Several other problems related to irrigation water quality occur
with sufficient frequency for them to be specifically noted. These in-
clude high nitrogen concentrations in the water which supplies nitrogen
to the crop and may cause excessive vegetative growth, lodging, and
delayed crop maturity; unsightly deposits on fruit or leaves due to
overhead sprinkler irrigation with high bicarbonate water, water con-
taining gypsum, or water high in iron; and various abnormalities often
associated with an unusual pH of the water. A special problem faced by
some farmers practising irrigation is deterioration of equipment due to
water-induced corrosion or encrustation. This problem is most serious
for wells and pumps, but in some areas, a poor quality water may also
damage irrigation equipment and canals. In areas where there is a
potential risk from diseases such as malaria, schistosomiasis and
lymphatic filariasis, disease vector problems must be considered along
with other water quality-related problems. Vector problems (mosquitoes)
often originate as a secondary trouble related to a low water infiltra-
tion rate, to the use of wastewater for irrigation, or to poor drain-
age. Suspended organic as well as inorganic sediments cause problems in
irrigation systems through clogging of gates, sprinkler heads and
drippers. They can cause damage to pumps if screens are not used to
exclude them. More commonly, sediments tend to fill canals and ditches
and cause costly dredging and maintenance problems. Sediment also tends
to reduce further the water infiltration rate of an already slowly
permeable soil.
1.3 APPROACH TO EVALUATING WATER QUALITY
The prediction that a water quality-related problem will occur
requires evaluation of the potential of the water to create soil condi-
- 6 -
1.4 WATER QUALITY GUIDELINES
If problems do occur in combination, they are more easily
understood and solved if each factor is considered individually.
Therefore, the guidelines and discussion which follow treat each
problem and its solution separately, so that a number of factors are
evaluated for each of the problem areas, such as:
the management options that are available to pre-
vent, correct, or delay the onset of the problem.
the expected severity of the problem following
long-term use of the water;
the soil-water-plant interactions that may cause
the loss in crop yield;
the type and concentration of salts causing the
problem;
*
*
*
*
The guidelines are practical and have been used successfully in
general irr~gated agriculture for evaluation of the common constituents
in surface water, groundwater, drainage water, sewage effluent and
wastewater. They are based on certain assumptions which are given
immediately following the table. These assumptions must be clearly
understood but should not become rigid prerequisites. A modified set of
alternative guidelines can be prepared if actual conditions of use
differ greatly from those assumed.
Guidelines for evaluation of water quality for irrigation are
given in Table 1. They emphasize the long-term influence of water
quali ty on crop production, soil conditions and farm management, and
are presented in the same format as in the 1976 edition but are updated
to include recent research results. This format is similar to that of
the 1974 University of California Committee of Consultant's Water
Quality Guidelines which were prepared in cooperation with staff of the
United States Salinity Laboratory.
The four problem categories previously discussed salinity,
infiltration, toxicity and miscellaneous - are used for evaluation.
Water quality problems, however, are often complex and a combination of
problems may affect crop production more severely than a single problem
in isolation. The more complex the problem, the more difficult it is to
formulate an economical management programme for solution.
This approach is the same as in the 1976 edition of this paper
and similar guidelines are proposed for evaluating the potential of an
irrigation water to create soil or crop problems. The guidelines are
followed by suggestions on management alternatives to overcome these
poten tial problems. This approach is often referred to as a problem-
solving approach and emphasizes long-term effects on irrigated agri-
culture rather than short-term, because of the large investments now
needed in irrigated agriculture.
tions that may restrict its use or that may require the use of special
management techniques to maint~in accept~ble yields. There are a.number
of procedures available for thls evaluatl0n but regardless of WhlCh one
is used, emphasis should focus on relating the potential problem to the
field situation since solutions to water quality problems usually must
be implemented at the farm level rather than at the project level. The
evaluation must therefore be done in terms of specific local conditions
of use and the farm management capability of the water user.
- 7 -
Ordinarily, no soil or cropping problems are experienced or
recognized when using water with values less than those shown for 'no
restriction on use'. with restrictions in the slight to moderate range,
gradually increasing care in selection of crop and management alterna-
tives is required if full yield potential is to be achieved. On the
other hand, if water is used which equals or exceeds the values shown
for severe restrictions, the water user should experience soil and
cropping problems or reduced yields, but even with cropping management
designed especially to cope with poor quality water, a high level of
management skill is essential for acceptable production. If water
quality values are found which approach or exceed those given for the
severe restriction category, it is recommended that before initiating
the use of the water in a large project, a series of pilot farming
studies be conducted to determine the economics of the farming and
cropping techniques that need to be implemented.
Table 1 is a management tool. As with many such interpretative
tools in agriculture, it is developed to help users such as water
agencies, project planners, agriculturalists, scientists and trained
field people to understand better the effect of water quality on soil
conditions and crop production. With this understanding, the user
should be able to adjust management to utilize poor quality water
better. However, the user of Table 1 must guard against drawing
unwarranted conclusions based only on the laboratory results and the
guideline interpretations as these must be related to field conditions
and must be checked, confirmed and tested by field trials or experi-
ence.
The guidelines are a first step in pointing out the quality
limitations of a water supply, but this alone is not enough; methods to
overcome or adapt to them are also needed. Therefore, in subsequent
sections, management alternatives are presented and several examples
are given to illustrate how the guidelines can be used.
The guidelines do not evaluate the effect of unusual or special
water consti tuents sometimes found J.n wastewater, such as pesticides
and organics. However, suggested limits of trace element concentrations
for normal irrigation water are given in Section 5.5. As irrigation
water supplies frequently serve as a drinking water source for live-
stock, salinity and trace element drinking water limitations for
livestock are presented in Section 6.
It is beyond the scope of this publication to go into drinking
water standards, but this aspect should, nevertheless, be considered
during the planning of an irrigation scheme. This is important, because
irr igation supplies are also commonly used, either intentionally or
unintentionally, as human drinking water. The World Health Organization
(WHO) or a local health agency should be consulted for more specific
information.
Laboratory determinations and calculations needed to use the
guidelines are given in Table 2 and Figure 1, along with the symbols
used. Analytical procedures for the laboratory determinations are given
in several publications: USDA Handbook 60 (RichardS 1954), Rhoades and
Clark 1978, FAO Soils Bulletin 10 (Dewis and Freitas 1970), and
Standard Methods for Examination of Waters and Wastewaters (APHA 1980).
The method most appropriate for the available equipment, bUdget and
number of samples should be used. Analytical accuracy within ~5 percent
is considered adequate.
1 Adapted from University of California Committee of Consultants 1974.
2 ECw means electrical conductivity~ a measure of the water salinity, reported in deciSiemens
per metre at 25 D
C (dS/m) or in units millimhos per centimetre (mmho/cm)w Both are equiva-
lent. TDS means total dissolved solids, reported in milligrams per litre (mg/l).
3 sAR means sodium adsorption ratio. SAR is sometimes reported by the symbol RNaw See Figure
1 for the SAR calculation procedure. At a given SAR, infiltration rate increases as water
salinity increases. Evaluate the potential infiltration problem by SAR as modified by ECw.
Adapted from Rhoades 1977, and Oster and Schroer 1979.
4 For surface irrigation, most tree crops and woody plants are sensitive to sodium and chlor-
idej use the values shown. Most annual crops are not sensitive; use the salinity tolerance
tables (Tables 4 and 5). For chloride tolerance of selected fruit crops, see Table 14. With
overhead sprinkler irrigation and low humidity « 30 percent), sodium and chloride may be
absorbed through the leaves of sensitive crops. For crop sensitivity to absorption, see
Tables 18, 19 and 20.
S For boron tolerances, see Tables 16 and 17.
6 N03 -N means nitrate nitrogen reported in terms of elemental nitrogen (NH4 -N and Organic-N
should be included when wastewater is being tested).
GUIDELINES FOR INTERPRETATIONS OF WATER QUALITY FOR IRRIGATION'
Degree of Restriction on lise
> 9
> 3.0
> 2000
Severe
> 10
> 3.0
> 30
> 8.5
5 30
1.5 - 8.5
0.7 - 3.0
450 - 2000
Slight to Moderate
Normal Range 6.5 - 8.4
None
< 5
< 0.7
< 450
> 0.7 0.7 0.2 < 0.2
> 1.2 1.2 - 0.3 < 0.3
> 1.9 1.9 - 0.5 < 0.5
> 2.9 2.9 1.3 < 1.3
> 5.0 5.0 - 2.9 < 2.9
< 1.5
- 8 -
dS/m
Units
me/l
mg/l
mg/l
SAR < 3 3 - 9
me/l < 3 > 3
me/l < 4 4 - 10
me/l < 3 > 3
mg/l < 0.7 0.7 3.0
SAR = 0 - 3 and EG
3 - 6
w
6 12
12 - 20
20 40
TDS
Infiltration (affects infiltration
rate of water into the Boil.
Evaluate using ECw and 8AR
together) 3
surface irrigation
sprinkler irrigation
Boron (B)5
Trace Elements (see Table 21)
KG
w
surface irrigation
sprinkler irrigation
Chloride (GI)"
(or)
Speci£ic Ioo Toxicity (affects
sensitive crops)
Sodimo. (Ha) II
Salinity (affects crop water
availability) 2
Miscellaneous Effects (affects
susceptible crops)
Nitrogen (NO" - N)6
Bicarbonate (BCO,,)
(ovel~head sprinkling only)
pH
Potential Irrigation Problem
Table 1
- 9 -
Table 1 (cont.)
Assumptions in the Guidelines
The water quality guidelines in Table 1 are intended to cover the wide range of conditions
encountered in irrigated agriculture. Several basic assumptions have been used to define
their range of usability. If the water is used under greatly different conditions, the
guidelines may need to be adjusted. Wide deviations from the assumptions might result in
wrong judgements on the usability of a particular water supply, especially if it 1s a
borderline case. Where sufficient experience J field trials, research or observations are
available, the guidelines may be modified to fit local conditions more closely.
The bas:i.c assumptions in the guidelines are:
Yield Potential: Full production capability of all crops, without the use of special
practices, is assumed when the guidelines indicate no restrictions on use. A "restriction
on use" indicates that there may be a limitation in choice of crop, or special management
may be needed to maintain full production capability. A "restruction on use" does not
indicate that the water is unsuitable fpr use.
Site Conditions: Soil texture ranges from sandy-loam to clay-loam with good internal
drainage. The climate is semi-arid to arid and rainfall is low. Rainfall does not playa
significant role in meeting crop water demand or leaching requirement. (In a monsoon
climate or areas where precipitation is high for part or all of the year, the guideline
restrictions are too severe. Under the higher rainfall situations, infiltrated water from
rainfall is effective in meeting all or part of the leaching requirement.) Drainage is
assumed to be good, with no uncontrolled shallow water table present within 2 metres of the
surface.
Methods and TiDing of Irrigations: Normal surface or sprinkler irrigation methodS are
used. Water is applied infrequently, as needed, and the crop utilizes a considerable
portion of the available stored soil-water (50 percent or more) before the next irrigation.
At least 15 percent of the applied water percolates below the root zone (leaching fraction
[LF] :2::15 percent). The guidelines are too retrictive for specialized irrigation methods,
such as localized drip irrigation, which results in near daily or frequent irrigations, but
are applicable for subsurface irrigation if surface applied leaching satisfies the leaching
requirements.
Vater Uptake by Crops: Different crops have different water uptake patterns, but all take
water from wherever it is most readily available within the rooting depth. On average about
40 percent is assumed to be taken from the upper quarter of the rooting depth, 30 percent
from the second quarter, 20 percent from the third quarter, and 10 percent from the lowest
quarter. Each irrigation leaches the upper root zone and maintains it at a relatively low
salinity. Salinity increases with depth and is greatest in the lower part of the root zone.
The average salinity of the soil-water is three times that of the applied water and is
representative of the average root zane salinity to which the crop responds. These
conditions result from a leaching fraction of 15-20 percent and irrigations that are timed
to keep the crop adequately watered at all times.
Salts leached from the upper root zone accumulate to some extent in the lower part but a
salt balance is achieved as salts are moved below the root zone by sufficient leaching. The
higher salinity in the lower root zone becomes less important if adequate moisture is
maintained in the upper, "more active" part of the root zone and long-term leaching is
accomplished.
Restriction on Use: The "Restriction on Use" shown in Table 1 is divided into three
degrees of severity: none, slight to moderate, .and severe. The divisions are somewhat
arbitrary since change occurs gradually and there is no clearcut breaking point. A change
of 10 to 20 percent above or below a guideline value has little significance if considered
in proper perspective with other factors affecting yield. Field studies, research trials
and observations have led to these divisions,' but management skill of the water user can
alter them. Values shown are applicable under normal field conditions prevailing in most
irrigated areas in the arid and semi-arid regions of the world.
- 10 -
Table 2 LABORATORY DETERMINATIONS NEEDED TO EVAlUATE COMMON IRRIGATION WATER
QUAlITY PROBLEMS
Water parameter Symbol Unit l
Usual range in
irri~ation water
SAlINITY
EC dS/m O' - 3 dS/mw
TDS mg/l o - 2000 mg/l
Ca++ me/l 0 - 20 me/l
Mg++ me/l o - 5 me/l
Na+ me/l 0 - 40 me/l
CO;- me/l o - .1 me/l
HCO, me/l o - 10 me/l
CI- me/l o - 30 me/l
SO, me/l 0 - 20 me/l
Carbonate
Bicarbonate
Chloride
Sulphate
Salt Content
Electrical Conductivity
(or)
Total Dissolved Solids
Magnesium
Sodium
Cations and Anions
Calcium
Nitrate-Nitrogen
Ammonium-Nitrogen
Phosphate-Phosphorus
Potassium
NO,-N mg/l o - 10 mg/l
NH,-N mg/l o - 5 mg/l
PO,-P mg/l 0 - 2 mg/l
K+ mg/l 0 - 2 mg/l
MISCELLANEOUS
Boron
Acid/Basicity
Sodium Adsorption Ratio 3
B
pH
SAR
mg/l
1-14
(me/l)',2
o - 2
6.0 - 8.5
o - 15
mg/l
1 dS/m = deciSiemen/metre in 8.1. units (equivalent to 1 mmho/cm
metre)
1 millimmho/cen
mg/l = milligram per litre ~ parts per million (ppm).
me/l = milliequivalent per litre (mg/l + equivalent weight
= 1 millimol/litre adjusted for electron charge.
me/I); in SI units, 1 me
2 N03 -N means the laboratory will analyse for N03 but will report the N03 in terms
chemically equivalent nitrogen. Similarly, for NH4 -N, the laboratory will analyse fo
NH 4 but report in terms of chemically equivalent elemental nitrogen. The tot
nitrogen available to the plant will be the Sum of the equivalent elemental nitroge
The same reporting method is used for phosphorus.
, SAR is calculated from the Na, Ca and Mg reported in me/l (see Figure 1).
No·
me/I
20
15
10
5
o
Fig. J
- 11 -
The Sodium Adsorption Ratio (SAR) can also be
calculated using the following equation:
No
SAR =
Where No, Co and Mg are sodium, calcium,
and magnesium in me/l from the
woter analysis.
Nomogram for determining the SAR value of irrigation
water and for estimating the corresponding ESP value
of a soil that is at equilibrium with the water
(Richards 1954)
0.25
0.50
0.75
1.0
5
10
15
20
- 13 -
2.1 INTRODUCTION
2.2. BUILD-UP OF SOIL SALINITY
(2 )
depth of water leached below the root zone
depth of water applied at the surface
Leaching
Fraction (LF)
After many successive irrigations, the salt accumulation in the
soil will approach some equilibrium concentration based on the salinity
of the applied water and the leaching fraction. A high leaching
fraction (LF ~ 0.5) results in less salt accumulation than a lower
leaching fraction (LF ~ 0.1). If the water salinity (ECw) and the
leaching fraction (LF) are known or can be estimated, both the salinity
of the drainage water that percolates below the rooting depth and the
Salts are added to the soil with each irrigation. These salts
will reduce crop yield if they accumulate in the rooting depth to
damaging concentrations. The crop removes much of the applied water
from the soil to meet its evapotranspiration demand (ET) but leaves
most of the salt behind to concentrate in the shrinking volume of soil-
water. At each irrigation, more salt is added with the applied water. A
portion of the added salt must be leached from the root zone before the
concentration affects crop yield. Leaching is done by applying suffi-
cient water so that a portion percolates through and below the entire
root zone carrying with ita portion of the accumulated sal ts. The
fraction of applied water that passes through the entire rooting depth
and percolates below is called the leaching fraction (LF).
2. SALINITY PROBLEMS
The intent of this chapter is to illustrate the effect of water
quality on the build-up of soil salinity and show how the latter can
reduce the soil-water available to the crop. This is followed by a
discussion of how leaching, crop selection and other management
techniques are used to make salinity control easier and allow greater
use of more saline water in irrigated agriculture. Emphasis will be on
how to manage intermediate quality water with slight to moderate
restrictions on use, as shown in Table 1. Such water could result in
more severe problems if it is not properly managed. The same management
techniques will apply to a poorer quality water, but as quality worsens
the options for management become fewer.
Most water used for irrigation is of good to excellent quality
and is unlikely to present serious salinity constraints. Salinity
control, however, becomes more difficult as water quality becomes
poorer. As water salinity increases, greater care must be taken to
leach salts out of the root zone before their accumulation reaches a
concentration which might affect yields. Alternatively, steps must be
taken to plant crops tolerant to the expected root zone salinity. The
frequency of leaching depends on water quality and the crop sensitivity
to salinity.
Irrigation water contains a mixture of naturally occurring
salts. Soils irrigated with this water will contain a similar mix but
usually at a higher concentration than in the applied water. The extent
to which the salts accumulate in the soil will depend upon the irriga-
tion water quality, irrigation management and the adequacy of drainage.
If salts become excessive, losses in yield will result. To prevent
yield loss, salts in the soil must be controlled at a concentration
below that which might affect yield.
- 14 -
average root zone salinity can be estimated. The salinity of the
drainage water can be estimated from the equation:
where: ECdw
= salinity of the drainage water percolating below the
root zone (equal to salinity of soil-water, ECsw)
ECw
= salinity of the applied irrigation water
LF = leaching fraction
(3 )
=
In Example 1, the leaching fraction and water quality are used
to predict drainage water quality. The plant, however, is only exposed
to this drainage water salinity at the lowest part of the root zone.
The salinity in this lower portion of the root zone tends to be higher
than in the upper portion due to its much lower leaching fraction. The
crop responds, however, to the average root zone soil salinity and not
to the extremes of either the upper or lower zones.
EXA!Il'LE 1 - CALCULATION OF CONCENTRATION OF DEEP PERCOLATION FROII THE
BOTTOII OF THE IlOOT ZONB
A crop is irrigated with water of an electrical conductivity (ECw) of
1 dS/m. The crop is irrigated to achieve a leaching fraction of 0.15
(assumes that 85 percent of the applied water is used by the crop or
evaporates from the soil surface).
Given: EC
w 1 dS/m
LF 0.15
Explanation:
The concentration of the soil-water percolating below the root zone
(ECsw) is equivalent to the concentration of the drainage water
(ECdw) accumulating below the root zone. The salinity of the deep
percolation from the bottom of the root zone (drainage water) can be
estimated by using equation (3):
EC
EC
dw
EC w (3 )
sw LF
EC
dw
1
6.7 dS/m
0.15
The salinity of the soil-water that is percolating from the bottom of
the root zone (ECdw) will be approximately 6.7 dS/m.
Equation (3) can also be used to predict average soil-water
salinity (ECsw) in the rooting depth if certain assumptions are made
regarding water use within the root zone. The guidelines of Table 1
assume that 40, 30, 20 and 10 percent of the water used by the crop
comes, respectively, from the upper to lower quarter of the rooting
- 15 -
2.3 SALINITY EFFECTS ON CROPS
depth. This water use pattern closely fits conditions found under
normal irrigation practices. An illustration is given in Example 2
where the above water use pattern is used to estimate average soil-
water salinity (ECsw).
(4 )
(5 )
(6 )
EC = 3 ECwsw
ECe
= 1.5 ECw
EC = 2 ECsw e
The primary objective of irrigation is to provide a crop with
adequate and timely amounts of water, thus avoiding yield loss caused
by extended periods of water stress during stages of crop growth that
are sensitive to water shortages. However, during repeated irrigations,
the salts in the irrigation water can accumulate in the soil, reducing
water available to the crop and hastening the onset of a water short-
age. Understanding how this occurs will help suggest ways to counter
the effect and reduce the probability of a loss in yield.
The plant extracts water from the soil by exerting an absorptive
force greater than that which holds the water to the soil. If the plant
cannot make sufficient internal adjustment and exert enough force, it
is not able to extract sufficient water and will suffer water stress.
This happens when the soil becomes too dry. Salt in the soil-water
increases the force the plant must exert to extract water and this
additional force is referred to as the osmotic effect or osmotic
If irrigation practices result in greater or less leaching than
the 15-20 percent LF assumed in the guidelines of Table 1, a more
correct concentration factor can be calculated using a new estimated
average leaching fraction and the procedure illustrated in Example 2.
Table 3 lists concentration factors for a wide range of leaching
fractions (LF = 0.05 to 0.80). The predicted average soil salinity
(ECe) is estimated by multiplying the irrigation water salinity (ECw)
by the appropriate concentration factor for the estimated leaching
fraction (see equation (8) in Table 3). These predicted average soil
salinities reflect changes due to long-term water use and not short-
term changes that may occur within a season or between irrigations.
Figure 2 illustrates typical soil salinity profiles that can be
identified and are typical of salinity distribution in the crop root
zone after several years of irrigation with one water source and
closely similar leaching fractions.
Example 2 shows that with a 15 percent leaching fraction and a
40-30-20-10 water use patterm the average soil-water salinity (ECsw) is
approximately 3.2 times more concentrated than the applied irrigation
water. At a leaching fraction of 20 percent, the average ECsw is 2.7
times the salinity of the applied irrigation water (ECw). The guide-
lines of Table 1 were developed assuming a 15-20 percent leaching
fraction range which results in an average soil-water sal ini ty (ECsw)
approximately 3 times that of the applied water. The soil-water
salinity (ECsw) is the average root zone salihity to which the plant is
exposed. It is difficult to measure. Salinity measurement is normally
done on a saturation extract of the soil and referred to as the soil
salinity (ECe). This soil salinity, (ECe), is approximately equal to
one-half of the soil-water salinity (ECsw). As a general rule of thumb,
at a 15-20 percent leaching fraction, salinity of the applied water
(ECw) can be used to predict or estimate soil-water salinity (ECsw) or
soil salinity (ECe) using the following equations:
- 16 -
EXAMPLE 2 - DETERMINATION OF AVERAGE ROOT ZONE SALINITY
The average root zone salinity can be calculated using the average of five points in
the rooting depth. The following procedure can be used to estimate the average root
zone salinity to which the crop responds.
t.10 ET
t.40 ET
Crop water demand (ET) 1000
mm/season.
Desired leaching fraction (LF)
0.15. The leaching fraction of 0.15
means that 15,.percent of the applied
irrigation water entering the
surface percolates below the root
zone and 85 percent replaces water
used by the crop to meet its ET
demand and water lost by surface
evaporation.
The crop water use pattern is 40-30-
20-10. This means the crop will get
40 percent of its ET demand from
the upper quarter of the root zone,
30 percent from the next quarter,
20 percent from the next, and
10 percent from the lowest quarter.
Crop water use will increase the
concentration of the soil-water
which drains into the next quarter
(EC ) of the root zone.
sw
1. Applied water salinity (EC ) = 1
dS/m. w
2.
3.
ASSUlfi'TIONS
4.
t.20 ET
t.30 ET
,--------.lL----:Il--,. LFo
ECswo
-""'f"--------,iIrli'....... LF1
ECsw1
EXPLAHATION
1. Five points in the root zone are used to determine the average root zone
salinity. These five points are soil-water salinity at (1) the soil surface,
(ECswO); (2) bottom of the upper quarter of the. root zone, (ECsw1); (3) bottom
of the second quarter depth, (ECsw2); (4) bottom of the third quarter, (ECsw3)
and (5) bottom of the fourth quarter or the soil-water draining from the root
zone (ECsw4) which is equivalent to the salinity of the drainage water (ECdw).
2. With a LF of 0.15, the applied water (AW) needed to meet both the crop ET and
the LF is determined from the following equation:
AW
ET
1 LF
= 1176 mm of water (7)
3. Since essentially all the applied water enters and leaches through the soil
surface, effectively removing any accumulated salts, the salinity of the soil
water at the surface (ECswO) must be very close to the salinity of the applied
water as shown using equation (3) and assuming LFO = 1.0.
EC
w
LF
o
1
T 1 dS/m (3)
- 17 -
5. The average soil-water salinity of the root zone is found by taking the average
of the five root zone salinities found above:
1.5 dS/m
EC
EC =~=6.7dS/m
sw4 LF4
EC
EC = ~ = 2.5 dS/m
sw
2
LF
2
EC
EC = ~ = 4.3 dS/m
sw3 LF3
EC
EC w
sw = LF
0.15
0.23
0.40
0.66
1176-.40(1000)-.30(1000)-.20(1000)-.10(1000)
1176
1176-.40(1000)-.30(1000)
1176
1176-.40(1000)
1176
Water leached
Water applied
at the bottom of the root zone (fourth quarter):
= ..::1.=..17'-'6:....-..:..4.:..:0,..,(",1.=..00::..:0:"<)-;--7:'3"",0~(-=.10::..:0:.:0,-,,)_-::..:,2:.:0,,-(.=..10::..:0:.:0-,-)
1176
at the bottom of the second quarter:
at the bottom of the third quarter:
EC + EC + EC + EC + EC
EC sWO
sWl sW2 sW3 sW4
sw 5
EC
1.0+1.5+ 2.5 + 4.3 + 6.7
3.2 dS/m
sw 5
LF
2
For the bottom of the first quarter:
LF
6. This calculation shows that the soil-water draining below the root zone will be
3.2 times as concentrated as the applied water.
4. The salinity of the soil-water draining from the bottom of each root zone
quarter is found by determining the leaching fraction for that quarter using
equation (2) and then determining the soil-water salinity using equation (3).
- 18 -
Table 3 CONCENTRATION FACTORS (X) FOR PREDICTING SOIL
SALINITY (ECe) 1 FROM IREIGATION WATER SALINITY
(EO.) AND THE LEACHING FRACTION (LF)
Leaching
Fraction
(LF)
Applied Water
Needed
(Percent of ET)
Concentration
Factor 2
(X)
0.05
0.10
0.15
0.20
0.25
0.30
0.40
0.50
0.60
0.70
0.80
105.3
111.1
117.6
125.0
133.3
142.9
166.7
200.0
250.0
333.3
500.0
3.2
2.1
1.6
1.3
1.2
1.0
0.9
0.8
0.7
0.6
0.6
1 The equation for predicting the soil salinity expected after
several years of irrigation with water of salinity ECw is:
EC (dS/m) = EC (dS/m)' X
e w
(8)
2 The concentration factor is found by using a crop water use
pattern of 40-30-20-10. The procedure is shown in example 2.
..LF .1
..LF .15
tLF.2
+LF.4
a
100
25
.<:
0... Assumed water use'0
0'
pattern
"
50
~T"0 o 30
0
i 20 0
~
-0
"e
75
0
0.5 1.0 2.0 3.0 4.0 5.0
ECa (dS/m)
Fig. 2 Salinity profile expected to develop after long-term use of
water of ECw = 1.0 dS/m at various leaching fractions (LF)
- 19 -
potential. For example, if two otherwise identical soils are at the
same water content but one is salt-free and the other is salty, the
plant can extract and use more water from the salt-free soil than from
the salty soil. The reasons are not easily explained. Salts have an
affinity for water. If the water contains salt, more energy per unit of
water must be expended by the plant to absorb relatively salt-free
water from a relatively salty soil-water solution.
For all practical purposes, the added energy required to absorb
water from the salty soil (osmotic potential) is additive to the energy
required to absorb water from a salt-free soil (soil-water potential).
The cumulative effect is illustrated in Figure 3 and results in an
important reduction in water available to the crop as salinity in-
creases. Salinity effects are closely analogous to those of drought as
both result in water stress and reduced growth. Stunting, leaf damage
and necrosis or obvious injury to the plant are only noticeable after
prolonged exposure to relatively high salinity.
The previous discussion showed how the concentration of salts in
the soil varied with leaching fraction and depth in the root zone and
resulted in an increase in concentration as the leaching fraction
decreases or with increasing depth in the root zone. As the soil dries,
the plant is also exposed to a continually changing water availability
in each portion of the rooting depth since the soil-water content
(soil-water potential) and soil-water salinity (osmotic potential) are
both changing as the plant uses water between irrigations. The plant
absorbs water but most of the salt is excluded and left behind in the
root zone in a shrinking volume of soil-water. Figure 4 shows that
following an irrigation, the soil salinity is not constant with depth.
Following each irrigation, the soil-water content at each depth in the
root zone is near the maximum, and the concentration of dissolved salts
is near the minimum. Each changes, however, as water is used by the
crop between irrigations.
The plant exerts its absorptive force throughout the rooting
depth and takes water from wherever most readily available (the least
resistance to absorption). Usually this is the upper root zone, the
area most frequently replenished by irrigation and rainfall. Since more
wa ter passes through this upper root zone, it is more thoroughly
leached and the osmotic or salinity effects are much less than at
greater depths. Between irrigations, the upper root zone dries more
rapidly than the lower because of the proliferation of roots in this
zone which extract the readily available soil moisture. The plant must
then meet more of its water demand from increasingly greater depths as
the upper soil-water is depleted. Both the soil moisture at depth and
the soil moisture remaining in the upper portions have a higher soil-
water salinity and thus a greater osmotic potential. As the plant
depletes the soil-water, a water extraction pattern develops. The
extraction pattern of 40, 30, 20 and 10 percent for the upper to lower
quarters of the root zone is assumed in the guidelines in Table 1. This
closely fits water extraction patterns under normal irrigation prac-
tices and is assumed throughout this paper.
The pattern for water uptake is closely related to the frequency
of irrigation. With infrequent irrigations, as assumed for the guide-
lines in Table 1, the typical extraction pattern is 40-30-20-10, but
for more f~equent irrigations the water uptake pattern is skewed
towards greater uptake from the upper root zone and less from the lower
and the crop rooting depth tends to be at shallower depths. A typical
e~traction pattern might be 60-30-7-3. Whatever the frequency, irriga-
tlons must be timed to supply adequate water and prevent crop moisture
stress between irrigations, especially if soil salinity is also
affecting water availability.
- 22 -
ECe in dS/m
0 10 20 30 40 50 60 70 80
0
10
20
30 Profile N~ 3
40 Depth (cm) ECe (dS/m)
0-20 56.6
E 50 20-35 4.4()
c 35-75 1.9
60
75-90 2.3.J::
-c.
90 (saturated) 5.4Q)
70
0
80
90
100 -- -e<-
'lIa~ ~e-=
110
,0'0 __
---
120 --- Fig. 5 Salinity profile with a high water table
(Mohamed and AIDer 1972)
mm/day
0 2 3 4 5 6
0
CLA'I LOAM
100
200
E
u
.s 300
.<:
0.Q)
" Surfoce soil- woter
400 Potentloi =-16 bors
500
Fig. 6
600
Relation between capillary
flow velocity and depth of
water table (Van Hoorn 1979)
- 23 -
reclamation, the permanent cropping pattern will be determined by
water quality. In a few instances, an alternative water supply may
be available for periodic use or can be blended with a poorer water
supply to diminish a quali ty-related hazard. These al ternati ves,
including drainage, leaching, cropping changes and cultural
practices, will be discussed in more detail in the following
sections.
2.4.1 Drainage
Salinity problems encountered in irrigated agriculture are
very frequently associated with an uncontrolled water table within
one to two metres of the ground surface (Figure 5). In most soils
with a shallow water table, water rises into the active root zone
by capillarity and, if the water table contains salts, it becomes a
continual source of salts to the root zone as water is used by the
crop or evaporates at the soil surface. Salinization from this
source can be rapid in irrigated areas in hot climates where
portions of the land remain fallow for extended periods. The rate
of soil salinity accumulation from an uncontrolled shallow water
table will depend upon irrigation management, salt concentration
and depth of the groundwater, soil type, and climatic conditions.
Figure 6 shows that capillary rise from a shallow water table can
represent a sizeable salt input into the root zone.
In arid and semi-arid climates, a salinity problem caused or
complicated by poor drainage cannot be adequately controlled until
the water table is stabilized and maintained at a safe depth -
usually at least two metres. This requires open or tile drains or
drainage wells to remove a part of the salty subsurface water and
transport it to an acceptable salt-sink for safe disposal. When
drainage is adequate, salinity related directly to water quality
and irrigation management becomes a problem only if the salts
applied with the irrigation water are allowed to accumulate to a
concentration which reduces yield. Effective salinity control,
therefore, must include adequate drainage to control and
stabilize the water table and leaching as needed to reduced the
accumulated salts. A net downward flux of surface applied water to.
achieve the required leaching will then control the salinity. The
guidelines in Table 1 and the remainder of the discussion in this
paper assume that all salts accumulating in the crop root zone corne
from the applied water. This means drainage is adequate and
salinity management is a significant part of irrigation manage-
ment.
2.4.2 Salinity Control by Leaching
When the build-up of soluble salts in the soil becomes or is
expected to become excessive, the salts can be leached by applying
more water than that needed by the crop during the growing season.
This extra water moves at least a portion of the salts below the
root zone by deep percolation (leaching). Leaching is the key
factor in controlling soluble salts brought in by the irrigation
water. Over time, salt removal by leaching must equal or exceed the
salt additions from the applied water or salts will build up and
eventually reach damaging concentrations. The questions that arise
are how much water should be used for leaching and when should
leachings be applied?
- 24 -
i. The leaching requirement'
To estimate the leaching requirement, both the irrigation wate
sal ini ty (ECw) and the crop tolerance to soil salinity (ECe
must be known. The water salinity can be obtained from labora
tory analysis while the ECe should be estimated from appropriat
crop tolerance data given in the tables in Section 2.4.3 of thi
paper. These tables give an acceptable ECe value for each cro
appropriate to the tolerable degree of yield loss (usually 1
percent or less).
The necessary leaching requirement (LR) can be estimated from
Figure 7 for general crop rotations. For more exact estimate
for a particular crop, the leaching requirement equation (9
(Rhoades 1974; and Rhoades and Merrill 1976) should be used:
(9
EC
wLR =
5 (ECe ) - ECw
= the minimum leaching requirement needed to
control sal ts wi thin the tolerance (ECe) o
the crop with ordinary surface methods o
irrigation
LRwhere:
EC
w = salinity of the applied irrigation water in
dS/m
EC
e average soil salinity tolerated by the cro
as measured on a soil saturation extract
Obtain the ECe value for the given crop an
the appropriate acceptable yield from Tabl
4. It is recommended that the ECe value tha
can be expected to result in at least a 9
percent or greater yield be used in th
calculation. (Figure 7 was developed using
ECe values for the 100 percent yield poten
tial.) For water in the moderate to high
salinity range (> 1.5 dS/m) , it might b
better to use the ECe value for maximum yield
potential (100 percent) since salinity con
trol is critical to obtaining good yields.
The total annual depth of water that needs to be applied to mee
both the crop demand and leaching requirement can be estimate
from equation (7).
AW = ET
1 - LR
( 7
where: AW
ET
LR
= depth of applied water (mm/year)
= total annual crop water demand (mm/year)
leaching requirement expressed as a fraction
(leaching fraction)
In many texts, the Terms 'leaching fraction (LF)' and 'leaching
requirement (LR)' are used interchangeably. They both refer to tha
portion of the irrigation which should pass through the root zone t
control salts at a specific level. While LF indicates that the valu
be expressed as a fraction, LR can be expressed either as a fraction
or percentage of irrigation water.
10B
Assumed crop we fer
use pattern
642
Salinity of applied water (ECw) in dS/m
Effect of applied tvater salinity (ECw) upon root zone
soil salinity (ECe) at various leaching fractions (LF)
Fig. 7
The timing of leachings does not appear to be critical provided
crop tolerance is not exceeded for extended or critical periods
of time. This certainly does not mean that leaching is rela-
tively unimportant. The leaching requirement must be satisfied
to prevent excessive salt accumulation. Leaching can be done at
- 25 -
Unsuitable
------- 10
It takes time to accumulate salts in the root zone to a concen-
tration that reduces yield. Most irrigacion water is of such
good quality that, without leaching, two or more years of
irrigation will be required before salinity accumulates suff-
iciently to affect yield. Further, the later in the growing
season the salts reach damaging concentrations, the less will be
their effect. This suggests that if salts are low enough at the
start of the irrigation season, efficiency of water use during
the growing season can be 100 percent (no leaching) without loss
of yield due to salinity. For the next season, rainfall, dormant
season and pre-plant irrigations, singly or in combination, can
be used to replenish deep soil moisture and leach soils free
enough of accumulated salts to allow efficient water use again
during the next growing season. It is often difficult to supply
both essential crop water and leaching water during the hot
summer season. The key factor to remember is that leaching is
not needed until accumulating salinity is expected to exceed
crop tolerance and reduce yield.
Tolerant crops E 8
"-
en
"t:>
c
-- -- .. 6
u
w
Moderately i':'
tolerant crops
'E
0 4
"'
- - -- 0
en
Moderately 2
sensitive crops
- - - -
Sensitive crops
- - - -
ii. Timing of leachings
- 26 -
each irrigation, each alternate irrigation or less frequentl
such as seasonally or at even longer intervals, as necessary
keep salinity below the threshold above which yields may
unacceptably reduced. In many instances, the usual ineff
ciencies of water application satisfy the leaching requireme
and additional leaching is wasteful of water (see Example 3
Where low leaching fractions «0.10) are needed, as with go
quality water, inefficiencies in irrigation water applicati
will almost always apply sufficient extra water to accompli
leaching. In other instances, particularly with higher salini
water, meeting the leaching requirement is difficult a
requires large amounts of water, possibly adding to a draina
problem. It can be assumed that an appreciable portion of t
total deep percolation losses from normal irrigation practic
is useful in controlling salinity.
EXAIfi'LE 3 - LEACHING REQUIREMENT CALCULATION
A maize crop is irrigated by furrow irrigation. The crop is planted in a uniform
loam soil and river water, which has an ECw = 1.2 dS/m, is used for irrigation. Th
crop evapotranspiration (ET) is 800 rom/season. The irrigation application efficiency
is 0.65. Therefore the total amount of water that must be applied to meet crop ET
demand is 800 rom/0.65 = 1230 rom/season. How much additional water must be applied
for leaching?
Given: EC 1.2 dS/m
ECw
2.5 dS/m (from Table 4 for maize at a 90 percent yielde potential)
EC 1. 7 dS/m (from Table 4 for maize at a 100 percent yielde potential)
Explanation: The leaching requirement can he calculated using equation (9) and
substituting the appropriate Eee value for the desired yield
potential (from Table 4).
EC 1.2
0.10 (for a 90 percentLR w
(9
5(EC ) - EC 5(2.5) - 1.2 yield potential)e w
LR
1.2
0.16 (for a 100 percent yield potential)
5(1.7) 1.2
The actual amount of water to he applied to supply both crop ET and
leaching (long-term salt control) can be found by using equation (7)
AW
ET
1 - LR
800
1 0.10
890 rom/season (7
Since a 1230 mm depth of applied water is needed to ensure that the maize crop is
adequately irrigated to meet the 800 rom ET demand and, since this 1230 rom is in
excess of the calculated depth of 890 mm required to meet both crop E1' demand and
the leaching requirement, the question arises whether the losses in excess of ET are
deep percolatiqn losses and whether these losses may be satisfying the leaching
requirement. Water losses due to deep percolation are often greatly in excess of the
leaching fraction of 0.15 assumed in the crop tolerance tables (Table 4) as being
typical of efficient irrigated agriculture. If, in this example, the losses are due
to deep percolation, no additional leaching to control salinity is necessary since
the required leaching fraction of 0.10 or 0.16, as calculated above, will be
satisfied by irrigation inefficiency (losses) during water application.
- 27 -
Rainfall must be considered in estimating the leaching require-
ment. Rainfall that enters the soil is effective in meeting both
crop ET and the leaching requirement. Rainfall that infiltrates
into the soil (effective rainfall) replaces ET losses. If in
excess of ET, it becomes drainage water and will satisfy part or
all of the leaching needed to control salts. The advantage of
rainfall in accomplishing all or part of the leaching is that it
uniformly applies an almost salt-free water (ECw < 0.05 dS/m).
Leaching is further enhanced if the rate of rainfall is below
the infiltration rate of the soil. If the total amount of rain-
fall infiltrated is sufficient, it will reduce the average
salinity used for the applied water (ECw) in calculating the
leaching requirement (LR) and thus reduce proportionately the
required leaching. Figure 8 shows how rainfall quickly ~educes
the salinity in the crop root zone.
In low rainfall years or low rainfall areas, precipitation may
not be adequate to refill the soil to its water holding capa-
city, in which case no leaching occurs to reduce accumulated
salinity other than to move the salts from the upper part of the
root zone deeper into the soil. The upper portions of the root-
ing depth will then reflect the very low salinity levels of the
rainfall which can enhance germination.
In areas where rainfall occurs in the cooler months or winter
season, it may be possible to enhance winter leaching even in a
dry year. It is recommended that a heavy autumn or early winter
irrigation be given to refill the soil profile with water before
the rains. Winter rains will then complete the soil-water re-
plenishment and accomplish all or part of the required leaching
with low-salt water. If the rewetting or leaching is still not
complete by crop planting time, the deep percolation losses from
extended early season irrigations may accomplish the soil rewet-
ting and salt leaching. Figure 9 shows how winter rains have
leached salts from citrus p~antings in Cyprus.
The leaching requirement can be calculated (Equation 9) but we
can only make estimates of the amount of leaching that is actu-
ally taking place. Soil and crop monitoring are useful tools to
determine the need for leaching. Considerable variation occurs
from one cropping season to the next; therefore, monitoring
should stress long-term trends and changes in soil salinity.
Several studies, field trials and observations suggest proce-
dures that might increase the efficiency of leaching and reduce
the amount of water needed. These will not be covered in detail
here but will be mentioned as they apply to many irrigation
situations:
leach during the cool season instead of the warm to
increase the efficiency and ease of leaching since the ET
losses are lower;
use more salt tolerant crops which require a lower LR and
thus a lower total water demand;
use tillage to slow overland water flow and reduce the
number of surface cracks which bypass flow through large
pores and decrease efficiency in leaching;
use sprinkler irrigation at an application rate below the
soil infiltration rate which favours unsaturated flow
which is appreciably more efficient than saturated flow
20
40
60
E
~
80
E-m
~
100
120
140
160
ECe (dS/ml
2 3 4 5
- 28 -
25
50
75
E 100
.::
~
c.
~ 125
150
175
200
225
ECe (dSlm)
2 3 4
P,
I I
I I
I I
I I
~~
I I
I I
N, I
,,
~~, I A~ter
wmter
, I rainfall
q~


•~
 '
 '
h..,~
'..
S""
5
0---09/
o n
C>- __ <)
0---00
Fig. 8 Soil salinity (ECe) of a
sandy-loam soil before
and after 150 mm of
rainfall (Aziz 1968)
Fig. 9 Soil salinity (ECe) profiles at th
end of the irrigation season an
after winter rainfall in citru
plantings (Stylianou 1970
for leaching. More irrigation time but less water i
required than for continuous ponding (Oster et al. 1972)
use alternate ponding and drying instead of continuou
ponding. More efficient in leaching (Oster et al. 1972
and uses less water but the time required to leach i
greater. May have drawbacks in areas with a high wate
table which allows secondary salinization betwee
pondings;
where possible, schedule leachings at periods of low cro
water use or postpone leachings until after the croppin
season;
avoid fallow periods particularly during hot summer
where rapid secondary soil salinization from high wate
tables can occur;
if infiltration rates are low, consider pre-plantin
irrigations or off-season leaching to avoid excessiv
water applications during the crop season,
- '29 -
use an irrigation before the start of the rainy season if
total rainfall is normally expected to be insufficient to
do a complete leaching. Rainfall is often the most effi-
cient leaching method because it provides high quality
water at relatively low rates of application.
iii. Monitoring
A good irrigation management plan strives to apply sufficient
water to meet the crop water demand plus the leaching require-
ment without wastage. Both the crop water demand and leaching
requirement can be estimated and the depth of applied water
needed can be calculated. In many instances, however, estimates
of depth of applied water (flow rate, duration and area covered)
are inaccurate or not available, making estimates of effective-
ness of leaching for salinity control unreliable. Existing
conditions and reliable estimates of past management can be
determined with a reasonable degree of certainty by means of
soil samples, analysed for salinity. From the soil samples an
apparent leaching fraction as well as an average root zone
salinity resulting from past irrigation practices can be
determined.
The following procedure is suggested:
a. Estimate the probable depth of rooting of the last crop
grown - from observation (pit, hole, soil samples, etc.),
or from past experience. Depth estimate should include 75
to 85 percent of the observed root zone.
b. Take representative soil samples from each quarter depth of
root zone and analyse each quarter depth separately for ECe
by the soil paste extraction method of the US Salinity
Laboratory (USDA 1954).
c. Plot by a graph similar to that of Figure 2 for the soil
depth and salinity representative of each quarter depth of
root zone and compare this curve with the curves depicting
the various typical leaching fractions (LF = 0.1, 0.15,
0.2, 0.3, 0.4) in the graph. Then, estimate a leaching
fraction for the site sampled based on the shape of the
salinity profile.
d. From the ECe of the four soil samples (one from each
quarter depth of the root zone) calculate the average root
zone salinity and compare with the crop tolerance ECe
values in Table 4 for the crops to be planted.
e. From the apparent leaching fraction and the average ECe of
the root zone, make any necessary management decisions to
adj ust irrigations to increase or decrease the leaching
fraction in order to stay close to the tolerance of the
preferred crop. Alternatively, change the crop to agree
more closely with the existing salinity conditions.
2.4.3 Crop Tolerance to Salinity
All plants do not respond to salinity in a similar manner; some
crops can produce acceptable yields at much greater soil salinity than
others. This is because some are better able to make the needed osmotic
adjustments enabling them to extract more water from a saline soil. The
- 30 -
ability of the crop to adjust to salinity is extremely useful. In areas
where a build-up of soil salinity cannot be controlled at an acceptable
concentration for the crop being grown, an alternative crop can be
selected that is both more tolerant of the expected soil salinity and
can produce economical yields.
There is an 8 to 10-fold range in salt tolerance of agricultural
crops. This wide range in tolerance allows for a much greater use of
moderately saline water much of which was previously thought to be
unusable. It also greatly expands the acceptable range of water
salinity (ECw) considered suitable for irrigation.
The relative salt tolerance of most agricultural crops is known
well enough to give general salt tolerance g~idelines. Tolerances for
many common field, vegetable, forage and tree crops are given in Table
4. This table has been updated from the 1976 edition and gives the
latest tolerance values for crops grown under semi-arid irrigated
agriculture. Where insufficient data exist to give numerical values for
tolerance, a relative rating has been assigned~ to the crop, based on
field experience, limited data or observations. For comparative
purposes, relative tolerance ratings are listed in Table 5 for a large
number of crops, including many of those given in Table 4. General
groupings for tolerance are shown in the schematic diagram in Figure
10. The relative tolerance ratings, even if based on a limited amoun
of data, are useful for comparisons among crops.
The relative crop tolerance ratings were considered in setting
the degrees of 'restriction on use' in the guidelines of Table 1. For
example, the tolerance data of Table 4 indicate that a full yield
potential should be obtainable for nearly all crops when using a water
which has a salinity less than 0.7 dS/m. The guidelines of Table 1
indicate that water of this salinity would have no restriction on use.
For the salinity listed in the slight to moderate range, a full yield
potential is still possible but care must be taken to achieve the
required leaching fraction in order to maintain soil salinity wi thin
the tolerance of the crop. For higher salinity water and sensitive
crops, increasing the leaching to satisfy a leaching requirement
greaster than 0.25-0.30 may not be practical because of the excessive
amount of water required. In such a case, consideration must be given
to changing to a more tolerant crop that will require less leaching to
control salts within crop tolerance. As the water salinity (ECw)
increases within the slight to moderate range, production of the more
sensitive crops may be restricted due to an inability to achieve the
high leaching fraction needed, especially when grown on the heavier,
more clayey soil types. If the salinity of the applied water exceeds
3.0 dS/m, as shown in Table 1 for a severe restriction on use, the
water may still be usable but its use may need to be restricted to more
permeable soils and more salt tolerant crops where the high leaching
fractions are more easily achieved.
The salt tolerance data of Table 4 are used in the calculation
of the leaching requirement. Figure 7 can also be used to estimate the
leaching requirement if crop tolerance grouping and water salinity are
known, as discussed in the previous section. If the exact cropping
patterns or rotations are not known for a new area, the leaching
requirement must be based on the least tolerant of the crops adapted to
the area. In those instances where soil salinity cannot be maintained
within acceptable limits of preferred sensitive crops, changing to more
tolerant crops will raise the area's production potential. In case of
doubt as to the effect of the water salinity on crop production, a
pilot study should be undertaken to demonstrate the feasibility for
irrigation and the outlook for economic success.
0%
FIELD CROPS 100% 90% 75% 50% "maximum" 3
EC EC EC EC EC EC EC EC EC EC
e w e w e w e w e w
Barley {Hordewn vulgCll'eJ 4 8.0 5.3 10 6.7 13 8.7 18 12 28 19
Cotton {Gossypium hirsutwn} 7.7 5.1 9.6 6.4 13 8.4 17 12 27 18
Sugarbeet (Beta vulgaris) 5 7.0 4.7 8.7 5.8 11 7.5 15 10 24 16
Sorghum (Sorghum bicolor) 6.8 4.5 7.4 5.0 8.4 5.6 9.9 6.7 13 8.7
Wheat (Triticum aestivum) 4,6 6.0 4.0 7.4 4.9 9.5 6.3 13 8.7 20 13
Wheat, durum (TritirYo-im turgidwn) 5.7 3.8 7.6 5.0 10 6.9 15 10 24 16
Soybean (Glycine max) 5.0 3.3 5.5 3.7 6.3 4.2 7.5 5.0 10 6.7
Cowpea (Vigna unguiculata) 4.9 3.3 5.7 3.8 7.0 4.7 9.1 6.0 13 8.8
Groundnut (Peanut) 3.2 2.1 3.5 2.4 4.1 2.7 4.9 3.3 6.6 4.4
(Arachis hypogaea)
Rice (paddy) fOriza sativa) 3.0 2.0 3.8 2.6 5.1 3.4 7.2 4.8 11 7.6
Sugarcane (SaccharLun officincLPum) 1.7 1.1 3.4 2.3 5.9 4.0 10 6.8 19 12
Corn (maize) (Zea mays) 1.7 1.1 2.5 1.7 3.8 2.5 5.9 3.9 10 6.7
Flax (Limun usitatissimum) 1.7 1.1 2.5 1.7 3.8 2.5 5.9 3.9 10 6.7
Broadhean IVicia faba) 1.5 1.1 2.6 1.8 4.2 2.0 6.8 4.5 12 8.0
Bean (Phaseolus vulgaris) 1.0 0.7 1.5 1.0 2.3 1.5 3.6 2.4 6.3 4.2
VEGETABLE CROPS
Squash, zucchini (courgette) 4.7 3.1 5.8 3.8 7.4 4.9 10 6.7 15 10
(Cuc:urbita pepo melopepo)
Beet, red (Beta vulgaris) 5 4.0 2.7 5.1 3.4 6.8 4.5 9.6 6.4 15 10
Squash, scallop 3.2 2.1 3.8 2.6 4.8 3.2 6.3 4.2 9.4 6.3
(Cuc:urbita pepo me lopepo)
Broccoli 2.8 1.9 3.9 2.6 5.5 3.7 8.2 5.5 14 9.1
{Brassica oleracea botrytisJ
Tomato (Lycopel~sicon esculentwnJ 2.5 1.7 3.5 2.3 5.0 3.4 7.6 5.0 13 8.4
Cucumber (Cuaumis sativus) 2.5 1.7 3.3 2.2 4.4 2.9 6.3 4.2 10 6.8
Spinach (Spinacia oleracea) 2.0 1.3 3.3 2.2 5.3 3.5 8.6 5.7 15 10
Celery (Apium gl'aveo lens) 1.8 1.2 3.4 2.3 5.8 3.9 9.9 6.6 18 12
Cabbage 1.8 1.2 2.8 1.9 4.4 2.9 7.0 4.6 12 8.1
(Brassica oleracea capitata)
Potato (Solanum tt,beroswn) 1.7 1.1 2.5 1.7 3.8 2.5 5.9 3.9 10 6.7
Corn, sweet (maize) (Zea mays] L7 1.1 2.5 1.7 3.8 2.5 5.9 3.9 10 6.7
Sweet potato (Impomoea batatas) 1.5 1.0 2.4 1.6 3.8 2.5 6.0 4.0 11 7.1
Pepper (Capsienun annuum) 1.5 La 2.2 1.5 3.3 2.2 5.1 3.4 8.6 5.8
. Lettuce (Lacttlca sativa) 1.3 0.9 2.1 1.4 3.2 2.1 5.1 3.4 9.0 6.0
Radish (Raphanus sativus) 1.2 0.8 2.0 1.3 3.1 2.1 5.0 3.4 8.9 5.9
Onion IAni!Un cepa) 1.2 0.8 1.8 1.2 2.8 1.8 4.3 2.9 7.4 5.0
Carrot (Dccuents cal'ota) 1.0 0.7 1.7 1.1 2.8 1.9 4.6 3.0 8.1 5.4
Bean (Phaseolus vulgaJ.'is) La 0.7 1.5 1.0 2.3 1.5 3.6 2.4 6.3 4.2
Turnip (Brassica rapa) 0.9 0.6 2.0 1.3 3.7 2.5 6.5 4.3 12 8.0
Table 4
- 31 -
CROP TOLERANCE AND YIELD POTENTIAL OF SELECTED CROPS AS INFLUENCED BY
IRRIGATION WATER SAlINITY (EC ) OR SOIL SAlINITY (EC ) I
W e
Y I E L D POT E N T I A L2
Table 4 (continued)
- 32 -
Y I E L D POT E N T I A L
0%
FORAGE CROPS 100% 90% 75% 50% "maximum"
EC EC EC EC EC EC EC EC EC EC
e w e w e w e w e w
WheatgrasB, tall 7.5 5.0 9.9 6.6 13 9.0 19 13 31 21
(Agropyron e lOll{JatwnJ
WheatgrasB, fairway crested 7.5 5.0 9.0 6.0 II 7.4 15 9.B 22 15
(Agropyron cristatumJ
Bermuda grass ICynodan dactyZon) 7
6.9 4.6 B.5 5.6 II 7.2 15 9.B 23 15
Barley (forage) (Hordeum vulgare) Ii 6.0 4.0 7.4 4.9 9.5 6.4 13 B.7 20 13
RyegrasB, perennial (Lolium perenne) 5.6 3.7 6.9 4.6 B.9 5.9 12 B.l 19 13
Trefoil,oarrowleaf birdsfoot B
5.0 3.3 6.0 4.0 7.5 5.0 10 6.7 15 10
(Lotus 'coI'niaulatus tenui'foliwn)
Harding grass IPhaZaris tuherosaJ 4.6 3.1 5.9 3.9 7.9 5.3 II 7.4 IB 12
Fescue, tall (Festuca elatiorJ 3.9 2.6 5.5 3.6 7.B 5.2 12 7.B 20 13
Wheatgras8, standard crested 3.5 2.3 6.0 4.0 9.B 6.5 16 II 2B 19
(Agropyron sibiriauml
Vetch, common {Vioia angustifolial 3.0 2.0 3.9 2.6 5.3 3.5 7.6 5.0 12 B.l
Sudan grass rSorglrum Budanense} 2.B 1.9 5.1 3.4 B.6 5.7 14 9.6 26 17
Wildrye, beardless 2.7 l.B 4.4 2.9 6.9 4.6 II 7.4 19 13
(Elymus triti'coi'des)
Cowpea (forage) (Vigna ungui'culatal 2.5 1.7 3.4 2.3 4.B 3.2 7.1 4.B 12 7.B
Trefoil, big (Loms u'liginoBus) 2.3 1.5 2.B 1.9 3.6 2.4 4.9 3.3 7.6 5.0
Sesbania (Beabania exaltataJ 2.3 1.5 3.7 2.5 5.9 3.9 9.4 6.3 17 II
Sphaerophysa ISphaerophysa saZfJUZa) 2.2 1.5 3.6 2.4 5.B 3.B 9.3 6.2 16 II
Alfalfa (Medicago sativa) 2.0 1.3 3.4 2.2 5.4 3.6 B.B 5.9 16 10
LovegrasB (Eragrostis Sp.}9 2.0 1.3 3.2 2.1 5.0 3.3 B.O 5.3 14 9.3
Corn (forage) (maize) IZea mays) 1.B 1.2 3.2 2.1 5.2 3.5 B.6 5.7 15 10
Clover, berseem 1.5 1.0 3.2 2.2 5.9 3.9 10 6.B 19 13
(Trifolium alexandrint~)
Orchard grass (Dactylis glomerata) 1.5 1.0 3.1 2.1 5.5 3.7 9.6 6.4 IB 12
Foxtail, meadow 1.5 1.0 2.5 1.7 4.1 2.7 6.7 4.5 12 7.9
(Alopecuru6 pratensi"s)
Clover, red (Tl'ifolium pratense) 1.5 1.0 2.3 1.6 3.6 2.4 5.7 3.B 9.B 6.6
Clover, aleike ITrifoUwn hybridwnJ 1.5 1.0 2.3 1.6 3.6 2.4 5.7 3.B 9.B 6.6
Clover, ladino (TrifoliL~ repens) 1.5 1.0 2.3 1.6 3.6 2.4 5.7 3.B 9.B 6.6
Clover, strawberry 1.5 1.0 2.3 1.6 3.6 2.4 5.7 3.B 9.B 6.6
ITrifoUwn fragiferwn)
FRUIT CROps
lO
Date palm (Phoenix dactylifera) 4.0 2.7 6.B 4.5 II 7.3 IB 12 32 21
Grapefruit (Citrus paradisi) 11 I.B 1.2 2.4 1.6 3.4 2.2 4.9 3.3 B.O 5.4
Orange (Citrus sinensi's) 1.7 1.1 2.3 1.6 3.3 2.2 4.B 3.2 B.O 5.3
Peach (Prunus persica) 1.7 1.1 2.2 1.5 2.9 1.9 4.1 2.7 6.5 4.3
Apricot (Prunus armeniaca) 11 1.6 1.1 2.0 1.3 2.6 l.B 3.7 2.5 5.B 3.B
Grape (Vitus Sp.}l1 1.5 1.0 2.5 1.7 4.1 2.7 6.7 4.5 12 7.9
Almond (PrunuB dulcis) 11 1.5 1.0 2.0 1.4 2.B 1.9 4.1 2.B 6.B 4.5
- 33 -
Table 4 (continued)
Y I B L D POT E N T I A L
10 These data are applicable when rootstocks are used that do not accumulate Na+ and Cl- rapidly
or when these ions do not predominate in the soil. If either ions do, refer to the toxicity
discussion in Section 4.
0%
FRUIT CROPS 10 100% 90% 75% 50% "maximum""
EC EC Bc EC BC EC BC EC EC BC
e w e w e w e w e w
Plum, prune (Prunus domestica) 11 1.5 1.0 2.1 1.4 2.9 1.9 4.3 2.9 7.1 4.7
Blackberry (Rubus 8p.) 1.5 1.0 2.0 1.3 2.6 1.8 3.8 2.5 6.0 4.0
Boysenberry (Rubus Ul~sinuB) 1.5 1.0 2.0 1.3 2.6 1.8 3.8 2.5 6.0 4.0
Strawberry (Fragar~a sp.) 1.0 0.7 1.3 0.9 1.8 1.2 2.5 1.7 4 2.7
2
4
7
1l
Adapted from Maas and Hoffman (1977) and Maas (1984). These data should only serve as a guide
to relative tolerances among crops. Absolute tolerances vary depending upon climate, soil
conditions and cultural practices. In gypsiferou6 soils, plants will tolerate about 2 dS/m
higher soil salinity (ECe) than indicated but the water salinity (ECw) will remain the same
8S shown in this table.
EGe means average root zone salinity as measured by electrical conductivity of the saturation
extract of the soil, reported in deciSiemens per metre (dS/m) at 25 D
C. ECw means electrical
conductivity of the irrigation water in deciSiemens per metre (dS/m). The relationship
between soil salinity and water salinity (ECe = 1.5 ECw) assumes a 15-20 percent leaching
fraction and a 40-30-20-10 percent water use pattern for the upper to lower quarters of the
root zone. These assumptions were used in developing the guidelines in Table 1.
The zero yield potential or maximum ECe indicates the theoretical soil saU.nity (ECe) at
which crop growth ceases.
Barley and wheat are less tolerant during germination and seedling stagej ECe should not
exceed 4-5 dS/m in the upper soil during this period.
Beets are more sensitive during germinationj ECe should not exceed 3 dS/m in the seeding area
for garden beets and sugar beets.
Semi-dwarf, short cultivars may be less tolerant.
Tolerance given is an average of several varietiesj Suwannee and Coastal Bermuda grass are
about 20 percent more tolerant, while Common and Greenfield Bermuda grass are about 20
percent less tolerant.
Broadleaf Birdsfoot Trefoil seems less tolerant than Narrowleaf Birdsfoot Trefoil.
Tolerance given is an average for Boer, Wilman, Sand and Weeping LovegraSBj Lehman Lovegras8
seems about 50 percent more tolerant.
Tolerance evaluation is based on tree growth and not on yield.
MODERATELY TOLERANT' MODERATELY SENSITIVE'
RELATIVE SALT TOLERANCE OF AGRICULTURAL CROPS ','
Grasses and Forage Crops
Helianthus tuberoaua
Beta vulgcuis
Cucurbita pepo
melopepo
Ficus carica
Ziziphus jujuba
Olea europaea
CQ1~ica papaya
Ananas comosus
Punica grananun
Vioia faba
Ricinus comrmmis
Zea mays
Lbnun usitatissimwn
Setaria italica
Apachis hypogaea
Ol~yza sativa
Saccarwn officinarlun
He liantlms annuus
Medicago sativa
Agrostis stolonifel~
palustris
Dicl-zanthilun aristatlu
Brorrrus inermis
Cenchrus ciliaria
Potel~ium sanguisorba
Trifolium hydJ~idlun
Trifoli~un alexandrim
Tl~ifolilun repens
Tl'ifoliwn pratense
Trifolizun fl'agifeT'lun
Trifolil~ repens
Zea mays
Vigna unguiculata
Paspalum di latanll7l
Alopecurus pratensis
BOHtelollQ gracilis
Eragrostis sp.
Astl~agalus cicer
Al'rhel1atherL~..
Danthonia
Avena sativa
Agl~opY1"On intermediw
Agropyron trachycaul
Agropyron smithii
Elymus tr{ ticoides
Elyrm18 canadcmeis
Bluestem, Angleton
Brome, smooth
Buffelgrass
Burnet
Clover. alsike
Clover, Berseem
Clover. ladino
Clover, red
Clover, strawberry
Clover. white Dutch
Corn (forage) (maize)
Cowpea (forage)
Dallia grass
Foxtail, meadow
Grama, blue
Lovegrass
Milkvetch, Cicer
Oatgrass, tall
Oats (forage)
Alfalfa
Bentgrass
Grasses and Forage Crops
Broadbean
Cas torbean
Maize
Flax
Millet, foxtail
Groundnut/Peanut
Rice, paddy
Sugarcane
Sunflower
Fibre, Seed and Sugar Crops
Fruit and Nut Crops
Fig
Jujube
Olive
Papaya
Pineapple
Pomegranate
Vegetable Crops
Artichoke
Beet, red
Squash, zucchini
Wheatgrass,
intermediate
Wheatgrass, slender
Wheatgrass, western
Wildrye, beardless
Wildrye, Canadian
Grasses and Forage Crops
MODEIlATIliY TOLERANT
~ 34 -
Hordeum vulgcu'e
Brormts ma1'ginatlls
Phalaria.. aT'lmdinacea
MelilotllS alba
Melilonts
Festllca plutensis
Fesiluca elatior
Phalaris tilberosa
Fani'cllln antidotale
Brasei'ca napus
Bromus unioloides
Chloris gayarza
Lolil~ italicuIrI
rmlltiflorwn
Lolilun perenne
Sorghum suclal'lense
Lonls cornivulants
tenuifolilun
Lotus corn,ieulatits
arveni-s
Triti(!/.un aestivlun
Agropyron sibil'icwn
Asparagus offi'cinalis
Vigna unguieulata
Avena sativa
Secale cel~eale
CaI'thamus tinctorius
Sorghwn bicolor
Glycine max
X Tri'ticosecale
Triticum aestiv~vn
Tri'tiewn nlT'g1:awn
Hordeum vulgCU'e
GOBsypiulTI hil~SUhun
Sirrunoruisia chinensis
Beta vulgaJ.~is
AgropYl~on elongatlLlm
Elymus angustlls
Elyrmw junceus
Sugar Crops
Sugar Crops
Ryegrass, perennial
Sudan grass
Trefoil, narrowleaf
birdsfoot
Trefoil. broadleaf
birdsfoot
Wheat (forage)
Wheatgrass,
standard crested
Barley (forage)
Brame. mountain
Canary grass, reed
Clover, Hubam
Clover, sweet
Fescue, meadow
Fescue. tall
Harding grass
Panic grass. blue
Rape
Rescue grass
Rhodes grass
RyegrasB. Italian
Fibre. Seed and
Cowpea
Oats
Rye
Safflower
Sorghum
Soybean
Triticale
Wheat
Wheat, Durum
TOLER.ANT3
Vegetable Crops
Asparagus
Barley
Cotton
Jojoba
Sugarbeet
Fruit and Nut Crops
Date palm Phoenix dactylifel~a
Grasses and Forage Crops
Alkali grass, Nuttall Alccinellia airoides
Alkali sacaton Sporobolu8 ai17
0ides
Bermuda grass Cynodon dactylon
Kallar grass Diplachne fusca
Saltgras6, desert DistichZis stricta
Wheatgrass, Ag17
opyron cristatum
fairway crested
WbeatgrasB) tall
Wildrye, Altai
Wildrye, Russian
Fibre, Seed and
Table 5
Calidad del agua para agricultura fao 29-ayers y westcot 1985-oki

More Related Content

What's hot

Water - The essential resource
Water - The essential resourceWater - The essential resource
Water - The essential resourceKASHIF SHABBIR
 
Spatial water quality variations of DMMMSU-NLUC watershed and citizens’ aware...
Spatial water quality variations of DMMMSU-NLUC watershed and citizens’ aware...Spatial water quality variations of DMMMSU-NLUC watershed and citizens’ aware...
Spatial water quality variations of DMMMSU-NLUC watershed and citizens’ aware...Jomar Aban
 
JBES| Water quality and socio-demographic assessment of Mahuganao Stream: inp...
JBES| Water quality and socio-demographic assessment of Mahuganao Stream: inp...JBES| Water quality and socio-demographic assessment of Mahuganao Stream: inp...
JBES| Water quality and socio-demographic assessment of Mahuganao Stream: inp...Innspub Net
 
762019125
762019125762019125
762019125IJRAT
 
Water Quality Assessment through GIS: A Case Study of Sukhna Lake, Chandigarh...
Water Quality Assessment through GIS: A Case Study of Sukhna Lake, Chandigarh...Water Quality Assessment through GIS: A Case Study of Sukhna Lake, Chandigarh...
Water Quality Assessment through GIS: A Case Study of Sukhna Lake, Chandigarh...IRJET Journal
 
Water Quality Data Management and Analysis
Water Quality Data Management and AnalysisWater Quality Data Management and Analysis
Water Quality Data Management and AnalysisThe Watershed Institute
 
IRJET- A Seasonal Assessment of Groundwater Quality in Dharmapuri Region
IRJET- A Seasonal Assessment of Groundwater Quality in Dharmapuri RegionIRJET- A Seasonal Assessment of Groundwater Quality in Dharmapuri Region
IRJET- A Seasonal Assessment of Groundwater Quality in Dharmapuri RegionIRJET Journal
 
TERATOLOGICAL DIATOM DEFORMITIES IN THE PERIPHYTON OF COLORADO ALPINE STREAMS...
TERATOLOGICAL DIATOM DEFORMITIES IN THE PERIPHYTON OF COLORADO ALPINE STREAMS...TERATOLOGICAL DIATOM DEFORMITIES IN THE PERIPHYTON OF COLORADO ALPINE STREAMS...
TERATOLOGICAL DIATOM DEFORMITIES IN THE PERIPHYTON OF COLORADO ALPINE STREAMS...Ellie Muhr
 
Water quality & its guidelines
 Water quality & its guidelines  Water quality & its guidelines
Water quality & its guidelines Govinda Rokka
 
IRJET- Irrigation Water Quality: A Case Study of Khadki Nala Basin, Mangalwed...
IRJET- Irrigation Water Quality: A Case Study of Khadki Nala Basin, Mangalwed...IRJET- Irrigation Water Quality: A Case Study of Khadki Nala Basin, Mangalwed...
IRJET- Irrigation Water Quality: A Case Study of Khadki Nala Basin, Mangalwed...IRJET Journal
 
Guanabara bay qmra final
Guanabara bay qmra finalGuanabara bay qmra final
Guanabara bay qmra finalDaman Baidwan
 
Project proposal for assessment of water quality index for Karnaphuli river t...
Project proposal for assessment of water quality index for Karnaphuli river t...Project proposal for assessment of water quality index for Karnaphuli river t...
Project proposal for assessment of water quality index for Karnaphuli river t...Zobayer Taki
 
Water Quality and Sediment Analysis of Selected Rivers at Satara District, Ma...
Water Quality and Sediment Analysis of Selected Rivers at Satara District, Ma...Water Quality and Sediment Analysis of Selected Rivers at Satara District, Ma...
Water Quality and Sediment Analysis of Selected Rivers at Satara District, Ma...ijtsrd
 
Water Quality Assessment Powerpoint Presentation Slides
Water Quality Assessment Powerpoint Presentation SlidesWater Quality Assessment Powerpoint Presentation Slides
Water Quality Assessment Powerpoint Presentation SlidesSlideTeam
 
Comparative Analysis of Physicochemical Parameters and Heavy Metals of Public...
Comparative Analysis of Physicochemical Parameters and Heavy Metals of Public...Comparative Analysis of Physicochemical Parameters and Heavy Metals of Public...
Comparative Analysis of Physicochemical Parameters and Heavy Metals of Public...iosrjce
 
Impact of Locating Boreholes Near Septic Tanks Pit Latrines on Drinking Water...
Impact of Locating Boreholes Near Septic Tanks Pit Latrines on Drinking Water...Impact of Locating Boreholes Near Septic Tanks Pit Latrines on Drinking Water...
Impact of Locating Boreholes Near Septic Tanks Pit Latrines on Drinking Water...ijtsrd
 
Water quality and sampling
Water quality and samplingWater quality and sampling
Water quality and samplingJasmine John
 

What's hot (20)

Water - The essential resource
Water - The essential resourceWater - The essential resource
Water - The essential resource
 
C1803061620
C1803061620C1803061620
C1803061620
 
Spatial water quality variations of DMMMSU-NLUC watershed and citizens’ aware...
Spatial water quality variations of DMMMSU-NLUC watershed and citizens’ aware...Spatial water quality variations of DMMMSU-NLUC watershed and citizens’ aware...
Spatial water quality variations of DMMMSU-NLUC watershed and citizens’ aware...
 
JBES| Water quality and socio-demographic assessment of Mahuganao Stream: inp...
JBES| Water quality and socio-demographic assessment of Mahuganao Stream: inp...JBES| Water quality and socio-demographic assessment of Mahuganao Stream: inp...
JBES| Water quality and socio-demographic assessment of Mahuganao Stream: inp...
 
762019125
762019125762019125
762019125
 
Water Quality Assessment through GIS: A Case Study of Sukhna Lake, Chandigarh...
Water Quality Assessment through GIS: A Case Study of Sukhna Lake, Chandigarh...Water Quality Assessment through GIS: A Case Study of Sukhna Lake, Chandigarh...
Water Quality Assessment through GIS: A Case Study of Sukhna Lake, Chandigarh...
 
Water Quality Data Management and Analysis
Water Quality Data Management and AnalysisWater Quality Data Management and Analysis
Water Quality Data Management and Analysis
 
IRJET- A Seasonal Assessment of Groundwater Quality in Dharmapuri Region
IRJET- A Seasonal Assessment of Groundwater Quality in Dharmapuri RegionIRJET- A Seasonal Assessment of Groundwater Quality in Dharmapuri Region
IRJET- A Seasonal Assessment of Groundwater Quality in Dharmapuri Region
 
Dubai_brochure
Dubai_brochureDubai_brochure
Dubai_brochure
 
TERATOLOGICAL DIATOM DEFORMITIES IN THE PERIPHYTON OF COLORADO ALPINE STREAMS...
TERATOLOGICAL DIATOM DEFORMITIES IN THE PERIPHYTON OF COLORADO ALPINE STREAMS...TERATOLOGICAL DIATOM DEFORMITIES IN THE PERIPHYTON OF COLORADO ALPINE STREAMS...
TERATOLOGICAL DIATOM DEFORMITIES IN THE PERIPHYTON OF COLORADO ALPINE STREAMS...
 
Water quality & its guidelines
 Water quality & its guidelines  Water quality & its guidelines
Water quality & its guidelines
 
IRJET- Irrigation Water Quality: A Case Study of Khadki Nala Basin, Mangalwed...
IRJET- Irrigation Water Quality: A Case Study of Khadki Nala Basin, Mangalwed...IRJET- Irrigation Water Quality: A Case Study of Khadki Nala Basin, Mangalwed...
IRJET- Irrigation Water Quality: A Case Study of Khadki Nala Basin, Mangalwed...
 
Guanabara bay qmra final
Guanabara bay qmra finalGuanabara bay qmra final
Guanabara bay qmra final
 
Project proposal for assessment of water quality index for Karnaphuli river t...
Project proposal for assessment of water quality index for Karnaphuli river t...Project proposal for assessment of water quality index for Karnaphuli river t...
Project proposal for assessment of water quality index for Karnaphuli river t...
 
Silent Spring Study on Drinking Water
Silent Spring Study on Drinking WaterSilent Spring Study on Drinking Water
Silent Spring Study on Drinking Water
 
Water Quality and Sediment Analysis of Selected Rivers at Satara District, Ma...
Water Quality and Sediment Analysis of Selected Rivers at Satara District, Ma...Water Quality and Sediment Analysis of Selected Rivers at Satara District, Ma...
Water Quality and Sediment Analysis of Selected Rivers at Satara District, Ma...
 
Water Quality Assessment Powerpoint Presentation Slides
Water Quality Assessment Powerpoint Presentation SlidesWater Quality Assessment Powerpoint Presentation Slides
Water Quality Assessment Powerpoint Presentation Slides
 
Comparative Analysis of Physicochemical Parameters and Heavy Metals of Public...
Comparative Analysis of Physicochemical Parameters and Heavy Metals of Public...Comparative Analysis of Physicochemical Parameters and Heavy Metals of Public...
Comparative Analysis of Physicochemical Parameters and Heavy Metals of Public...
 
Impact of Locating Boreholes Near Septic Tanks Pit Latrines on Drinking Water...
Impact of Locating Boreholes Near Septic Tanks Pit Latrines on Drinking Water...Impact of Locating Boreholes Near Septic Tanks Pit Latrines on Drinking Water...
Impact of Locating Boreholes Near Septic Tanks Pit Latrines on Drinking Water...
 
Water quality and sampling
Water quality and samplingWater quality and sampling
Water quality and sampling
 

Similar to Calidad del agua para agricultura fao 29-ayers y westcot 1985-oki

Determination-Of-Sources-Of-Water-Pollution
Determination-Of-Sources-Of-Water-PollutionDetermination-Of-Sources-Of-Water-Pollution
Determination-Of-Sources-Of-Water-PollutionCOLLINS KUFFOUR
 
Evaluation of water quality index in the main drain river
Evaluation of water quality index in the main drain riverEvaluation of water quality index in the main drain river
Evaluation of water quality index in the main drain riverAlexander Decker
 
Water Quality and Productivity Enhancement in an Irrigated River Basin throug...
Water Quality and Productivity Enhancement in an Irrigated River Basin throug...Water Quality and Productivity Enhancement in an Irrigated River Basin throug...
Water Quality and Productivity Enhancement in an Irrigated River Basin throug...National Institute of Food and Agriculture
 
Suitability Assessment of Shallow Groundwater of a Typical Coastal Aquifers f...
Suitability Assessment of Shallow Groundwater of a Typical Coastal Aquifers f...Suitability Assessment of Shallow Groundwater of a Typical Coastal Aquifers f...
Suitability Assessment of Shallow Groundwater of a Typical Coastal Aquifers f...iosrjce
 
Effect of Salt and Water Stresses on Jujube Trees under Ras Sudr Conditions
Effect of Salt and Water Stresses on Jujube Trees under Ras Sudr ConditionsEffect of Salt and Water Stresses on Jujube Trees under Ras Sudr Conditions
Effect of Salt and Water Stresses on Jujube Trees under Ras Sudr Conditionsiosrjce
 
Macedo et al (2015)-Irrigation Groundwater Quality for Agricultural Use
Macedo et al (2015)-Irrigation Groundwater Quality for Agricultural UseMacedo et al (2015)-Irrigation Groundwater Quality for Agricultural Use
Macedo et al (2015)-Irrigation Groundwater Quality for Agricultural UseJenkins Macedo
 
Waterquality 120507145656-phpapp01
Waterquality 120507145656-phpapp01Waterquality 120507145656-phpapp01
Waterquality 120507145656-phpapp01MAHMUDUL KARIM
 
Water Pollution Control for Mandalay KanDawGyi Lake by Natural Treatment System
Water Pollution Control for Mandalay KanDawGyi Lake by Natural Treatment SystemWater Pollution Control for Mandalay KanDawGyi Lake by Natural Treatment System
Water Pollution Control for Mandalay KanDawGyi Lake by Natural Treatment Systemijtsrd
 
To Study the Effect of Municipal Treated Effluent on Groundwater Quality Near...
To Study the Effect of Municipal Treated Effluent on Groundwater Quality Near...To Study the Effect of Municipal Treated Effluent on Groundwater Quality Near...
To Study the Effect of Municipal Treated Effluent on Groundwater Quality Near...IRJET Journal
 
IRJET - Underground Water Recharge through Rainwater Harvesting using Rem...
IRJET -  	  Underground Water Recharge through Rainwater Harvesting using Rem...IRJET -  	  Underground Water Recharge through Rainwater Harvesting using Rem...
IRJET - Underground Water Recharge through Rainwater Harvesting using Rem...IRJET Journal
 
Environmental risk assessment of Macabalan creek water in Cagayan de Oro, Phi...
Environmental risk assessment of Macabalan creek water in Cagayan de Oro, Phi...Environmental risk assessment of Macabalan creek water in Cagayan de Oro, Phi...
Environmental risk assessment of Macabalan creek water in Cagayan de Oro, Phi...Innspub Net
 
Testing The Waters Water Quality Testing Session
Testing The Waters   Water Quality Testing SessionTesting The Waters   Water Quality Testing Session
Testing The Waters Water Quality Testing SessionDane George
 
Desalination and Water Recycling through Aquaporin - A composite power point ...
Desalination and Water Recycling through Aquaporin - A composite power point ...Desalination and Water Recycling through Aquaporin - A composite power point ...
Desalination and Water Recycling through Aquaporin - A composite power point ...Karthik Raman
 
Desalination and water reuse Norredine Ghaffour
Desalination and water reuse Norredine GhaffourDesalination and water reuse Norredine Ghaffour
Desalination and water reuse Norredine GhaffourWANA forum
 
EVALUATION OF GROUNDWATER QUALITY OF VAIPPAR BASIN, TAMIL NADU, INDIA: A GEOI...
EVALUATION OF GROUNDWATER QUALITY OF VAIPPAR BASIN, TAMIL NADU, INDIA: A GEOI...EVALUATION OF GROUNDWATER QUALITY OF VAIPPAR BASIN, TAMIL NADU, INDIA: A GEOI...
EVALUATION OF GROUNDWATER QUALITY OF VAIPPAR BASIN, TAMIL NADU, INDIA: A GEOI...SagarChougule11
 

Similar to Calidad del agua para agricultura fao 29-ayers y westcot 1985-oki (20)

Determination-Of-Sources-Of-Water-Pollution
Determination-Of-Sources-Of-Water-PollutionDetermination-Of-Sources-Of-Water-Pollution
Determination-Of-Sources-Of-Water-Pollution
 
Evaluation of water quality index in the main drain river
Evaluation of water quality index in the main drain riverEvaluation of water quality index in the main drain river
Evaluation of water quality index in the main drain river
 
Water Quality and Productivity Enhancement in an Irrigated River Basin throug...
Water Quality and Productivity Enhancement in an Irrigated River Basin throug...Water Quality and Productivity Enhancement in an Irrigated River Basin throug...
Water Quality and Productivity Enhancement in an Irrigated River Basin throug...
 
Suitability Assessment of Shallow Groundwater of a Typical Coastal Aquifers f...
Suitability Assessment of Shallow Groundwater of a Typical Coastal Aquifers f...Suitability Assessment of Shallow Groundwater of a Typical Coastal Aquifers f...
Suitability Assessment of Shallow Groundwater of a Typical Coastal Aquifers f...
 
H012615560
H012615560H012615560
H012615560
 
Effect of Salt and Water Stresses on Jujube Trees under Ras Sudr Conditions
Effect of Salt and Water Stresses on Jujube Trees under Ras Sudr ConditionsEffect of Salt and Water Stresses on Jujube Trees under Ras Sudr Conditions
Effect of Salt and Water Stresses on Jujube Trees under Ras Sudr Conditions
 
Ijciet 10 02_018
Ijciet 10 02_018Ijciet 10 02_018
Ijciet 10 02_018
 
Water quality
Water qualityWater quality
Water quality
 
Macedo et al (2015)-Irrigation Groundwater Quality for Agricultural Use
Macedo et al (2015)-Irrigation Groundwater Quality for Agricultural UseMacedo et al (2015)-Irrigation Groundwater Quality for Agricultural Use
Macedo et al (2015)-Irrigation Groundwater Quality for Agricultural Use
 
Waterquality 120507145656-phpapp01
Waterquality 120507145656-phpapp01Waterquality 120507145656-phpapp01
Waterquality 120507145656-phpapp01
 
Water Pollution Control for Mandalay KanDawGyi Lake by Natural Treatment System
Water Pollution Control for Mandalay KanDawGyi Lake by Natural Treatment SystemWater Pollution Control for Mandalay KanDawGyi Lake by Natural Treatment System
Water Pollution Control for Mandalay KanDawGyi Lake by Natural Treatment System
 
To Study the Effect of Municipal Treated Effluent on Groundwater Quality Near...
To Study the Effect of Municipal Treated Effluent on Groundwater Quality Near...To Study the Effect of Municipal Treated Effluent on Groundwater Quality Near...
To Study the Effect of Municipal Treated Effluent on Groundwater Quality Near...
 
IRJET - Underground Water Recharge through Rainwater Harvesting using Rem...
IRJET -  	  Underground Water Recharge through Rainwater Harvesting using Rem...IRJET -  	  Underground Water Recharge through Rainwater Harvesting using Rem...
IRJET - Underground Water Recharge through Rainwater Harvesting using Rem...
 
Environmental risk assessment of Macabalan creek water in Cagayan de Oro, Phi...
Environmental risk assessment of Macabalan creek water in Cagayan de Oro, Phi...Environmental risk assessment of Macabalan creek water in Cagayan de Oro, Phi...
Environmental risk assessment of Macabalan creek water in Cagayan de Oro, Phi...
 
Environmental risk assessment of Macabalan creek water in Cagayan de Oro, Phi...
Environmental risk assessment of Macabalan creek water in Cagayan de Oro, Phi...Environmental risk assessment of Macabalan creek water in Cagayan de Oro, Phi...
Environmental risk assessment of Macabalan creek water in Cagayan de Oro, Phi...
 
Testing The Waters Water Quality Testing Session
Testing The Waters   Water Quality Testing SessionTesting The Waters   Water Quality Testing Session
Testing The Waters Water Quality Testing Session
 
Desalination and Water Recycling through Aquaporin - A composite power point ...
Desalination and Water Recycling through Aquaporin - A composite power point ...Desalination and Water Recycling through Aquaporin - A composite power point ...
Desalination and Water Recycling through Aquaporin - A composite power point ...
 
Final EHS 428 Poster
Final EHS 428 PosterFinal EHS 428 Poster
Final EHS 428 Poster
 
Desalination and water reuse Norredine Ghaffour
Desalination and water reuse Norredine GhaffourDesalination and water reuse Norredine Ghaffour
Desalination and water reuse Norredine Ghaffour
 
EVALUATION OF GROUNDWATER QUALITY OF VAIPPAR BASIN, TAMIL NADU, INDIA: A GEOI...
EVALUATION OF GROUNDWATER QUALITY OF VAIPPAR BASIN, TAMIL NADU, INDIA: A GEOI...EVALUATION OF GROUNDWATER QUALITY OF VAIPPAR BASIN, TAMIL NADU, INDIA: A GEOI...
EVALUATION OF GROUNDWATER QUALITY OF VAIPPAR BASIN, TAMIL NADU, INDIA: A GEOI...
 

Recently uploaded

Artificial Intelligence In Microbiology by Dr. Prince C P
Artificial Intelligence In Microbiology by Dr. Prince C PArtificial Intelligence In Microbiology by Dr. Prince C P
Artificial Intelligence In Microbiology by Dr. Prince C PPRINCE C P
 
THE ROLE OF PHARMACOGNOSY IN TRADITIONAL AND MODERN SYSTEM OF MEDICINE.pptx
THE ROLE OF PHARMACOGNOSY IN TRADITIONAL AND MODERN SYSTEM OF MEDICINE.pptxTHE ROLE OF PHARMACOGNOSY IN TRADITIONAL AND MODERN SYSTEM OF MEDICINE.pptx
THE ROLE OF PHARMACOGNOSY IN TRADITIONAL AND MODERN SYSTEM OF MEDICINE.pptxNandakishor Bhaurao Deshmukh
 
Call Girls in Mayapuri Delhi 💯Call Us 🔝9953322196🔝 💯Escort.
Call Girls in Mayapuri Delhi 💯Call Us 🔝9953322196🔝 💯Escort.Call Girls in Mayapuri Delhi 💯Call Us 🔝9953322196🔝 💯Escort.
Call Girls in Mayapuri Delhi 💯Call Us 🔝9953322196🔝 💯Escort.aasikanpl
 
Harmful and Useful Microorganisms Presentation
Harmful and Useful Microorganisms PresentationHarmful and Useful Microorganisms Presentation
Harmful and Useful Microorganisms Presentationtahreemzahra82
 
Vision and reflection on Mining Software Repositories research in 2024
Vision and reflection on Mining Software Repositories research in 2024Vision and reflection on Mining Software Repositories research in 2024
Vision and reflection on Mining Software Repositories research in 2024AyushiRastogi48
 
Environmental Biotechnology Topic:- Microbial Biosensor
Environmental Biotechnology Topic:- Microbial BiosensorEnvironmental Biotechnology Topic:- Microbial Biosensor
Environmental Biotechnology Topic:- Microbial Biosensorsonawaneprad
 
Pests of soyabean_Binomics_IdentificationDr.UPR.pdf
Pests of soyabean_Binomics_IdentificationDr.UPR.pdfPests of soyabean_Binomics_IdentificationDr.UPR.pdf
Pests of soyabean_Binomics_IdentificationDr.UPR.pdfPirithiRaju
 
Call Girls in Munirka Delhi 💯Call Us 🔝9953322196🔝 💯Escort.
Call Girls in Munirka Delhi 💯Call Us 🔝9953322196🔝 💯Escort.Call Girls in Munirka Delhi 💯Call Us 🔝9953322196🔝 💯Escort.
Call Girls in Munirka Delhi 💯Call Us 🔝9953322196🔝 💯Escort.aasikanpl
 
Solution chemistry, Moral and Normal solutions
Solution chemistry, Moral and Normal solutionsSolution chemistry, Moral and Normal solutions
Solution chemistry, Moral and Normal solutionsHajira Mahmood
 
Scheme-of-Work-Science-Stage-4 cambridge science.docx
Scheme-of-Work-Science-Stage-4 cambridge science.docxScheme-of-Work-Science-Stage-4 cambridge science.docx
Scheme-of-Work-Science-Stage-4 cambridge science.docxyaramohamed343013
 
Pests of castor_Binomics_Identification_Dr.UPR.pdf
Pests of castor_Binomics_Identification_Dr.UPR.pdfPests of castor_Binomics_Identification_Dr.UPR.pdf
Pests of castor_Binomics_Identification_Dr.UPR.pdfPirithiRaju
 
TOPIC 8 Temperature and Heat.pdf physics
TOPIC 8 Temperature and Heat.pdf physicsTOPIC 8 Temperature and Heat.pdf physics
TOPIC 8 Temperature and Heat.pdf physicsssuserddc89b
 
STOPPED FLOW METHOD & APPLICATION MURUGAVENI B.pptx
STOPPED FLOW METHOD & APPLICATION MURUGAVENI B.pptxSTOPPED FLOW METHOD & APPLICATION MURUGAVENI B.pptx
STOPPED FLOW METHOD & APPLICATION MURUGAVENI B.pptxMurugaveni B
 
Microphone- characteristics,carbon microphone, dynamic microphone.pptx
Microphone- characteristics,carbon microphone, dynamic microphone.pptxMicrophone- characteristics,carbon microphone, dynamic microphone.pptx
Microphone- characteristics,carbon microphone, dynamic microphone.pptxpriyankatabhane
 
Call Us ≽ 9953322196 ≼ Call Girls In Lajpat Nagar (Delhi) |
Call Us ≽ 9953322196 ≼ Call Girls In Lajpat Nagar (Delhi) |Call Us ≽ 9953322196 ≼ Call Girls In Lajpat Nagar (Delhi) |
Call Us ≽ 9953322196 ≼ Call Girls In Lajpat Nagar (Delhi) |aasikanpl
 
Analytical Profile of Coleus Forskohlii | Forskolin .pptx
Analytical Profile of Coleus Forskohlii | Forskolin .pptxAnalytical Profile of Coleus Forskohlii | Forskolin .pptx
Analytical Profile of Coleus Forskohlii | Forskolin .pptxSwapnil Therkar
 
The dark energy paradox leads to a new structure of spacetime.pptx
The dark energy paradox leads to a new structure of spacetime.pptxThe dark energy paradox leads to a new structure of spacetime.pptx
The dark energy paradox leads to a new structure of spacetime.pptxEran Akiva Sinbar
 
‏‏VIRUS - 123455555555555555555555555555555555555555
‏‏VIRUS -  123455555555555555555555555555555555555555‏‏VIRUS -  123455555555555555555555555555555555555555
‏‏VIRUS - 123455555555555555555555555555555555555555kikilily0909
 
BREEDING FOR RESISTANCE TO BIOTIC STRESS.pptx
BREEDING FOR RESISTANCE TO BIOTIC STRESS.pptxBREEDING FOR RESISTANCE TO BIOTIC STRESS.pptx
BREEDING FOR RESISTANCE TO BIOTIC STRESS.pptxPABOLU TEJASREE
 

Recently uploaded (20)

Artificial Intelligence In Microbiology by Dr. Prince C P
Artificial Intelligence In Microbiology by Dr. Prince C PArtificial Intelligence In Microbiology by Dr. Prince C P
Artificial Intelligence In Microbiology by Dr. Prince C P
 
THE ROLE OF PHARMACOGNOSY IN TRADITIONAL AND MODERN SYSTEM OF MEDICINE.pptx
THE ROLE OF PHARMACOGNOSY IN TRADITIONAL AND MODERN SYSTEM OF MEDICINE.pptxTHE ROLE OF PHARMACOGNOSY IN TRADITIONAL AND MODERN SYSTEM OF MEDICINE.pptx
THE ROLE OF PHARMACOGNOSY IN TRADITIONAL AND MODERN SYSTEM OF MEDICINE.pptx
 
Call Girls in Mayapuri Delhi 💯Call Us 🔝9953322196🔝 💯Escort.
Call Girls in Mayapuri Delhi 💯Call Us 🔝9953322196🔝 💯Escort.Call Girls in Mayapuri Delhi 💯Call Us 🔝9953322196🔝 💯Escort.
Call Girls in Mayapuri Delhi 💯Call Us 🔝9953322196🔝 💯Escort.
 
Harmful and Useful Microorganisms Presentation
Harmful and Useful Microorganisms PresentationHarmful and Useful Microorganisms Presentation
Harmful and Useful Microorganisms Presentation
 
Vision and reflection on Mining Software Repositories research in 2024
Vision and reflection on Mining Software Repositories research in 2024Vision and reflection on Mining Software Repositories research in 2024
Vision and reflection on Mining Software Repositories research in 2024
 
Environmental Biotechnology Topic:- Microbial Biosensor
Environmental Biotechnology Topic:- Microbial BiosensorEnvironmental Biotechnology Topic:- Microbial Biosensor
Environmental Biotechnology Topic:- Microbial Biosensor
 
Pests of soyabean_Binomics_IdentificationDr.UPR.pdf
Pests of soyabean_Binomics_IdentificationDr.UPR.pdfPests of soyabean_Binomics_IdentificationDr.UPR.pdf
Pests of soyabean_Binomics_IdentificationDr.UPR.pdf
 
Engler and Prantl system of classification in plant taxonomy
Engler and Prantl system of classification in plant taxonomyEngler and Prantl system of classification in plant taxonomy
Engler and Prantl system of classification in plant taxonomy
 
Call Girls in Munirka Delhi 💯Call Us 🔝9953322196🔝 💯Escort.
Call Girls in Munirka Delhi 💯Call Us 🔝9953322196🔝 💯Escort.Call Girls in Munirka Delhi 💯Call Us 🔝9953322196🔝 💯Escort.
Call Girls in Munirka Delhi 💯Call Us 🔝9953322196🔝 💯Escort.
 
Solution chemistry, Moral and Normal solutions
Solution chemistry, Moral and Normal solutionsSolution chemistry, Moral and Normal solutions
Solution chemistry, Moral and Normal solutions
 
Scheme-of-Work-Science-Stage-4 cambridge science.docx
Scheme-of-Work-Science-Stage-4 cambridge science.docxScheme-of-Work-Science-Stage-4 cambridge science.docx
Scheme-of-Work-Science-Stage-4 cambridge science.docx
 
Pests of castor_Binomics_Identification_Dr.UPR.pdf
Pests of castor_Binomics_Identification_Dr.UPR.pdfPests of castor_Binomics_Identification_Dr.UPR.pdf
Pests of castor_Binomics_Identification_Dr.UPR.pdf
 
TOPIC 8 Temperature and Heat.pdf physics
TOPIC 8 Temperature and Heat.pdf physicsTOPIC 8 Temperature and Heat.pdf physics
TOPIC 8 Temperature and Heat.pdf physics
 
STOPPED FLOW METHOD & APPLICATION MURUGAVENI B.pptx
STOPPED FLOW METHOD & APPLICATION MURUGAVENI B.pptxSTOPPED FLOW METHOD & APPLICATION MURUGAVENI B.pptx
STOPPED FLOW METHOD & APPLICATION MURUGAVENI B.pptx
 
Microphone- characteristics,carbon microphone, dynamic microphone.pptx
Microphone- characteristics,carbon microphone, dynamic microphone.pptxMicrophone- characteristics,carbon microphone, dynamic microphone.pptx
Microphone- characteristics,carbon microphone, dynamic microphone.pptx
 
Call Us ≽ 9953322196 ≼ Call Girls In Lajpat Nagar (Delhi) |
Call Us ≽ 9953322196 ≼ Call Girls In Lajpat Nagar (Delhi) |Call Us ≽ 9953322196 ≼ Call Girls In Lajpat Nagar (Delhi) |
Call Us ≽ 9953322196 ≼ Call Girls In Lajpat Nagar (Delhi) |
 
Analytical Profile of Coleus Forskohlii | Forskolin .pptx
Analytical Profile of Coleus Forskohlii | Forskolin .pptxAnalytical Profile of Coleus Forskohlii | Forskolin .pptx
Analytical Profile of Coleus Forskohlii | Forskolin .pptx
 
The dark energy paradox leads to a new structure of spacetime.pptx
The dark energy paradox leads to a new structure of spacetime.pptxThe dark energy paradox leads to a new structure of spacetime.pptx
The dark energy paradox leads to a new structure of spacetime.pptx
 
‏‏VIRUS - 123455555555555555555555555555555555555555
‏‏VIRUS -  123455555555555555555555555555555555555555‏‏VIRUS -  123455555555555555555555555555555555555555
‏‏VIRUS - 123455555555555555555555555555555555555555
 
BREEDING FOR RESISTANCE TO BIOTIC STRESS.pptx
BREEDING FOR RESISTANCE TO BIOTIC STRESS.pptxBREEDING FOR RESISTANCE TO BIOTIC STRESS.pptx
BREEDING FOR RESISTANCE TO BIOTIC STRESS.pptx
 

Calidad del agua para agricultura fao 29-ayers y westcot 1985-oki

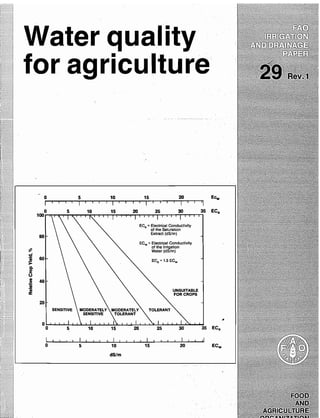
  • 1. 0 5 10 15 20 ECw I i , I I I I 'I 0 5 15 20 25 30 35 EC. 100 ECo = Electrical Conductivity of the Saturation 80 Extract (dS/m) ECw =Electrical Conductivity .. of the Irrigation Water (dS/m) i 60 EGe =1.5 ECw;;: c. eCJ .I 40 ~ UNSUITABLE II: FOR CROPS 20 TOLERANT • 0 EC.0 5 10 15 20 25 30 35 I I I I I d 0 5 10 15 20 ECw dS/m Water for agr
  • 2. Water uality for agriculture Library COpy CALIFORIJ.1A REGIONAL WATER QUALITY CONTROL BOARD Central Valley Region 3448 RJuti:~iHond .Sacramento, CA 95821' I.ibt: ~q~ --ve,,...'Ii! C ' -~'ltl~~~~ O,o"y. by '"''' 1Ii,,""'( l ... R.S.Ayers ~,~, Soil and Water Specialist (Emeritus) , University of California Davis, California, USA and D.W. Westcot Senior Land and Water Resources Specialist California Regional Water Quality Control Board / Sacramento, California, USA
  • 3. The designationsJ~~p18~yed and the presentation of material il)"Jtiis.~Pu6I1catLon do not imply the expression ~..ot 'any op:in.igd whatsoever on the part o~, the' Food "and~Ag~iculture Organization of th'(r;',~U·nited"";Niiii01Js;:'i{:'oncerningthe legal s~atus of 'lily boi;ptry;:"territory, city or area or of !t~o,a~th~~i,!les, ~!~~onc~rning the delimitation O~,!~'fr,9ftlers Pt b~undane~d~}' .'~~:~""".:,~{/" M-56 ISBN 92-5-102263-1 All rights reserved. No part of this publication may be reproduced, stored in a retrieval system, or transmitted in any form or by any means, electronic, mechanical, photocopying or otherWise, without the prior permission of the copyright owner. Applications for such permission, with a statement of the purpose and extent of the reproduction, should be addressed to the Director, Publications Division, Food and Agriculture Organization of the United Nations, Via delle Terme di Caracalla, 00100 Rome, Italy. © FAD 1985
  • 4. PREFACE Water Quality for Agriculture was first published in 1976 as Irrigation and Drainage Paper 29. Although many of the basic concepts of salinity control and dealing with poor quality water remain the same, new data and experience have prompted us to revise the 1976 paper in order to keep the user up-to-date. The document is now presented as a field guide for evaluating the suitability of a water for irrigation. Included are suggestions for obtaining maximum utilization of an existing or potential water supply. Guideline values given identify a potential problem water based on possible restrictions in use related to 1) salinity, 2) rate of water infiltration into the soil, 3) a specific ion toxicity, or 4) to some other miscellaneous effects. Discussions and examples are given along with possible management alternatives to deal with these potential problems. This paper is intended to provide guidance to farm and project managers, consultants and engineers in evaluating and identifying potential problems related to water quality. It discusses possible restrictions on the use of the water and presents management options which may assist in farm or project management, planning and operation. The guidelines and discussions are based on reported experiences gained from many farm areas throughout the world, mostly in arid and semi-arid areas. A vast majority of the data has come from agriculture in the Western United States, therefore, caution and a critical attitude should be taken when applying the guidelines to specific local condi- tions. The guidelines can indicate potential problems and possible restrictions on use of the water but the true suitability of a given water depends on the specific conditions of use and on the management capability of the user. The guidelines should be useful in placing water quality effects in perspective with the other factors affecting crop production, the ultimate goal being to obtain maximum production per unit of available water. Salinity is discussed from the standpoint of a reduction in soil-water availability to the crop. Recent research findings on plant response to salinity within the root zone have been incorporated into the guidelines to improve their predictive capability. Updated crop tolerance values have also become available and ~re included. A method is presented for calculating the leaching requirement for the crop considering the quality of water available. Values calculated by this procedure, if adopted, represent an appreciable water saving as compared to most older procedures. A water infiltration problem related to water quality is usually associated with both the salinity and sodium content of the water. A procedure is presented to evaluate the potential of a water to cause an infiltration problem based on a combination of its salinity (Ee ) and sodium adsorption ratio (SAR). w A specific ion toxicity is discussed as to the concentration of boron, sodium or chloride and their effect on yield of sensitive crops. Other less frequently encountered problems are discussed as miscellane- ous problems. Tables showing recommended maximum concentrations of trace elements for irrigation water and for toxic substances in drinking water for livestock are also presented.
  • 5. ACKNOWLEDGEMENTS These guidelines are based on various preceding guidelines developed and used in irrigated agriculture in the Western United States. The format follows that used by the staff of the University of California, USA. Many of the basic data and the concepts of saline water use and management have been developed or proposed by the US Salinity Laboratory and the authors would like to express their grateful appreciation for this help, particularly to Drs. G.J. Hoffman, E.V. Maas, J.D. Rhoades, D.L. Suarez, and the Laboratory Director, J. van Schilfgaarde. Drs. R.L. Branson and J.D. Oster (University of California), Dr. J. Van Hoorn (Wageningen), Mr. J.D. Doorenbos (Ministry of Agriculture, The Netherlands), and staff of the Land and Water Development Division (FAO) have been particularly helpful with suggestions and draft reviews. Thanks are also due to: Chrissi Smith-Redfern, Hazel Tonkin, Charlene Arora and Mary Westcot. The paper is dedicated to the field person who must make decisions on the effective use of irrigation water. This paper attempts to take the solution and prevention of water quality problems to the field. The ultimate goal is that of maximum food production from the available supply of water. NOTE: In running text where symbols are used, e. g. ECdw, for mechanical reasons they have been typed level on the line. However, they appear correctly in the equations where greater flexibility is possible e.g. EC dw'
  • 6. Preface Acknowledgements CONTENTS iv 1 1 2 3 4 4 5 59 13 5 6 59 59 77 13 13 15 21 77 65 72 73 74 74 23 23 29 41 47 52 56 65 77 79 81 iii Page Salinity Water infiltration rate Toxicity Miscellaneous Drainage Salinity control by leaching Crop tolerance to salinity Cultural practices Changing methods of irrigation Land development for salinity control Changing or blending water supphies Chloride Sodium Boron Soil and water amendments Blending water supplies Cultivation and deep tillage Organic residues Irrigation management Approach to Evaluating Water Quality Water Quality Guidelines 1. 2.1 1.:1.2 1. 2.3 1. 2.4 Introduction Build-up of Soil Salinity Salinity Effects on Crops Management of Salinity Problems 2.4.1 2.4.2 2.4.3 2.4.4 2.4.5 2.4.6 2.4.7 3.2.1 3.2.2 3.2.3 3.2.4 3.2.5 4.1.1 4.1. 2 4.1. 3 3.1.1 Infiltration problem evaluation WATER QUALITY EVALUATION 1.1 Introduction 1.2 Water Quality Problems 2.1 2.2 2.3 2.4 3.1 The Infiltration Problem INFILTRATION PROBLEMS SALINITY PROBLEMS 3.2 Management of Infiltration Problems 1.3 1.4 4.1 Specific Ions and Their Effects TOXICITY PROBLEMS 1. 3. 2. 4.
  • 7. vi 4.2 Management of Toxicity Problems 4.3 Toxicity Effects due to Sprinkler Irrigation 4.2.1 4.2.2 4.2.3 4.2.4 Leaching Crop selection Cultural practices Blending water supplies 81 84 86 86 87 87 5. MISCELLANEOUS PROBLEMS 5.1 Excess Nitrogen 5.2 Abnormal pH 5.3 Scale Deposits 5.4 Magnesium Problems 5.5 Trace Elements and Their Toxicity 91 91 92 93 94 95 5.7 Clogging Problems in Localized (Drip) Irrigation Systems 99 5.8 Corrosion and Encrustation 104 5.6 Nutrition and Water Quality 5.5.1 5.5.2 5.5.3 5.6.1 5.6.2 5.6.3 5.6.4 Natural occurrence in water Toxicities Evaluation criteria Nutrition and salinity Water infiltration problems and nutrition Nutrition and toxicity Miscellaneous 95 95 97 97 97 98 98 99 6. 5.8.1 Metal corrosion 5.8.2 Concrete corrosion 5.9 Vector Problems Associated with Water Quality WATER QUALITY FOR LIVESTOCK AND POULTRY 104 105 107 111 6.1 6.2 6.3 Introduction Use of Saline Water for Livestock Toxic Substances in Livestock Water 111 III 114 7. 8. IRRIGATION WATER QUALITY AND WASTEWATER RE-USE EXPERIENCES USING WATER OF VARIOUS QUALITIES 8.1 Introduction 8.2 Protection of Irrigation Water Quality - Sacramento-San Joaquin Delta, USA 8.3 Re-use of Agricultural Drainage Water - ?roadview Water District, USA 8.4 Use of an Exceptionally Low Salinity Water - Friant-Kern Canal, San Joaquin Valley, California, USA 117 121 121 121 122 123
  • 8. 8.15 Groundwater Degradation - Wadi Dhuleil, Jordan 132 8.22 Wastewater Irrigation - Bakersfield, California, USA 140 8.6 Use of Poor Quality Water - Bahrain 124 159 163 8.24 Irrigation with Wastewater - Santa Rosa, California, USA 142 vii 8.25 Use of Wastewater High in Boron - Calistoga, California, USA 144 8.21 Agricultural Use of Treated Wastewater - Braunschweig, FR Germany 139 8.23 Wastewater Irrigation - Tuolumne Regional Water District, California, USA 141 8.17 Sediment in the Irrigation Water Supply - Ethiopia 133 •8.20 Fresno Irrigation Scheme Using Treated Wastewater - California, USA 138 8.19 Poor Quality Groundwater for Livestock Drinking Water - New Mexico, USA 137 8.18 High Fluoride in Animal Drinking Water - New Mexico, USA 135 8.5 High Bicarbonate Water Used for Overhead Sprinkler Irrigation - Denver, Colorado, USA 123 8.14 River Water Quality Variations - Ethiopia and Somalia 132 8.11 Use of Marginal Quality Water - Medjerda Valley, Tunisia 129 8.8 Need for Drainage - Tigris-Euphrates River Basin, Iraq 126 8.10 Use of Agricultural Drainage Water for Production of Selected Crops - Imperial Valley and San Joaquin Valley, California, USA 127 8.13 Irrigation Water Quality - Lake Chad, Africa 130 8.9 High Salinity Water - Arizona, USA 126 8.7 Drainage Problems - Imperial Valley, California, USA 125 8.12 Use of Poor Quality Water for Irrigation - United Arab Emirates 129 .8.16 Surface Water Quality Degradation - Yemen Arab Republic 133 REFERENCES Annex I Table - Water analysis of 250 selected irrigation supplies from various locations in the world 145 Annex II Glossary
  • 9.
  • 10. 62 70 71 78 sodium 80 82 83 88 1. 2. 3. 4. 5. 6. 7. 8. 9. 10. 11. 12. 13 . 14. 15. 16. 17. 18. 19. 20. 21. 22. 23. ix LIST OF TABLES Guidelines for interpretations of water quality for irrigation Laboratory determinations needed to evaluate common irrigation water quality problems Concentration factors (Xl for predicting soil salinity (ECel from irrigation water salinity (EC ) and the leaching fraction (LF) w Crop tolerance and yield potential of selected crops as influenced by irrigation water salinity (ECwl or soil salinity (EC ) e Relative salt tolerance of agricultural crops Guidelines for interpreting laboratory data on water suitability for grapes Relative salt tolerance of various crops at germination Effect of planting rates on seedling establishment of crops sprinkle-irrigated with different quality water in Israel Relative effect of fertilizer materials on the soil solution Water quality from blended canal and well water Calcium concentration (Ca ) expected to remain in near-surface soil-water xfollowing irrigation with water of given HC0 3 /Ca ratio and ECw Water and soil amendments and their relative effectiveness in supplying calcium Average composition and equivalent acidity or basicity of fertilizer materials Chloride tolerance of some fruit crop cultivars and rootstocks Relative tolerance of selected crops to exchangeable Relative boron tolerance of agricultural crops Citrus and stone fruit rootstocks listed in order of increasing boron accumulation and transport to leaves Relative tolerance of selected crops to foliar injury from saline water applied by sprinklers Leaf burn on alfalfa with three rates of water application by sprinkler irrigation in Imperial Valley, California ~odium content in cotton leaves in percent oven dry weight Recommended maximum concentrations of trace elements in irrigation water Physical, chemical and biological contributors to clogging or localized (drip) irrigation systems as related to irrigation water quality Standard water quality tests needed for design and operation of localized (drip) irrigation systems Page 8 10 18 31 34 40 40 44 48 58 89 89 96 100 100
  • 11. 24. 25. 26. 27. 28. 29. 30. 31. 32. 33. 34. 35. 36. 37. 38. 39. 40. 41. 42. 43. 44. 45. x Influence of water quality on the potential for clogging problems in localized (drip) irrigation systems Procedure for calculation of pHc Chlorine dosages for control of biological growths Limit values for evaluating the aggressivity of water and soil to concrete Water quality guide for livestock and poultry uses Suggested limits for magnesium in drinking water for livestock Guidelines for levels of toxic substances in livestock drinking water Existing standards governing the use of renovated water in agriculture Treatment processes suggested by the World Health Organization for wastewater re-use Selected crop yield from the Safford Experiment Station as compared to average farm yields Red Mountain Farms lint cotton yields (kg/ha) Salinity of the Medjerda River at El Aroussia, Tunisia (monthly mean in dS/m) Effect of irrigation method on tomato yield (kg/ha) Effect of irrigation method on sodium and chloride concentration of the foliage of lemon trees (dry weight basis) Trace element concentrations of three water supply wells in selected areas of New Mexico, USA Fluoride in well water in mg/l Salt and trace element content of a cattle water source Water analyses for the Agua Negra Ranch (mg/l) Trace element concentrations in Fresno municipal wastewater Water quality in and around the Braunschweig treated wastewater use area Trace element concentrations in wastewater from the Tuolumne Regional Water District Trace element and nutrient content of wastewater from the City of Santa Rosa 101 103 104 106 112 112 114 118 119 127 127 129 130 130 136 136 137 138 139 140 142 143
  • 12. 1. 2. 3. 4. 5. 6. 7. 8. 9. 10. 11. 12. 13. 14. 15. 16. 17. 18. 19. 20. 21. xi LIST OF FIGURES Nomogram for determining the SAR value of irrigation water and for estimating the corresponding ESP value of a soil that is at equilibrium with the water Salinity profile expected to develop after long-term use of water of EC w = 1.0 dS/m at various leaching fractions (LF) Soil moisture retention curves for a clay loam soil at varying degrees of soil salinity (EC· ) e Change in salinity of soil-water (EC ) between irrigations of alfalfa due to ET useswof stored water Salinity profile with a high water table Relation between capillary flow velocity and depth of water table Effect of applied water salinity (EC ) upon root zone soil salinity (EC) at various wleaching fractions e Soil salinity (EC ) of a sandy-loam soil before and after 150 rom ofe rainfall Soil salinity (EC ) profiles at the end of the irrigation season and after ewinter rainfall in citrus plantings Divisions for relative salt tolerance ratings of agricultural crops Method of determining maximum EC e Flat top beds and irrigation practice Salinity control with sloping beds Sloping seedbeds Sloping seedbeds used for salinity and temperature control Bed shapes and salinity effects Salt accumulation patterns for a) surface flooding, b) furrow irrigation, c) border irrigation, and d) localized irrigation Influence of the irrigation system on the soil salinity pattern and yield of bell pepper at two levels of irrigation water quality Depth of leaching water per unit depth of soil required to reclaim a saline soil by continuous ponding Depth of leaching water per unit depth of soil required to reclaim a saline soil by ponding water intermittently Relative rate of water infiltration as affected by salinity and sodium adsorption ratio Page 11 18 20 20 22 22 25 28 28 36 38 45 45 46 46 46 49 52 54 54 60
  • 13. 22. 23. xii Depth of leaching water per unit depth of soil required to reclaim a soil inherently high in boron Heavy metal content of the soil profile after 80 years of irrigation with wastewater 85 95 24. Concentration factor from applied water salinity (Ee) under sUbirrigation peatland in e the Sacramento-San Joaquin California, USA (EC ) to soil w . on organlc Delta, 122 25. 1. 2. 3. 4. 5. 6. 7. 8. Electrical conductivity of Lake Chad from 26 February to 10 April 1967 LIST OF EXAMPLES Calculation of concentration of deep percolation from the bottom of the root zone Determination of average root zone salinity Leaching requireme~t calculation Determination of yield potential Blending irrigation water for maize Comparison of methods to calculate the sodium hazard of a water Use of gypsum as an amendment Blending irrigation water to reduce the SAR of a poor quality supply 131 14 16 26 38 57 64 67 72
  • 14. - 1 - 1. WATER QUALITY EVALUATION 1.1 INTRODUCTION Irrigated agriculture is dependent on an adequate water supply of usable quality. Water quality concerns have often been neglected because good quality water supplies have been plentigul and readily available. This situation is now changing in many areas. Intensive use of nearly all good quality supplies means that new irrigation projects and old projects seeking new or supplemental supplies must rely on lower quality and less desirable sources. To avoid problems when using these poor quality water supplies, there must be sound planning to ensure that the quality of water available is put to the best use. The objective of this paper is to help the reader to a better understanding of the effect of water quality upon soil and crops and to assist in selecting suitable alternatives to cope with potential water quality related problems that might reduce production under prevailing conditions of use. Conceptually, water quali ty refers to the characteristics of a water supply that will influence its suitability for a specific use, i.e. how well the quality meets the needs of the user. Quality is defined by certain physical, chemical and biological characteristics. Even a personal preference such as taste is a simple evaluation of acceptabili ty. For example, if two drinking waters of equally good quality are available, people may express a preference for one supply rather than the other; the better tasting water becomes the preferred supply. In irrigation water evaluation, emphasis is placed on the chemical and physical characteristics of the water and only rarely are any other factors considered important. Specific uses have different quality needs and one water supply is considered more acceptable (of better quality) if it produces better results or causes fewer problems than an alternative water supply. For example, good qual i ty river water which can be used successfully for irrigation may, because of its sediment load, be unacceptable for muni- cipal use without treatment to remove the sediment. Similarly, snowmelt water of excellent quality for municipal use may be too corrosive for industrial use without treatment to reduce its corrosion potential. The ideal situation is to have several supplies from which to make a selection, but normally only one supply is available. In this case, the quality of the available supply must be evaluated to see how it fits the intended use. Most of the experience in using water of different qualities has been gained from observations and detailed study of problems that develop following use. The cause and effect relationship between a water constituent and the observed problem then results in an evaluation of quality or degree of acceptability. With sufficient reported experiences and measured responses, certain constituents emerge as indicators of quality-related problems. These characteristics are then organized into guidelines related to suit- ability for use. Each new set of guidelines builds upon the previous set to improve the predictive capability. Numerous such guidelines have become available covering many types of use. There have been a number of different water quality guidelines related to irrigated agriculture. Each has been useful but none has been entirely satisfactory because of the wide variability in field condi tions. Hopefully, each new set of guidel ines has improved our predictive capability. The guidelines presented in this paper have relied heavily on previous ones but are modified to give more practical
  • 15. - 2 - procedures for evaluating and managing water quality-related problems of irrigated agriculture. They are an updated version of those in the 1976 edition of this paper. Changes from the 1976 edition are discussed in the appropriate sections of the paper. 1.2 WATER QUALITY PROBLEMS Water used for irrigation can vary greatly in quality depending upon type and quantity of dissolved salts. Salts are present in irri- gation water in relatively small but significant amounts. They origi- nate from dissolution or weathering of the rocks and soil, including dissolution of lime, gypsum and other slowly dissolved soil minerals. These salts are carried with the water to wherever it is used. In the case of irrigation, the salts are applied with the water and remain behind in the soil as water evaporates or is used by the crop. The suitability of a water for irrigation is determined not only by the total amount of salt present but also by the kind of salt. Various soil and cropping problems develop as the total salt content increases, and special management practices may be required to maintain acceptable crop yields. Water quality or suitability for use is Judged on the potential severity of problems that can be expected to develop during long-term use. The problems that result vary both in kind and degree, and are modified by soil, climate and crop, as well as by the skill and knowledge of the water user. As a result, there is no set limit on water quality; rather, its suitability for use is determined by the conditions of use which affect the accumulation of the water con- stituents and which may restrict crop yield. The soil problems most commonly encountered and used as a basis to evaluate water quality are those related to salinity, water infiltration rate, toxicity and a group of other miscellaneous problems. WATER QUALITY-RELATED PROBL1llIS IN IRRIGATED AGRICULTUIlE SALINITY Salts in Bailor water reduce water availability to the crop to such an extent that yield is affected. WATER INI!'ILTlIATION RATE Relatively high sodium or low calcium content of sailor water reduces the rate at which irrigation water enters soil to such an extent that sufficient water cannot be infiltrated to supply the crop adequately from one irrigation to the next. SPECIFIC ION TOXICITY Certain ions (sodium, chloride, or boron) from Bailor water accumulate in a sensitive crop to concentrations high enough to cause crop damage and reduce yields. MIScm,I.ANEOUS Excessive nutrients reduce yield or quality; unsightly deposits on fruit or foliage reduce marketability; excessive corrosion of equipment increases maintenance and repairs.
  • 16. - 3 - 1. 2.1 Salinity A salinity problem exists if salt accumulates in the crop root zone to a concentration that causes a loss in yield. In irrigated areas, these salts often originate from a saline, high water table or from salts in the applied water. Yield reductions occur when the salts accumulate in the root zone to such an extent that the crop is no longer able to extract sufficient water from the salty soil solution, resulting in a water stress for a significant period of time. If water uptake is appreciably reduced, the plant slows its rate of growth. The plant symptoms are similar in appearance to those of drought, such as wilting, or a darker, bluish-green colour and sometimes thicker, waxier leaves. Symptoms vary with the growth stage, being more noticeable if the salts affect the plant during the early' stages of growth. In some cases, mild salt effects may go entirely unnoticed because of a uniform reduction in growth across an entire field. Salts that contribute to a salinity problem are water soluble and readily transported by water. A portion of the salts that accumu- late from prior irrigations can be moved (leached) below the rooting depth if more irrigation water infiltrates the soil than is used by the crop during the crop season. Leaching is the key to controlling a water quality-related salinity problem. Over a period of time, salt removal by leaching must equal or exceed the salt additions from the applied water to prevent salt building up to. a damaging concentration. The amount of leaching required is dependent upon the irrigation water quality and the salinity tolerance of the crop grown. Salt content of the root zone varies with depth. It varies from approximately that of the irrigation water near the soil surface to many times that of the applied water at the bottom of the rooting depth. Salt concentration increases with depth due to plants extracting water but leaving salts behind in a greatly reduced volume of soil water. Each subsequent irrigation pushes (leaches) the salts deeper into the root zone where they continue to accumulate until leached. The lower rooting depth salinity will depend upon the leaching that has occurred. Following an irrigation, the most readily available water is in the upper root zone - a low salinity area. As the crop uses water, the upper root zone becomes depleted and the zone of most readily available water changes toward the deeper parts as the time interval between irrigations is extended. These lower depths are usually more salty. The crop does not respond to the extremes of low or high salinity in the rooting depth but integrates water availability and takes water from wherever it is most readily available. Irrigation timing is thus important in maintaining a high soil-water availability and reducing the problems caused when the crop must draw a significant portion of its water from the less available, higher salinity soil-water deeper in the root zone. For good crop production, equal importance must be given to maintaining a high soil-water availability and to leaching accumu- lated salts from the rooting depth before the salt concentration exceeds the tolerance of the plant. For crops irrigated infrequently, as is normal when using surface methods and conventional irrigation management, crop yield is best correlated with the average root zone salinity, but for crops irrigated on a daily, or near daily basis (localized or drip irriga- tion) crop yields are better correlated with the water-uptake weighted root zone salinity (Rhoades 1982). The differences are not great but may become important in the higher range of salinity. In this paper, discuss ions are based on crop response to the average root zone salinity.
  • 17. - 4 - In irrigated agriculture, many salinity problems ~re. associated with or strongly influenced by a shallow water table (w1th1n 2 metres of the surface). Salts accumulate in this water table and frequently become an important additional source of salt that moves upward into the crop root zone. Control of an existing shallow water table is thus essential to salinity control and to successful long-term irrigated agriculture. Higher salinity water requires appreciable extra water for leaching, which adds greatly to a potential water table (drainage) problem and makes long-term irrigated agriculture nearly impossible to achieve without adequate drainage. If drainage is adequate, salinity control becomes simply good management to ensure that the crop is adequately supplied with water at all times and that enough leaching water is applied to control salts within the tolerance of the crop. 1.2.2 Water Infiltration Rate An infiltration problem related to water quality Occurs when the normal infiltration rate for the applied water or rainfall is appreci- ably reduced and water remains on the soil surface too long or infil- trates too slowly to supply the crop with sufficient water to maintain acceptable yields. Although the infiltration rate of water into soil varies widely and can be greatly influenced by the quality of the irrigation water, soil factors such as structure, degree of compaction, organic matter content and chemical make-up can also greatly influence the intake rate. The two most cornmon water quality factors which influence the normal infiltration rate are the salinity of the water (total quantity of salts in the water) and its sodium content relative to the calcium and magnesium content. A high salinity water will increase infiltra- tion. A low salinity water or a water with a high sodium to calcium ratio will decrease infiltration. Both factors may operate at the same time. Secondary problems may also develop if irrigations must be pro- longed for an extended period of time to achieve adequate infiltration. These include crusting of seedbeds, excessive weeds, nutritional dis- orders and drowning of the crop, rotting of seeds and poor crop stands in low-lying wet spots. One serious side effect of an infiltration problem is the potential to develop disease and vector (mosquito) problems. An infiltration problem related to water quality in most cases occurs in the surface few centimetres of soil and is linked to the structural stability of this surface soil and its low calcium content relative to that of sodium. When a soil is irrigated with a high sodium water, a high sodium surface soil develops which weakens soil struc- ture. The surface soil aggregates then disperse to much smaller particles which clog soil pores. The problem may also be caused by an extremely low calcium content of the surface soil. In some cases, water low in salt can cause a similar problem but this is related to the corrosive nature of the low salt water and not to the sodium content of the water or soil. In the case of the low salt water, the water dissolves and leaches most of the soluble minerals, including calcium, from the surface soil. 1. 2.3 Toxic.i ty Toxicity problems occur if certain constituents (ions) in the soil or water are taken up by the plant and accumulate to concentra- tions high enough to cause crop damage or reduced yields. The degree of damage depends on the uptake and the crop sensitivity. The permanent, perennial-type crops (tree crops) are the more sensitive. Damage often
  • 18. - 5 - occurs at relatively low ion concentrations for sensitive crops. It is usually first evidenced by marginal leaf burn and interveinal chloro- sis. If the accumulation is great enough, reduced yields result. The more tolerant annual crops are not sensitive at low concentrations but almost all crops will be damaged or killed if concentrations are sufficiently high. The ions of primary concern are chloride, sodium and boron. Al though toxici ty problems may occur even when these ions are in low concentrations, toxicity often accompanies and complicates a salinity or water infiltration problem. Damage results when the potentially toxic ions are absorbed in significant amounts with the water taken up by the roots. The absorbed ions are transported to the leaves where they accumulate during transpiration. The ions accumulate to the greatest extent in the areas where the water loss is greatest, usually the leaf tips and leaf edges. Accumulation to toxic concentrations takes time and visual damage is often slow to be noticed. The degree of damage depends upon the duration of exposure, concentration by the toxic ion, crop sensitivity, and the volume of water transpired by the crop. In a hot climate or hot part of the year, accumulation is more rapid than if the same crop were grown in a cooler climate or cooler season when it might show little or no damage. Toxicity can also occur from direct absorption of the toxic ions through leaves wet by overhead sprinklers. Sodium and chloride are the primary ions absorbed through leaves, and toxicity to one or both can be a problem with certain sensitive crops such as citrus. As concentra- tions increase in the applied water, damage develops more rapidly and becomes progressively more severe. 1.2.4 Miscellaneous Several other problems related to irrigation water quality occur with sufficient frequency for them to be specifically noted. These in- clude high nitrogen concentrations in the water which supplies nitrogen to the crop and may cause excessive vegetative growth, lodging, and delayed crop maturity; unsightly deposits on fruit or leaves due to overhead sprinkler irrigation with high bicarbonate water, water con- taining gypsum, or water high in iron; and various abnormalities often associated with an unusual pH of the water. A special problem faced by some farmers practising irrigation is deterioration of equipment due to water-induced corrosion or encrustation. This problem is most serious for wells and pumps, but in some areas, a poor quality water may also damage irrigation equipment and canals. In areas where there is a potential risk from diseases such as malaria, schistosomiasis and lymphatic filariasis, disease vector problems must be considered along with other water quality-related problems. Vector problems (mosquitoes) often originate as a secondary trouble related to a low water infiltra- tion rate, to the use of wastewater for irrigation, or to poor drain- age. Suspended organic as well as inorganic sediments cause problems in irrigation systems through clogging of gates, sprinkler heads and drippers. They can cause damage to pumps if screens are not used to exclude them. More commonly, sediments tend to fill canals and ditches and cause costly dredging and maintenance problems. Sediment also tends to reduce further the water infiltration rate of an already slowly permeable soil. 1.3 APPROACH TO EVALUATING WATER QUALITY The prediction that a water quality-related problem will occur requires evaluation of the potential of the water to create soil condi-
  • 19. - 6 - 1.4 WATER QUALITY GUIDELINES If problems do occur in combination, they are more easily understood and solved if each factor is considered individually. Therefore, the guidelines and discussion which follow treat each problem and its solution separately, so that a number of factors are evaluated for each of the problem areas, such as: the management options that are available to pre- vent, correct, or delay the onset of the problem. the expected severity of the problem following long-term use of the water; the soil-water-plant interactions that may cause the loss in crop yield; the type and concentration of salts causing the problem; * * * * The guidelines are practical and have been used successfully in general irr~gated agriculture for evaluation of the common constituents in surface water, groundwater, drainage water, sewage effluent and wastewater. They are based on certain assumptions which are given immediately following the table. These assumptions must be clearly understood but should not become rigid prerequisites. A modified set of alternative guidelines can be prepared if actual conditions of use differ greatly from those assumed. Guidelines for evaluation of water quality for irrigation are given in Table 1. They emphasize the long-term influence of water quali ty on crop production, soil conditions and farm management, and are presented in the same format as in the 1976 edition but are updated to include recent research results. This format is similar to that of the 1974 University of California Committee of Consultant's Water Quality Guidelines which were prepared in cooperation with staff of the United States Salinity Laboratory. The four problem categories previously discussed salinity, infiltration, toxicity and miscellaneous - are used for evaluation. Water quality problems, however, are often complex and a combination of problems may affect crop production more severely than a single problem in isolation. The more complex the problem, the more difficult it is to formulate an economical management programme for solution. This approach is the same as in the 1976 edition of this paper and similar guidelines are proposed for evaluating the potential of an irrigation water to create soil or crop problems. The guidelines are followed by suggestions on management alternatives to overcome these poten tial problems. This approach is often referred to as a problem- solving approach and emphasizes long-term effects on irrigated agri- culture rather than short-term, because of the large investments now needed in irrigated agriculture. tions that may restrict its use or that may require the use of special management techniques to maint~in accept~ble yields. There are a.number of procedures available for thls evaluatl0n but regardless of WhlCh one is used, emphasis should focus on relating the potential problem to the field situation since solutions to water quality problems usually must be implemented at the farm level rather than at the project level. The evaluation must therefore be done in terms of specific local conditions of use and the farm management capability of the water user.
  • 20. - 7 - Ordinarily, no soil or cropping problems are experienced or recognized when using water with values less than those shown for 'no restriction on use'. with restrictions in the slight to moderate range, gradually increasing care in selection of crop and management alterna- tives is required if full yield potential is to be achieved. On the other hand, if water is used which equals or exceeds the values shown for severe restrictions, the water user should experience soil and cropping problems or reduced yields, but even with cropping management designed especially to cope with poor quality water, a high level of management skill is essential for acceptable production. If water quality values are found which approach or exceed those given for the severe restriction category, it is recommended that before initiating the use of the water in a large project, a series of pilot farming studies be conducted to determine the economics of the farming and cropping techniques that need to be implemented. Table 1 is a management tool. As with many such interpretative tools in agriculture, it is developed to help users such as water agencies, project planners, agriculturalists, scientists and trained field people to understand better the effect of water quality on soil conditions and crop production. With this understanding, the user should be able to adjust management to utilize poor quality water better. However, the user of Table 1 must guard against drawing unwarranted conclusions based only on the laboratory results and the guideline interpretations as these must be related to field conditions and must be checked, confirmed and tested by field trials or experi- ence. The guidelines are a first step in pointing out the quality limitations of a water supply, but this alone is not enough; methods to overcome or adapt to them are also needed. Therefore, in subsequent sections, management alternatives are presented and several examples are given to illustrate how the guidelines can be used. The guidelines do not evaluate the effect of unusual or special water consti tuents sometimes found J.n wastewater, such as pesticides and organics. However, suggested limits of trace element concentrations for normal irrigation water are given in Section 5.5. As irrigation water supplies frequently serve as a drinking water source for live- stock, salinity and trace element drinking water limitations for livestock are presented in Section 6. It is beyond the scope of this publication to go into drinking water standards, but this aspect should, nevertheless, be considered during the planning of an irrigation scheme. This is important, because irr igation supplies are also commonly used, either intentionally or unintentionally, as human drinking water. The World Health Organization (WHO) or a local health agency should be consulted for more specific information. Laboratory determinations and calculations needed to use the guidelines are given in Table 2 and Figure 1, along with the symbols used. Analytical procedures for the laboratory determinations are given in several publications: USDA Handbook 60 (RichardS 1954), Rhoades and Clark 1978, FAO Soils Bulletin 10 (Dewis and Freitas 1970), and Standard Methods for Examination of Waters and Wastewaters (APHA 1980). The method most appropriate for the available equipment, bUdget and number of samples should be used. Analytical accuracy within ~5 percent is considered adequate.
  • 21. 1 Adapted from University of California Committee of Consultants 1974. 2 ECw means electrical conductivity~ a measure of the water salinity, reported in deciSiemens per metre at 25 D C (dS/m) or in units millimhos per centimetre (mmho/cm)w Both are equiva- lent. TDS means total dissolved solids, reported in milligrams per litre (mg/l). 3 sAR means sodium adsorption ratio. SAR is sometimes reported by the symbol RNaw See Figure 1 for the SAR calculation procedure. At a given SAR, infiltration rate increases as water salinity increases. Evaluate the potential infiltration problem by SAR as modified by ECw. Adapted from Rhoades 1977, and Oster and Schroer 1979. 4 For surface irrigation, most tree crops and woody plants are sensitive to sodium and chlor- idej use the values shown. Most annual crops are not sensitive; use the salinity tolerance tables (Tables 4 and 5). For chloride tolerance of selected fruit crops, see Table 14. With overhead sprinkler irrigation and low humidity « 30 percent), sodium and chloride may be absorbed through the leaves of sensitive crops. For crop sensitivity to absorption, see Tables 18, 19 and 20. S For boron tolerances, see Tables 16 and 17. 6 N03 -N means nitrate nitrogen reported in terms of elemental nitrogen (NH4 -N and Organic-N should be included when wastewater is being tested). GUIDELINES FOR INTERPRETATIONS OF WATER QUALITY FOR IRRIGATION' Degree of Restriction on lise > 9 > 3.0 > 2000 Severe > 10 > 3.0 > 30 > 8.5 5 30 1.5 - 8.5 0.7 - 3.0 450 - 2000 Slight to Moderate Normal Range 6.5 - 8.4 None < 5 < 0.7 < 450 > 0.7 0.7 0.2 < 0.2 > 1.2 1.2 - 0.3 < 0.3 > 1.9 1.9 - 0.5 < 0.5 > 2.9 2.9 1.3 < 1.3 > 5.0 5.0 - 2.9 < 2.9 < 1.5 - 8 - dS/m Units me/l mg/l mg/l SAR < 3 3 - 9 me/l < 3 > 3 me/l < 4 4 - 10 me/l < 3 > 3 mg/l < 0.7 0.7 3.0 SAR = 0 - 3 and EG 3 - 6 w 6 12 12 - 20 20 40 TDS Infiltration (affects infiltration rate of water into the Boil. Evaluate using ECw and 8AR together) 3 surface irrigation sprinkler irrigation Boron (B)5 Trace Elements (see Table 21) KG w surface irrigation sprinkler irrigation Chloride (GI)" (or) Speci£ic Ioo Toxicity (affects sensitive crops) Sodimo. (Ha) II Salinity (affects crop water availability) 2 Miscellaneous Effects (affects susceptible crops) Nitrogen (NO" - N)6 Bicarbonate (BCO,,) (ovel~head sprinkling only) pH Potential Irrigation Problem Table 1
  • 22. - 9 - Table 1 (cont.) Assumptions in the Guidelines The water quality guidelines in Table 1 are intended to cover the wide range of conditions encountered in irrigated agriculture. Several basic assumptions have been used to define their range of usability. If the water is used under greatly different conditions, the guidelines may need to be adjusted. Wide deviations from the assumptions might result in wrong judgements on the usability of a particular water supply, especially if it 1s a borderline case. Where sufficient experience J field trials, research or observations are available, the guidelines may be modified to fit local conditions more closely. The bas:i.c assumptions in the guidelines are: Yield Potential: Full production capability of all crops, without the use of special practices, is assumed when the guidelines indicate no restrictions on use. A "restriction on use" indicates that there may be a limitation in choice of crop, or special management may be needed to maintain full production capability. A "restruction on use" does not indicate that the water is unsuitable fpr use. Site Conditions: Soil texture ranges from sandy-loam to clay-loam with good internal drainage. The climate is semi-arid to arid and rainfall is low. Rainfall does not playa significant role in meeting crop water demand or leaching requirement. (In a monsoon climate or areas where precipitation is high for part or all of the year, the guideline restrictions are too severe. Under the higher rainfall situations, infiltrated water from rainfall is effective in meeting all or part of the leaching requirement.) Drainage is assumed to be good, with no uncontrolled shallow water table present within 2 metres of the surface. Methods and TiDing of Irrigations: Normal surface or sprinkler irrigation methodS are used. Water is applied infrequently, as needed, and the crop utilizes a considerable portion of the available stored soil-water (50 percent or more) before the next irrigation. At least 15 percent of the applied water percolates below the root zone (leaching fraction [LF] :2::15 percent). The guidelines are too retrictive for specialized irrigation methods, such as localized drip irrigation, which results in near daily or frequent irrigations, but are applicable for subsurface irrigation if surface applied leaching satisfies the leaching requirements. Vater Uptake by Crops: Different crops have different water uptake patterns, but all take water from wherever it is most readily available within the rooting depth. On average about 40 percent is assumed to be taken from the upper quarter of the rooting depth, 30 percent from the second quarter, 20 percent from the third quarter, and 10 percent from the lowest quarter. Each irrigation leaches the upper root zone and maintains it at a relatively low salinity. Salinity increases with depth and is greatest in the lower part of the root zone. The average salinity of the soil-water is three times that of the applied water and is representative of the average root zane salinity to which the crop responds. These conditions result from a leaching fraction of 15-20 percent and irrigations that are timed to keep the crop adequately watered at all times. Salts leached from the upper root zone accumulate to some extent in the lower part but a salt balance is achieved as salts are moved below the root zone by sufficient leaching. The higher salinity in the lower root zone becomes less important if adequate moisture is maintained in the upper, "more active" part of the root zone and long-term leaching is accomplished. Restriction on Use: The "Restriction on Use" shown in Table 1 is divided into three degrees of severity: none, slight to moderate, .and severe. The divisions are somewhat arbitrary since change occurs gradually and there is no clearcut breaking point. A change of 10 to 20 percent above or below a guideline value has little significance if considered in proper perspective with other factors affecting yield. Field studies, research trials and observations have led to these divisions,' but management skill of the water user can alter them. Values shown are applicable under normal field conditions prevailing in most irrigated areas in the arid and semi-arid regions of the world.
  • 23. - 10 - Table 2 LABORATORY DETERMINATIONS NEEDED TO EVAlUATE COMMON IRRIGATION WATER QUAlITY PROBLEMS Water parameter Symbol Unit l Usual range in irri~ation water SAlINITY EC dS/m O' - 3 dS/mw TDS mg/l o - 2000 mg/l Ca++ me/l 0 - 20 me/l Mg++ me/l o - 5 me/l Na+ me/l 0 - 40 me/l CO;- me/l o - .1 me/l HCO, me/l o - 10 me/l CI- me/l o - 30 me/l SO, me/l 0 - 20 me/l Carbonate Bicarbonate Chloride Sulphate Salt Content Electrical Conductivity (or) Total Dissolved Solids Magnesium Sodium Cations and Anions Calcium Nitrate-Nitrogen Ammonium-Nitrogen Phosphate-Phosphorus Potassium NO,-N mg/l o - 10 mg/l NH,-N mg/l o - 5 mg/l PO,-P mg/l 0 - 2 mg/l K+ mg/l 0 - 2 mg/l MISCELLANEOUS Boron Acid/Basicity Sodium Adsorption Ratio 3 B pH SAR mg/l 1-14 (me/l)',2 o - 2 6.0 - 8.5 o - 15 mg/l 1 dS/m = deciSiemen/metre in 8.1. units (equivalent to 1 mmho/cm metre) 1 millimmho/cen mg/l = milligram per litre ~ parts per million (ppm). me/l = milliequivalent per litre (mg/l + equivalent weight = 1 millimol/litre adjusted for electron charge. me/I); in SI units, 1 me 2 N03 -N means the laboratory will analyse for N03 but will report the N03 in terms chemically equivalent nitrogen. Similarly, for NH4 -N, the laboratory will analyse fo NH 4 but report in terms of chemically equivalent elemental nitrogen. The tot nitrogen available to the plant will be the Sum of the equivalent elemental nitroge The same reporting method is used for phosphorus. , SAR is calculated from the Na, Ca and Mg reported in me/l (see Figure 1).
  • 24. No· me/I 20 15 10 5 o Fig. J - 11 - The Sodium Adsorption Ratio (SAR) can also be calculated using the following equation: No SAR = Where No, Co and Mg are sodium, calcium, and magnesium in me/l from the woter analysis. Nomogram for determining the SAR value of irrigation water and for estimating the corresponding ESP value of a soil that is at equilibrium with the water (Richards 1954) 0.25 0.50 0.75 1.0 5 10 15 20
  • 25.
  • 26. - 13 - 2.1 INTRODUCTION 2.2. BUILD-UP OF SOIL SALINITY (2 ) depth of water leached below the root zone depth of water applied at the surface Leaching Fraction (LF) After many successive irrigations, the salt accumulation in the soil will approach some equilibrium concentration based on the salinity of the applied water and the leaching fraction. A high leaching fraction (LF ~ 0.5) results in less salt accumulation than a lower leaching fraction (LF ~ 0.1). If the water salinity (ECw) and the leaching fraction (LF) are known or can be estimated, both the salinity of the drainage water that percolates below the rooting depth and the Salts are added to the soil with each irrigation. These salts will reduce crop yield if they accumulate in the rooting depth to damaging concentrations. The crop removes much of the applied water from the soil to meet its evapotranspiration demand (ET) but leaves most of the salt behind to concentrate in the shrinking volume of soil- water. At each irrigation, more salt is added with the applied water. A portion of the added salt must be leached from the root zone before the concentration affects crop yield. Leaching is done by applying suffi- cient water so that a portion percolates through and below the entire root zone carrying with ita portion of the accumulated sal ts. The fraction of applied water that passes through the entire rooting depth and percolates below is called the leaching fraction (LF). 2. SALINITY PROBLEMS The intent of this chapter is to illustrate the effect of water quality on the build-up of soil salinity and show how the latter can reduce the soil-water available to the crop. This is followed by a discussion of how leaching, crop selection and other management techniques are used to make salinity control easier and allow greater use of more saline water in irrigated agriculture. Emphasis will be on how to manage intermediate quality water with slight to moderate restrictions on use, as shown in Table 1. Such water could result in more severe problems if it is not properly managed. The same management techniques will apply to a poorer quality water, but as quality worsens the options for management become fewer. Most water used for irrigation is of good to excellent quality and is unlikely to present serious salinity constraints. Salinity control, however, becomes more difficult as water quality becomes poorer. As water salinity increases, greater care must be taken to leach salts out of the root zone before their accumulation reaches a concentration which might affect yields. Alternatively, steps must be taken to plant crops tolerant to the expected root zone salinity. The frequency of leaching depends on water quality and the crop sensitivity to salinity. Irrigation water contains a mixture of naturally occurring salts. Soils irrigated with this water will contain a similar mix but usually at a higher concentration than in the applied water. The extent to which the salts accumulate in the soil will depend upon the irriga- tion water quality, irrigation management and the adequacy of drainage. If salts become excessive, losses in yield will result. To prevent yield loss, salts in the soil must be controlled at a concentration below that which might affect yield.
  • 27. - 14 - average root zone salinity can be estimated. The salinity of the drainage water can be estimated from the equation: where: ECdw = salinity of the drainage water percolating below the root zone (equal to salinity of soil-water, ECsw) ECw = salinity of the applied irrigation water LF = leaching fraction (3 ) = In Example 1, the leaching fraction and water quality are used to predict drainage water quality. The plant, however, is only exposed to this drainage water salinity at the lowest part of the root zone. The salinity in this lower portion of the root zone tends to be higher than in the upper portion due to its much lower leaching fraction. The crop responds, however, to the average root zone soil salinity and not to the extremes of either the upper or lower zones. EXA!Il'LE 1 - CALCULATION OF CONCENTRATION OF DEEP PERCOLATION FROII THE BOTTOII OF THE IlOOT ZONB A crop is irrigated with water of an electrical conductivity (ECw) of 1 dS/m. The crop is irrigated to achieve a leaching fraction of 0.15 (assumes that 85 percent of the applied water is used by the crop or evaporates from the soil surface). Given: EC w 1 dS/m LF 0.15 Explanation: The concentration of the soil-water percolating below the root zone (ECsw) is equivalent to the concentration of the drainage water (ECdw) accumulating below the root zone. The salinity of the deep percolation from the bottom of the root zone (drainage water) can be estimated by using equation (3): EC EC dw EC w (3 ) sw LF EC dw 1 6.7 dS/m 0.15 The salinity of the soil-water that is percolating from the bottom of the root zone (ECdw) will be approximately 6.7 dS/m. Equation (3) can also be used to predict average soil-water salinity (ECsw) in the rooting depth if certain assumptions are made regarding water use within the root zone. The guidelines of Table 1 assume that 40, 30, 20 and 10 percent of the water used by the crop comes, respectively, from the upper to lower quarter of the rooting
  • 28. - 15 - 2.3 SALINITY EFFECTS ON CROPS depth. This water use pattern closely fits conditions found under normal irrigation practices. An illustration is given in Example 2 where the above water use pattern is used to estimate average soil- water salinity (ECsw). (4 ) (5 ) (6 ) EC = 3 ECwsw ECe = 1.5 ECw EC = 2 ECsw e The primary objective of irrigation is to provide a crop with adequate and timely amounts of water, thus avoiding yield loss caused by extended periods of water stress during stages of crop growth that are sensitive to water shortages. However, during repeated irrigations, the salts in the irrigation water can accumulate in the soil, reducing water available to the crop and hastening the onset of a water short- age. Understanding how this occurs will help suggest ways to counter the effect and reduce the probability of a loss in yield. The plant extracts water from the soil by exerting an absorptive force greater than that which holds the water to the soil. If the plant cannot make sufficient internal adjustment and exert enough force, it is not able to extract sufficient water and will suffer water stress. This happens when the soil becomes too dry. Salt in the soil-water increases the force the plant must exert to extract water and this additional force is referred to as the osmotic effect or osmotic If irrigation practices result in greater or less leaching than the 15-20 percent LF assumed in the guidelines of Table 1, a more correct concentration factor can be calculated using a new estimated average leaching fraction and the procedure illustrated in Example 2. Table 3 lists concentration factors for a wide range of leaching fractions (LF = 0.05 to 0.80). The predicted average soil salinity (ECe) is estimated by multiplying the irrigation water salinity (ECw) by the appropriate concentration factor for the estimated leaching fraction (see equation (8) in Table 3). These predicted average soil salinities reflect changes due to long-term water use and not short- term changes that may occur within a season or between irrigations. Figure 2 illustrates typical soil salinity profiles that can be identified and are typical of salinity distribution in the crop root zone after several years of irrigation with one water source and closely similar leaching fractions. Example 2 shows that with a 15 percent leaching fraction and a 40-30-20-10 water use patterm the average soil-water salinity (ECsw) is approximately 3.2 times more concentrated than the applied irrigation water. At a leaching fraction of 20 percent, the average ECsw is 2.7 times the salinity of the applied irrigation water (ECw). The guide- lines of Table 1 were developed assuming a 15-20 percent leaching fraction range which results in an average soil-water sal ini ty (ECsw) approximately 3 times that of the applied water. The soil-water salinity (ECsw) is the average root zone salihity to which the plant is exposed. It is difficult to measure. Salinity measurement is normally done on a saturation extract of the soil and referred to as the soil salinity (ECe). This soil salinity, (ECe), is approximately equal to one-half of the soil-water salinity (ECsw). As a general rule of thumb, at a 15-20 percent leaching fraction, salinity of the applied water (ECw) can be used to predict or estimate soil-water salinity (ECsw) or soil salinity (ECe) using the following equations:
  • 29. - 16 - EXAMPLE 2 - DETERMINATION OF AVERAGE ROOT ZONE SALINITY The average root zone salinity can be calculated using the average of five points in the rooting depth. The following procedure can be used to estimate the average root zone salinity to which the crop responds. t.10 ET t.40 ET Crop water demand (ET) 1000 mm/season. Desired leaching fraction (LF) 0.15. The leaching fraction of 0.15 means that 15,.percent of the applied irrigation water entering the surface percolates below the root zone and 85 percent replaces water used by the crop to meet its ET demand and water lost by surface evaporation. The crop water use pattern is 40-30- 20-10. This means the crop will get 40 percent of its ET demand from the upper quarter of the root zone, 30 percent from the next quarter, 20 percent from the next, and 10 percent from the lowest quarter. Crop water use will increase the concentration of the soil-water which drains into the next quarter (EC ) of the root zone. sw 1. Applied water salinity (EC ) = 1 dS/m. w 2. 3. ASSUlfi'TIONS 4. t.20 ET t.30 ET ,--------.lL----:Il--,. LFo ECswo -""'f"--------,iIrli'....... LF1 ECsw1 EXPLAHATION 1. Five points in the root zone are used to determine the average root zone salinity. These five points are soil-water salinity at (1) the soil surface, (ECswO); (2) bottom of the upper quarter of the. root zone, (ECsw1); (3) bottom of the second quarter depth, (ECsw2); (4) bottom of the third quarter, (ECsw3) and (5) bottom of the fourth quarter or the soil-water draining from the root zone (ECsw4) which is equivalent to the salinity of the drainage water (ECdw). 2. With a LF of 0.15, the applied water (AW) needed to meet both the crop ET and the LF is determined from the following equation: AW ET 1 LF = 1176 mm of water (7) 3. Since essentially all the applied water enters and leaches through the soil surface, effectively removing any accumulated salts, the salinity of the soil water at the surface (ECswO) must be very close to the salinity of the applied water as shown using equation (3) and assuming LFO = 1.0. EC w LF o 1 T 1 dS/m (3)
  • 30. - 17 - 5. The average soil-water salinity of the root zone is found by taking the average of the five root zone salinities found above: 1.5 dS/m EC EC =~=6.7dS/m sw4 LF4 EC EC = ~ = 2.5 dS/m sw 2 LF 2 EC EC = ~ = 4.3 dS/m sw3 LF3 EC EC w sw = LF 0.15 0.23 0.40 0.66 1176-.40(1000)-.30(1000)-.20(1000)-.10(1000) 1176 1176-.40(1000)-.30(1000) 1176 1176-.40(1000) 1176 Water leached Water applied at the bottom of the root zone (fourth quarter): = ..::1.=..17'-'6:....-..:..4.:..:0,..,(",1.=..00::..:0:"<)-;--7:'3"",0~(-=.10::..:0:.:0,-,,)_-::..:,2:.:0,,-(.=..10::..:0:.:0-,-) 1176 at the bottom of the second quarter: at the bottom of the third quarter: EC + EC + EC + EC + EC EC sWO sWl sW2 sW3 sW4 sw 5 EC 1.0+1.5+ 2.5 + 4.3 + 6.7 3.2 dS/m sw 5 LF 2 For the bottom of the first quarter: LF 6. This calculation shows that the soil-water draining below the root zone will be 3.2 times as concentrated as the applied water. 4. The salinity of the soil-water draining from the bottom of each root zone quarter is found by determining the leaching fraction for that quarter using equation (2) and then determining the soil-water salinity using equation (3).
  • 31. - 18 - Table 3 CONCENTRATION FACTORS (X) FOR PREDICTING SOIL SALINITY (ECe) 1 FROM IREIGATION WATER SALINITY (EO.) AND THE LEACHING FRACTION (LF) Leaching Fraction (LF) Applied Water Needed (Percent of ET) Concentration Factor 2 (X) 0.05 0.10 0.15 0.20 0.25 0.30 0.40 0.50 0.60 0.70 0.80 105.3 111.1 117.6 125.0 133.3 142.9 166.7 200.0 250.0 333.3 500.0 3.2 2.1 1.6 1.3 1.2 1.0 0.9 0.8 0.7 0.6 0.6 1 The equation for predicting the soil salinity expected after several years of irrigation with water of salinity ECw is: EC (dS/m) = EC (dS/m)' X e w (8) 2 The concentration factor is found by using a crop water use pattern of 40-30-20-10. The procedure is shown in example 2. ..LF .1 ..LF .15 tLF.2 +LF.4 a 100 25 .<: 0... Assumed water use'0 0' pattern " 50 ~T"0 o 30 0 i 20 0 ~ -0 "e 75 0 0.5 1.0 2.0 3.0 4.0 5.0 ECa (dS/m) Fig. 2 Salinity profile expected to develop after long-term use of water of ECw = 1.0 dS/m at various leaching fractions (LF)
  • 32. - 19 - potential. For example, if two otherwise identical soils are at the same water content but one is salt-free and the other is salty, the plant can extract and use more water from the salt-free soil than from the salty soil. The reasons are not easily explained. Salts have an affinity for water. If the water contains salt, more energy per unit of water must be expended by the plant to absorb relatively salt-free water from a relatively salty soil-water solution. For all practical purposes, the added energy required to absorb water from the salty soil (osmotic potential) is additive to the energy required to absorb water from a salt-free soil (soil-water potential). The cumulative effect is illustrated in Figure 3 and results in an important reduction in water available to the crop as salinity in- creases. Salinity effects are closely analogous to those of drought as both result in water stress and reduced growth. Stunting, leaf damage and necrosis or obvious injury to the plant are only noticeable after prolonged exposure to relatively high salinity. The previous discussion showed how the concentration of salts in the soil varied with leaching fraction and depth in the root zone and resulted in an increase in concentration as the leaching fraction decreases or with increasing depth in the root zone. As the soil dries, the plant is also exposed to a continually changing water availability in each portion of the rooting depth since the soil-water content (soil-water potential) and soil-water salinity (osmotic potential) are both changing as the plant uses water between irrigations. The plant absorbs water but most of the salt is excluded and left behind in the root zone in a shrinking volume of soil-water. Figure 4 shows that following an irrigation, the soil salinity is not constant with depth. Following each irrigation, the soil-water content at each depth in the root zone is near the maximum, and the concentration of dissolved salts is near the minimum. Each changes, however, as water is used by the crop between irrigations. The plant exerts its absorptive force throughout the rooting depth and takes water from wherever most readily available (the least resistance to absorption). Usually this is the upper root zone, the area most frequently replenished by irrigation and rainfall. Since more wa ter passes through this upper root zone, it is more thoroughly leached and the osmotic or salinity effects are much less than at greater depths. Between irrigations, the upper root zone dries more rapidly than the lower because of the proliferation of roots in this zone which extract the readily available soil moisture. The plant must then meet more of its water demand from increasingly greater depths as the upper soil-water is depleted. Both the soil moisture at depth and the soil moisture remaining in the upper portions have a higher soil- water salinity and thus a greater osmotic potential. As the plant depletes the soil-water, a water extraction pattern develops. The extraction pattern of 40, 30, 20 and 10 percent for the upper to lower quarters of the root zone is assumed in the guidelines in Table 1. This closely fits water extraction patterns under normal irrigation prac- tices and is assumed throughout this paper. The pattern for water uptake is closely related to the frequency of irrigation. With infrequent irrigations, as assumed for the guide- lines in Table 1, the typical extraction pattern is 40-30-20-10, but for more f~equent irrigations the water uptake pattern is skewed towards greater uptake from the upper root zone and less from the lower and the crop rooting depth tends to be at shallower depths. A typical e~traction pattern might be 60-30-7-3. Whatever the frequency, irriga- tlons must be timed to supply adequate water and prevent crop moisture stress between irrigations, especially if soil salinity is also affecting water availability.
  • 33. - 22 - ECe in dS/m 0 10 20 30 40 50 60 70 80 0 10 20 30 Profile N~ 3 40 Depth (cm) ECe (dS/m) 0-20 56.6 E 50 20-35 4.4() c 35-75 1.9 60 75-90 2.3.J:: -c. 90 (saturated) 5.4Q) 70 0 80 90 100 -- -e<- 'lIa~ ~e-= 110 ,0'0 __ --- 120 --- Fig. 5 Salinity profile with a high water table (Mohamed and AIDer 1972) mm/day 0 2 3 4 5 6 0 CLA'I LOAM 100 200 E u .s 300 .<: 0.Q) " Surfoce soil- woter 400 Potentloi =-16 bors 500 Fig. 6 600 Relation between capillary flow velocity and depth of water table (Van Hoorn 1979)
  • 34. - 23 - reclamation, the permanent cropping pattern will be determined by water quality. In a few instances, an alternative water supply may be available for periodic use or can be blended with a poorer water supply to diminish a quali ty-related hazard. These al ternati ves, including drainage, leaching, cropping changes and cultural practices, will be discussed in more detail in the following sections. 2.4.1 Drainage Salinity problems encountered in irrigated agriculture are very frequently associated with an uncontrolled water table within one to two metres of the ground surface (Figure 5). In most soils with a shallow water table, water rises into the active root zone by capillarity and, if the water table contains salts, it becomes a continual source of salts to the root zone as water is used by the crop or evaporates at the soil surface. Salinization from this source can be rapid in irrigated areas in hot climates where portions of the land remain fallow for extended periods. The rate of soil salinity accumulation from an uncontrolled shallow water table will depend upon irrigation management, salt concentration and depth of the groundwater, soil type, and climatic conditions. Figure 6 shows that capillary rise from a shallow water table can represent a sizeable salt input into the root zone. In arid and semi-arid climates, a salinity problem caused or complicated by poor drainage cannot be adequately controlled until the water table is stabilized and maintained at a safe depth - usually at least two metres. This requires open or tile drains or drainage wells to remove a part of the salty subsurface water and transport it to an acceptable salt-sink for safe disposal. When drainage is adequate, salinity related directly to water quality and irrigation management becomes a problem only if the salts applied with the irrigation water are allowed to accumulate to a concentration which reduces yield. Effective salinity control, therefore, must include adequate drainage to control and stabilize the water table and leaching as needed to reduced the accumulated salts. A net downward flux of surface applied water to. achieve the required leaching will then control the salinity. The guidelines in Table 1 and the remainder of the discussion in this paper assume that all salts accumulating in the crop root zone corne from the applied water. This means drainage is adequate and salinity management is a significant part of irrigation manage- ment. 2.4.2 Salinity Control by Leaching When the build-up of soluble salts in the soil becomes or is expected to become excessive, the salts can be leached by applying more water than that needed by the crop during the growing season. This extra water moves at least a portion of the salts below the root zone by deep percolation (leaching). Leaching is the key factor in controlling soluble salts brought in by the irrigation water. Over time, salt removal by leaching must equal or exceed the salt additions from the applied water or salts will build up and eventually reach damaging concentrations. The questions that arise are how much water should be used for leaching and when should leachings be applied?
  • 35. - 24 - i. The leaching requirement' To estimate the leaching requirement, both the irrigation wate sal ini ty (ECw) and the crop tolerance to soil salinity (ECe must be known. The water salinity can be obtained from labora tory analysis while the ECe should be estimated from appropriat crop tolerance data given in the tables in Section 2.4.3 of thi paper. These tables give an acceptable ECe value for each cro appropriate to the tolerable degree of yield loss (usually 1 percent or less). The necessary leaching requirement (LR) can be estimated from Figure 7 for general crop rotations. For more exact estimate for a particular crop, the leaching requirement equation (9 (Rhoades 1974; and Rhoades and Merrill 1976) should be used: (9 EC wLR = 5 (ECe ) - ECw = the minimum leaching requirement needed to control sal ts wi thin the tolerance (ECe) o the crop with ordinary surface methods o irrigation LRwhere: EC w = salinity of the applied irrigation water in dS/m EC e average soil salinity tolerated by the cro as measured on a soil saturation extract Obtain the ECe value for the given crop an the appropriate acceptable yield from Tabl 4. It is recommended that the ECe value tha can be expected to result in at least a 9 percent or greater yield be used in th calculation. (Figure 7 was developed using ECe values for the 100 percent yield poten tial.) For water in the moderate to high salinity range (> 1.5 dS/m) , it might b better to use the ECe value for maximum yield potential (100 percent) since salinity con trol is critical to obtaining good yields. The total annual depth of water that needs to be applied to mee both the crop demand and leaching requirement can be estimate from equation (7). AW = ET 1 - LR ( 7 where: AW ET LR = depth of applied water (mm/year) = total annual crop water demand (mm/year) leaching requirement expressed as a fraction (leaching fraction) In many texts, the Terms 'leaching fraction (LF)' and 'leaching requirement (LR)' are used interchangeably. They both refer to tha portion of the irrigation which should pass through the root zone t control salts at a specific level. While LF indicates that the valu be expressed as a fraction, LR can be expressed either as a fraction or percentage of irrigation water.
  • 36. 10B Assumed crop we fer use pattern 642 Salinity of applied water (ECw) in dS/m Effect of applied tvater salinity (ECw) upon root zone soil salinity (ECe) at various leaching fractions (LF) Fig. 7 The timing of leachings does not appear to be critical provided crop tolerance is not exceeded for extended or critical periods of time. This certainly does not mean that leaching is rela- tively unimportant. The leaching requirement must be satisfied to prevent excessive salt accumulation. Leaching can be done at - 25 - Unsuitable ------- 10 It takes time to accumulate salts in the root zone to a concen- tration that reduces yield. Most irrigacion water is of such good quality that, without leaching, two or more years of irrigation will be required before salinity accumulates suff- iciently to affect yield. Further, the later in the growing season the salts reach damaging concentrations, the less will be their effect. This suggests that if salts are low enough at the start of the irrigation season, efficiency of water use during the growing season can be 100 percent (no leaching) without loss of yield due to salinity. For the next season, rainfall, dormant season and pre-plant irrigations, singly or in combination, can be used to replenish deep soil moisture and leach soils free enough of accumulated salts to allow efficient water use again during the next growing season. It is often difficult to supply both essential crop water and leaching water during the hot summer season. The key factor to remember is that leaching is not needed until accumulating salinity is expected to exceed crop tolerance and reduce yield. Tolerant crops E 8 "- en "t:> c -- -- .. 6 u w Moderately i':' tolerant crops 'E 0 4 "' - - -- 0 en Moderately 2 sensitive crops - - - - Sensitive crops - - - - ii. Timing of leachings
  • 37. - 26 - each irrigation, each alternate irrigation or less frequentl such as seasonally or at even longer intervals, as necessary keep salinity below the threshold above which yields may unacceptably reduced. In many instances, the usual ineff ciencies of water application satisfy the leaching requireme and additional leaching is wasteful of water (see Example 3 Where low leaching fractions «0.10) are needed, as with go quality water, inefficiencies in irrigation water applicati will almost always apply sufficient extra water to accompli leaching. In other instances, particularly with higher salini water, meeting the leaching requirement is difficult a requires large amounts of water, possibly adding to a draina problem. It can be assumed that an appreciable portion of t total deep percolation losses from normal irrigation practic is useful in controlling salinity. EXAIfi'LE 3 - LEACHING REQUIREMENT CALCULATION A maize crop is irrigated by furrow irrigation. The crop is planted in a uniform loam soil and river water, which has an ECw = 1.2 dS/m, is used for irrigation. Th crop evapotranspiration (ET) is 800 rom/season. The irrigation application efficiency is 0.65. Therefore the total amount of water that must be applied to meet crop ET demand is 800 rom/0.65 = 1230 rom/season. How much additional water must be applied for leaching? Given: EC 1.2 dS/m ECw 2.5 dS/m (from Table 4 for maize at a 90 percent yielde potential) EC 1. 7 dS/m (from Table 4 for maize at a 100 percent yielde potential) Explanation: The leaching requirement can he calculated using equation (9) and substituting the appropriate Eee value for the desired yield potential (from Table 4). EC 1.2 0.10 (for a 90 percentLR w (9 5(EC ) - EC 5(2.5) - 1.2 yield potential)e w LR 1.2 0.16 (for a 100 percent yield potential) 5(1.7) 1.2 The actual amount of water to he applied to supply both crop ET and leaching (long-term salt control) can be found by using equation (7) AW ET 1 - LR 800 1 0.10 890 rom/season (7 Since a 1230 mm depth of applied water is needed to ensure that the maize crop is adequately irrigated to meet the 800 rom ET demand and, since this 1230 rom is in excess of the calculated depth of 890 mm required to meet both crop E1' demand and the leaching requirement, the question arises whether the losses in excess of ET are deep percolatiqn losses and whether these losses may be satisfying the leaching requirement. Water losses due to deep percolation are often greatly in excess of the leaching fraction of 0.15 assumed in the crop tolerance tables (Table 4) as being typical of efficient irrigated agriculture. If, in this example, the losses are due to deep percolation, no additional leaching to control salinity is necessary since the required leaching fraction of 0.10 or 0.16, as calculated above, will be satisfied by irrigation inefficiency (losses) during water application.
  • 38. - 27 - Rainfall must be considered in estimating the leaching require- ment. Rainfall that enters the soil is effective in meeting both crop ET and the leaching requirement. Rainfall that infiltrates into the soil (effective rainfall) replaces ET losses. If in excess of ET, it becomes drainage water and will satisfy part or all of the leaching needed to control salts. The advantage of rainfall in accomplishing all or part of the leaching is that it uniformly applies an almost salt-free water (ECw < 0.05 dS/m). Leaching is further enhanced if the rate of rainfall is below the infiltration rate of the soil. If the total amount of rain- fall infiltrated is sufficient, it will reduce the average salinity used for the applied water (ECw) in calculating the leaching requirement (LR) and thus reduce proportionately the required leaching. Figure 8 shows how rainfall quickly ~educes the salinity in the crop root zone. In low rainfall years or low rainfall areas, precipitation may not be adequate to refill the soil to its water holding capa- city, in which case no leaching occurs to reduce accumulated salinity other than to move the salts from the upper part of the root zone deeper into the soil. The upper portions of the root- ing depth will then reflect the very low salinity levels of the rainfall which can enhance germination. In areas where rainfall occurs in the cooler months or winter season, it may be possible to enhance winter leaching even in a dry year. It is recommended that a heavy autumn or early winter irrigation be given to refill the soil profile with water before the rains. Winter rains will then complete the soil-water re- plenishment and accomplish all or part of the required leaching with low-salt water. If the rewetting or leaching is still not complete by crop planting time, the deep percolation losses from extended early season irrigations may accomplish the soil rewet- ting and salt leaching. Figure 9 shows how winter rains have leached salts from citrus p~antings in Cyprus. The leaching requirement can be calculated (Equation 9) but we can only make estimates of the amount of leaching that is actu- ally taking place. Soil and crop monitoring are useful tools to determine the need for leaching. Considerable variation occurs from one cropping season to the next; therefore, monitoring should stress long-term trends and changes in soil salinity. Several studies, field trials and observations suggest proce- dures that might increase the efficiency of leaching and reduce the amount of water needed. These will not be covered in detail here but will be mentioned as they apply to many irrigation situations: leach during the cool season instead of the warm to increase the efficiency and ease of leaching since the ET losses are lower; use more salt tolerant crops which require a lower LR and thus a lower total water demand; use tillage to slow overland water flow and reduce the number of surface cracks which bypass flow through large pores and decrease efficiency in leaching; use sprinkler irrigation at an application rate below the soil infiltration rate which favours unsaturated flow which is appreciably more efficient than saturated flow
  • 39. 20 40 60 E ~ 80 E-m ~ 100 120 140 160 ECe (dS/ml 2 3 4 5 - 28 - 25 50 75 E 100 .:: ~ c. ~ 125 150 175 200 225 ECe (dSlm) 2 3 4 P, I I I I I I I I ~~ I I I I N, I ,, ~~, I A~ter wmter , I rainfall q~ •~ ' ' h..,~ '.. S"" 5 0---09/ o n C>- __ <) 0---00 Fig. 8 Soil salinity (ECe) of a sandy-loam soil before and after 150 mm of rainfall (Aziz 1968) Fig. 9 Soil salinity (ECe) profiles at th end of the irrigation season an after winter rainfall in citru plantings (Stylianou 1970 for leaching. More irrigation time but less water i required than for continuous ponding (Oster et al. 1972) use alternate ponding and drying instead of continuou ponding. More efficient in leaching (Oster et al. 1972 and uses less water but the time required to leach i greater. May have drawbacks in areas with a high wate table which allows secondary salinization betwee pondings; where possible, schedule leachings at periods of low cro water use or postpone leachings until after the croppin season; avoid fallow periods particularly during hot summer where rapid secondary soil salinization from high wate tables can occur; if infiltration rates are low, consider pre-plantin irrigations or off-season leaching to avoid excessiv water applications during the crop season,
  • 40. - '29 - use an irrigation before the start of the rainy season if total rainfall is normally expected to be insufficient to do a complete leaching. Rainfall is often the most effi- cient leaching method because it provides high quality water at relatively low rates of application. iii. Monitoring A good irrigation management plan strives to apply sufficient water to meet the crop water demand plus the leaching require- ment without wastage. Both the crop water demand and leaching requirement can be estimated and the depth of applied water needed can be calculated. In many instances, however, estimates of depth of applied water (flow rate, duration and area covered) are inaccurate or not available, making estimates of effective- ness of leaching for salinity control unreliable. Existing conditions and reliable estimates of past management can be determined with a reasonable degree of certainty by means of soil samples, analysed for salinity. From the soil samples an apparent leaching fraction as well as an average root zone salinity resulting from past irrigation practices can be determined. The following procedure is suggested: a. Estimate the probable depth of rooting of the last crop grown - from observation (pit, hole, soil samples, etc.), or from past experience. Depth estimate should include 75 to 85 percent of the observed root zone. b. Take representative soil samples from each quarter depth of root zone and analyse each quarter depth separately for ECe by the soil paste extraction method of the US Salinity Laboratory (USDA 1954). c. Plot by a graph similar to that of Figure 2 for the soil depth and salinity representative of each quarter depth of root zone and compare this curve with the curves depicting the various typical leaching fractions (LF = 0.1, 0.15, 0.2, 0.3, 0.4) in the graph. Then, estimate a leaching fraction for the site sampled based on the shape of the salinity profile. d. From the ECe of the four soil samples (one from each quarter depth of the root zone) calculate the average root zone salinity and compare with the crop tolerance ECe values in Table 4 for the crops to be planted. e. From the apparent leaching fraction and the average ECe of the root zone, make any necessary management decisions to adj ust irrigations to increase or decrease the leaching fraction in order to stay close to the tolerance of the preferred crop. Alternatively, change the crop to agree more closely with the existing salinity conditions. 2.4.3 Crop Tolerance to Salinity All plants do not respond to salinity in a similar manner; some crops can produce acceptable yields at much greater soil salinity than others. This is because some are better able to make the needed osmotic adjustments enabling them to extract more water from a saline soil. The
  • 41. - 30 - ability of the crop to adjust to salinity is extremely useful. In areas where a build-up of soil salinity cannot be controlled at an acceptable concentration for the crop being grown, an alternative crop can be selected that is both more tolerant of the expected soil salinity and can produce economical yields. There is an 8 to 10-fold range in salt tolerance of agricultural crops. This wide range in tolerance allows for a much greater use of moderately saline water much of which was previously thought to be unusable. It also greatly expands the acceptable range of water salinity (ECw) considered suitable for irrigation. The relative salt tolerance of most agricultural crops is known well enough to give general salt tolerance g~idelines. Tolerances for many common field, vegetable, forage and tree crops are given in Table 4. This table has been updated from the 1976 edition and gives the latest tolerance values for crops grown under semi-arid irrigated agriculture. Where insufficient data exist to give numerical values for tolerance, a relative rating has been assigned~ to the crop, based on field experience, limited data or observations. For comparative purposes, relative tolerance ratings are listed in Table 5 for a large number of crops, including many of those given in Table 4. General groupings for tolerance are shown in the schematic diagram in Figure 10. The relative tolerance ratings, even if based on a limited amoun of data, are useful for comparisons among crops. The relative crop tolerance ratings were considered in setting the degrees of 'restriction on use' in the guidelines of Table 1. For example, the tolerance data of Table 4 indicate that a full yield potential should be obtainable for nearly all crops when using a water which has a salinity less than 0.7 dS/m. The guidelines of Table 1 indicate that water of this salinity would have no restriction on use. For the salinity listed in the slight to moderate range, a full yield potential is still possible but care must be taken to achieve the required leaching fraction in order to maintain soil salinity wi thin the tolerance of the crop. For higher salinity water and sensitive crops, increasing the leaching to satisfy a leaching requirement greaster than 0.25-0.30 may not be practical because of the excessive amount of water required. In such a case, consideration must be given to changing to a more tolerant crop that will require less leaching to control salts within crop tolerance. As the water salinity (ECw) increases within the slight to moderate range, production of the more sensitive crops may be restricted due to an inability to achieve the high leaching fraction needed, especially when grown on the heavier, more clayey soil types. If the salinity of the applied water exceeds 3.0 dS/m, as shown in Table 1 for a severe restriction on use, the water may still be usable but its use may need to be restricted to more permeable soils and more salt tolerant crops where the high leaching fractions are more easily achieved. The salt tolerance data of Table 4 are used in the calculation of the leaching requirement. Figure 7 can also be used to estimate the leaching requirement if crop tolerance grouping and water salinity are known, as discussed in the previous section. If the exact cropping patterns or rotations are not known for a new area, the leaching requirement must be based on the least tolerant of the crops adapted to the area. In those instances where soil salinity cannot be maintained within acceptable limits of preferred sensitive crops, changing to more tolerant crops will raise the area's production potential. In case of doubt as to the effect of the water salinity on crop production, a pilot study should be undertaken to demonstrate the feasibility for irrigation and the outlook for economic success.
  • 42. 0% FIELD CROPS 100% 90% 75% 50% "maximum" 3 EC EC EC EC EC EC EC EC EC EC e w e w e w e w e w Barley {Hordewn vulgCll'eJ 4 8.0 5.3 10 6.7 13 8.7 18 12 28 19 Cotton {Gossypium hirsutwn} 7.7 5.1 9.6 6.4 13 8.4 17 12 27 18 Sugarbeet (Beta vulgaris) 5 7.0 4.7 8.7 5.8 11 7.5 15 10 24 16 Sorghum (Sorghum bicolor) 6.8 4.5 7.4 5.0 8.4 5.6 9.9 6.7 13 8.7 Wheat (Triticum aestivum) 4,6 6.0 4.0 7.4 4.9 9.5 6.3 13 8.7 20 13 Wheat, durum (TritirYo-im turgidwn) 5.7 3.8 7.6 5.0 10 6.9 15 10 24 16 Soybean (Glycine max) 5.0 3.3 5.5 3.7 6.3 4.2 7.5 5.0 10 6.7 Cowpea (Vigna unguiculata) 4.9 3.3 5.7 3.8 7.0 4.7 9.1 6.0 13 8.8 Groundnut (Peanut) 3.2 2.1 3.5 2.4 4.1 2.7 4.9 3.3 6.6 4.4 (Arachis hypogaea) Rice (paddy) fOriza sativa) 3.0 2.0 3.8 2.6 5.1 3.4 7.2 4.8 11 7.6 Sugarcane (SaccharLun officincLPum) 1.7 1.1 3.4 2.3 5.9 4.0 10 6.8 19 12 Corn (maize) (Zea mays) 1.7 1.1 2.5 1.7 3.8 2.5 5.9 3.9 10 6.7 Flax (Limun usitatissimum) 1.7 1.1 2.5 1.7 3.8 2.5 5.9 3.9 10 6.7 Broadhean IVicia faba) 1.5 1.1 2.6 1.8 4.2 2.0 6.8 4.5 12 8.0 Bean (Phaseolus vulgaris) 1.0 0.7 1.5 1.0 2.3 1.5 3.6 2.4 6.3 4.2 VEGETABLE CROPS Squash, zucchini (courgette) 4.7 3.1 5.8 3.8 7.4 4.9 10 6.7 15 10 (Cuc:urbita pepo melopepo) Beet, red (Beta vulgaris) 5 4.0 2.7 5.1 3.4 6.8 4.5 9.6 6.4 15 10 Squash, scallop 3.2 2.1 3.8 2.6 4.8 3.2 6.3 4.2 9.4 6.3 (Cuc:urbita pepo me lopepo) Broccoli 2.8 1.9 3.9 2.6 5.5 3.7 8.2 5.5 14 9.1 {Brassica oleracea botrytisJ Tomato (Lycopel~sicon esculentwnJ 2.5 1.7 3.5 2.3 5.0 3.4 7.6 5.0 13 8.4 Cucumber (Cuaumis sativus) 2.5 1.7 3.3 2.2 4.4 2.9 6.3 4.2 10 6.8 Spinach (Spinacia oleracea) 2.0 1.3 3.3 2.2 5.3 3.5 8.6 5.7 15 10 Celery (Apium gl'aveo lens) 1.8 1.2 3.4 2.3 5.8 3.9 9.9 6.6 18 12 Cabbage 1.8 1.2 2.8 1.9 4.4 2.9 7.0 4.6 12 8.1 (Brassica oleracea capitata) Potato (Solanum tt,beroswn) 1.7 1.1 2.5 1.7 3.8 2.5 5.9 3.9 10 6.7 Corn, sweet (maize) (Zea mays] L7 1.1 2.5 1.7 3.8 2.5 5.9 3.9 10 6.7 Sweet potato (Impomoea batatas) 1.5 1.0 2.4 1.6 3.8 2.5 6.0 4.0 11 7.1 Pepper (Capsienun annuum) 1.5 La 2.2 1.5 3.3 2.2 5.1 3.4 8.6 5.8 . Lettuce (Lacttlca sativa) 1.3 0.9 2.1 1.4 3.2 2.1 5.1 3.4 9.0 6.0 Radish (Raphanus sativus) 1.2 0.8 2.0 1.3 3.1 2.1 5.0 3.4 8.9 5.9 Onion IAni!Un cepa) 1.2 0.8 1.8 1.2 2.8 1.8 4.3 2.9 7.4 5.0 Carrot (Dccuents cal'ota) 1.0 0.7 1.7 1.1 2.8 1.9 4.6 3.0 8.1 5.4 Bean (Phaseolus vulgaJ.'is) La 0.7 1.5 1.0 2.3 1.5 3.6 2.4 6.3 4.2 Turnip (Brassica rapa) 0.9 0.6 2.0 1.3 3.7 2.5 6.5 4.3 12 8.0 Table 4 - 31 - CROP TOLERANCE AND YIELD POTENTIAL OF SELECTED CROPS AS INFLUENCED BY IRRIGATION WATER SAlINITY (EC ) OR SOIL SAlINITY (EC ) I W e Y I E L D POT E N T I A L2
  • 43. Table 4 (continued) - 32 - Y I E L D POT E N T I A L 0% FORAGE CROPS 100% 90% 75% 50% "maximum" EC EC EC EC EC EC EC EC EC EC e w e w e w e w e w WheatgrasB, tall 7.5 5.0 9.9 6.6 13 9.0 19 13 31 21 (Agropyron e lOll{JatwnJ WheatgrasB, fairway crested 7.5 5.0 9.0 6.0 II 7.4 15 9.B 22 15 (Agropyron cristatumJ Bermuda grass ICynodan dactyZon) 7 6.9 4.6 B.5 5.6 II 7.2 15 9.B 23 15 Barley (forage) (Hordeum vulgare) Ii 6.0 4.0 7.4 4.9 9.5 6.4 13 B.7 20 13 RyegrasB, perennial (Lolium perenne) 5.6 3.7 6.9 4.6 B.9 5.9 12 B.l 19 13 Trefoil,oarrowleaf birdsfoot B 5.0 3.3 6.0 4.0 7.5 5.0 10 6.7 15 10 (Lotus 'coI'niaulatus tenui'foliwn) Harding grass IPhaZaris tuherosaJ 4.6 3.1 5.9 3.9 7.9 5.3 II 7.4 IB 12 Fescue, tall (Festuca elatiorJ 3.9 2.6 5.5 3.6 7.B 5.2 12 7.B 20 13 Wheatgras8, standard crested 3.5 2.3 6.0 4.0 9.B 6.5 16 II 2B 19 (Agropyron sibiriauml Vetch, common {Vioia angustifolial 3.0 2.0 3.9 2.6 5.3 3.5 7.6 5.0 12 B.l Sudan grass rSorglrum Budanense} 2.B 1.9 5.1 3.4 B.6 5.7 14 9.6 26 17 Wildrye, beardless 2.7 l.B 4.4 2.9 6.9 4.6 II 7.4 19 13 (Elymus triti'coi'des) Cowpea (forage) (Vigna ungui'culatal 2.5 1.7 3.4 2.3 4.B 3.2 7.1 4.B 12 7.B Trefoil, big (Loms u'liginoBus) 2.3 1.5 2.B 1.9 3.6 2.4 4.9 3.3 7.6 5.0 Sesbania (Beabania exaltataJ 2.3 1.5 3.7 2.5 5.9 3.9 9.4 6.3 17 II Sphaerophysa ISphaerophysa saZfJUZa) 2.2 1.5 3.6 2.4 5.B 3.B 9.3 6.2 16 II Alfalfa (Medicago sativa) 2.0 1.3 3.4 2.2 5.4 3.6 B.B 5.9 16 10 LovegrasB (Eragrostis Sp.}9 2.0 1.3 3.2 2.1 5.0 3.3 B.O 5.3 14 9.3 Corn (forage) (maize) IZea mays) 1.B 1.2 3.2 2.1 5.2 3.5 B.6 5.7 15 10 Clover, berseem 1.5 1.0 3.2 2.2 5.9 3.9 10 6.B 19 13 (Trifolium alexandrint~) Orchard grass (Dactylis glomerata) 1.5 1.0 3.1 2.1 5.5 3.7 9.6 6.4 IB 12 Foxtail, meadow 1.5 1.0 2.5 1.7 4.1 2.7 6.7 4.5 12 7.9 (Alopecuru6 pratensi"s) Clover, red (Tl'ifolium pratense) 1.5 1.0 2.3 1.6 3.6 2.4 5.7 3.B 9.B 6.6 Clover, aleike ITrifoUwn hybridwnJ 1.5 1.0 2.3 1.6 3.6 2.4 5.7 3.B 9.B 6.6 Clover, ladino (TrifoliL~ repens) 1.5 1.0 2.3 1.6 3.6 2.4 5.7 3.B 9.B 6.6 Clover, strawberry 1.5 1.0 2.3 1.6 3.6 2.4 5.7 3.B 9.B 6.6 ITrifoUwn fragiferwn) FRUIT CROps lO Date palm (Phoenix dactylifera) 4.0 2.7 6.B 4.5 II 7.3 IB 12 32 21 Grapefruit (Citrus paradisi) 11 I.B 1.2 2.4 1.6 3.4 2.2 4.9 3.3 B.O 5.4 Orange (Citrus sinensi's) 1.7 1.1 2.3 1.6 3.3 2.2 4.B 3.2 B.O 5.3 Peach (Prunus persica) 1.7 1.1 2.2 1.5 2.9 1.9 4.1 2.7 6.5 4.3 Apricot (Prunus armeniaca) 11 1.6 1.1 2.0 1.3 2.6 l.B 3.7 2.5 5.B 3.B Grape (Vitus Sp.}l1 1.5 1.0 2.5 1.7 4.1 2.7 6.7 4.5 12 7.9 Almond (PrunuB dulcis) 11 1.5 1.0 2.0 1.4 2.B 1.9 4.1 2.B 6.B 4.5
  • 44. - 33 - Table 4 (continued) Y I B L D POT E N T I A L 10 These data are applicable when rootstocks are used that do not accumulate Na+ and Cl- rapidly or when these ions do not predominate in the soil. If either ions do, refer to the toxicity discussion in Section 4. 0% FRUIT CROPS 10 100% 90% 75% 50% "maximum"" EC EC Bc EC BC EC BC EC EC BC e w e w e w e w e w Plum, prune (Prunus domestica) 11 1.5 1.0 2.1 1.4 2.9 1.9 4.3 2.9 7.1 4.7 Blackberry (Rubus 8p.) 1.5 1.0 2.0 1.3 2.6 1.8 3.8 2.5 6.0 4.0 Boysenberry (Rubus Ul~sinuB) 1.5 1.0 2.0 1.3 2.6 1.8 3.8 2.5 6.0 4.0 Strawberry (Fragar~a sp.) 1.0 0.7 1.3 0.9 1.8 1.2 2.5 1.7 4 2.7 2 4 7 1l Adapted from Maas and Hoffman (1977) and Maas (1984). These data should only serve as a guide to relative tolerances among crops. Absolute tolerances vary depending upon climate, soil conditions and cultural practices. In gypsiferou6 soils, plants will tolerate about 2 dS/m higher soil salinity (ECe) than indicated but the water salinity (ECw) will remain the same 8S shown in this table. EGe means average root zone salinity as measured by electrical conductivity of the saturation extract of the soil, reported in deciSiemens per metre (dS/m) at 25 D C. ECw means electrical conductivity of the irrigation water in deciSiemens per metre (dS/m). The relationship between soil salinity and water salinity (ECe = 1.5 ECw) assumes a 15-20 percent leaching fraction and a 40-30-20-10 percent water use pattern for the upper to lower quarters of the root zone. These assumptions were used in developing the guidelines in Table 1. The zero yield potential or maximum ECe indicates the theoretical soil saU.nity (ECe) at which crop growth ceases. Barley and wheat are less tolerant during germination and seedling stagej ECe should not exceed 4-5 dS/m in the upper soil during this period. Beets are more sensitive during germinationj ECe should not exceed 3 dS/m in the seeding area for garden beets and sugar beets. Semi-dwarf, short cultivars may be less tolerant. Tolerance given is an average of several varietiesj Suwannee and Coastal Bermuda grass are about 20 percent more tolerant, while Common and Greenfield Bermuda grass are about 20 percent less tolerant. Broadleaf Birdsfoot Trefoil seems less tolerant than Narrowleaf Birdsfoot Trefoil. Tolerance given is an average for Boer, Wilman, Sand and Weeping LovegraSBj Lehman Lovegras8 seems about 50 percent more tolerant. Tolerance evaluation is based on tree growth and not on yield.
  • 45. MODERATELY TOLERANT' MODERATELY SENSITIVE' RELATIVE SALT TOLERANCE OF AGRICULTURAL CROPS ',' Grasses and Forage Crops Helianthus tuberoaua Beta vulgcuis Cucurbita pepo melopepo Ficus carica Ziziphus jujuba Olea europaea CQ1~ica papaya Ananas comosus Punica grananun Vioia faba Ricinus comrmmis Zea mays Lbnun usitatissimwn Setaria italica Apachis hypogaea Ol~yza sativa Saccarwn officinarlun He liantlms annuus Medicago sativa Agrostis stolonifel~ palustris Dicl-zanthilun aristatlu Brorrrus inermis Cenchrus ciliaria Potel~ium sanguisorba Trifolium hydJ~idlun Trifoli~un alexandrim Tl~ifolilun repens Tl'ifoliwn pratense Trifolizun fl'agifeT'lun Trifolil~ repens Zea mays Vigna unguiculata Paspalum di latanll7l Alopecurus pratensis BOHtelollQ gracilis Eragrostis sp. Astl~agalus cicer Al'rhel1atherL~.. Danthonia Avena sativa Agl~opY1"On intermediw Agropyron trachycaul Agropyron smithii Elymus tr{ ticoides Elyrm18 canadcmeis Bluestem, Angleton Brome, smooth Buffelgrass Burnet Clover. alsike Clover, Berseem Clover. ladino Clover, red Clover, strawberry Clover. white Dutch Corn (forage) (maize) Cowpea (forage) Dallia grass Foxtail, meadow Grama, blue Lovegrass Milkvetch, Cicer Oatgrass, tall Oats (forage) Alfalfa Bentgrass Grasses and Forage Crops Broadbean Cas torbean Maize Flax Millet, foxtail Groundnut/Peanut Rice, paddy Sugarcane Sunflower Fibre, Seed and Sugar Crops Fruit and Nut Crops Fig Jujube Olive Papaya Pineapple Pomegranate Vegetable Crops Artichoke Beet, red Squash, zucchini Wheatgrass, intermediate Wheatgrass, slender Wheatgrass, western Wildrye, beardless Wildrye, Canadian Grasses and Forage Crops MODEIlATIliY TOLERANT ~ 34 - Hordeum vulgcu'e Brormts ma1'ginatlls Phalaria.. aT'lmdinacea MelilotllS alba Melilonts Festllca plutensis Fesiluca elatior Phalaris tilberosa Fani'cllln antidotale Brasei'ca napus Bromus unioloides Chloris gayarza Lolil~ italicuIrI rmlltiflorwn Lolilun perenne Sorghum suclal'lense Lonls cornivulants tenuifolilun Lotus corn,ieulatits arveni-s Triti(!/.un aestivlun Agropyron sibil'icwn Asparagus offi'cinalis Vigna unguieulata Avena sativa Secale cel~eale CaI'thamus tinctorius Sorghwn bicolor Glycine max X Tri'ticosecale Triticum aestiv~vn Tri'tiewn nlT'g1:awn Hordeum vulgCU'e GOBsypiulTI hil~SUhun Sirrunoruisia chinensis Beta vulgaJ.~is AgropYl~on elongatlLlm Elymus angustlls Elyrmw junceus Sugar Crops Sugar Crops Ryegrass, perennial Sudan grass Trefoil, narrowleaf birdsfoot Trefoil. broadleaf birdsfoot Wheat (forage) Wheatgrass, standard crested Barley (forage) Brame. mountain Canary grass, reed Clover, Hubam Clover, sweet Fescue, meadow Fescue. tall Harding grass Panic grass. blue Rape Rescue grass Rhodes grass RyegrasB. Italian Fibre. Seed and Cowpea Oats Rye Safflower Sorghum Soybean Triticale Wheat Wheat, Durum TOLER.ANT3 Vegetable Crops Asparagus Barley Cotton Jojoba Sugarbeet Fruit and Nut Crops Date palm Phoenix dactylifel~a Grasses and Forage Crops Alkali grass, Nuttall Alccinellia airoides Alkali sacaton Sporobolu8 ai17 0ides Bermuda grass Cynodon dactylon Kallar grass Diplachne fusca Saltgras6, desert DistichZis stricta Wheatgrass, Ag17 opyron cristatum fairway crested WbeatgrasB) tall Wildrye, Altai Wildrye, Russian Fibre, Seed and Table 5