1. Relationship between Ozark stream phosphorus concentration
and macroinvertebrate taxonomic composition
Methods
• Seven sites were sampled November 2014 using a Hess sampler.
• Each sample was assessed in a laboratory to lowest taxonomical
value.
• After laboratory assessment occurred, we began by calculating percent
EPT taxa in each given site. Calculations were then made for percent
Chironomidae.
• Utilizing the USEPA Rapid Bioassessment Protocol, the amount of
pollution sensitive and pollution tolerant macroinvertebrates in each
stream was determined.
• Once the invertebrates were placed into tolerant and sensitive
categories, a comparison was made between sensitive and tolerant.
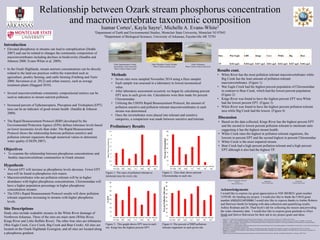
Results cont.
• White River has the most pollution tolerant macroinvertebrates while
Big Creek has the least amount of pollution tolerant
macroinvertebrates. (Figure 1)
• War Eagle Creek had the highest percent population of Chironomidae
in contrast to Bear Creek, which had the lowest percent population.
(Figure 2)
• Kings River was found to have the highest percent EPT taxa White
had the lowest percent EPT. (Figure 3)
• White River was found to have the highest percent pollution tolerant
taxa while Big Creek had the lowest. (Figure 4)
Works Cited
• Dodds, W. K. Trophic State, Eutrophication and Nutrient Criteria in Streams." Trends in Ecology & Evolution 22.12 (2007): 669-76. Print.
• Farthing, L., and D. Toetz. Downstream Changes in Nutrients in an Ozark Stream, Peacheater Creek, Oklahoma. Journal of Freshwater Ecology 15.2 (2000): 171-80. Print.
• Sandlin, L., and R. K. Johnson. "The Statistical Power of Selected Indicator Metrics using Macroinvertebrates for Assessing Acidification and Eutrophication of Running Waters."
Hydrobiologia 422/423 (2000): 233-43. Print.
• Evans-White, M. A., et al Thresholds in Macroinvertebrate biodiversity and stoichiometry across water-quality gradients in Central Plains (USA) streams. Journal of the North American
Benthological Society 2009 28 (4), 855-868. Print
• Stevonson, R., J., et al Phosphorus regulates stream injury by filamentous green algae, DO and pH with thresholds in responses. Hydrobiology 695. (2012): 25-42 Print
• Haggard, B. E. Phosphorus Concentrations, Loads, and Sources within the Illinois River Drainage Area, Northwest Arkansas, 1997-2008. Journal of Environmental Equality 39. 6
(2010): 2113-2120 Print.
• USEPA. Protocol for monitoring aquatic macroinvertebrates at Ozark National Scenic Riverways, Missouri, and Buffalo National River, Arkansas. (2007): Print.
Acknowledgements
I would like to express my great appreciation to NSF BIOREU grant number
1359188 for funding my project. I would also like to thank the USGS grant
number USGS/G11AP20066 I would also like to express thanks to Amber Roberts
and Harrison Smith for helping with data collection and quantifying results.
Ashley Rodman and Dr. Thad Scott’s lab for collecting the insects and providing
the water chemistry data. I would also like to express great gratitude to Allyn
Dodd and Halvor Halvorson for their aid in my project goals and ideas.
Introduction
• Elevated phosphorus in streams can lead to eutrophication (Dodds
2007) and can be related to changes the community composition of
macroinvertebrates including declines in biodiversity (Sandlin and
Johnson 2000; Evans-White et al. 2009).
• In the Ozark Highlands, stream nutrient concentrations can be directly
related to the land use practices within the watershed such as
agriculture, poultry farming, and cattle farming (Farthing and Toetz
2000; Stevenson et al. 2012) and urban sources, such as sewage
treatment plants (Haggard 2010).
• Several macroinvertebrate community compositional metrics can be
used as indicators to stream nutrient pollution.
• Increased percent of Ephemeroptera, Plecoptera and Trichoptera (EPT)
taxa can be an indicator of good stream health (Sandlin & Johnson
2000).
• The Rapid Bioassessment Protocol (RBP) developed by the
Environmental Protection Agency (EPA) defines tolerance levels based
on lower taxonomic levels than order. The Rapid Bioassessment
Protocol shows the relationship between pollution sensitive and
pollution tolerant organisms through numerical values to determine
water quality (USEPA 2007).
Objectives
• To examine the relationship between phosphorus concentrations and
benthic macroinvertebrate communities in Ozark streams.
Hypothesis
• Percent EPT will increase as phosphorus levels decrease. Fewer EPT
taxa will be found in phosphorus rich waters.
• Macroinvertebrates who are pollution tolerant will be in higher
abundance with higher phosphorus concentrations. Chironomidae will
have a higher population percentage in higher phosphorus
concentration streams.
• The EPA’s Rapid Bioassessment Protocol results will show pollution
tolerant organisms increasing in streams with higher phosphorus
levels.
Site Descriptions
Study sites include wadeable streams in the White River drainage of
Northwest Arkansas. Three of the sites are main stem (White River,
Kings River and Little Buffalo River). The other four sites are tributaries
(War Eagle Creek, Cave Creek, Big Creek and Bear Creek). All sites are
located on the Ozark Highlands Ecoregion, and all sites are located along
a phosphorus gradient.
Order Ephemeroptera, Family
Isonychiidae, Genus Isonychia
Photo Credit to Dustin Lynch
Order Plecoptera, Family Perlidae
Photo Credit to Dustin Lynch
Order Trichoptera
Photo Credit to Halvor Halvorson
Isamar Cortes1, Kayla Sayre2, Michelle A. Evans-White2
1Department of Earth and Environmental Studies, Montclair State University, Montclair NJ 07043
2Department of Biological Sciences, University of Arkansas, Fayetteville AR 72701
Discussion
• Based on the data collected, Kings River has the highest percent EPT
and the second to lowest percent pollution tolerant to intolerant ratio
suggesting it has the highest stream health.
• White Creek rates the highest in pollution tolerant organisms, the
lowests in percent EPT and the second highest in percent Chironmidae.
• White Creek is the most impaired stream.
• Bear Creek had a high percent pollution tolerant and a high percent
EPT although it also had the highest TP.
Odonata Coenagrionidae (Damselfly
Larvae)
Photo by Kayla Sayre
Megaloptera
Photo by Kayla Sayre
Elimia Snail
Photo by Dustin Lynch
Preliminary Results
Figure 3:. This graph shows EPT taxa in each
site. Kings has the highest percent EPT.
Figure 2: This chart shows percent
Chironomidae in each site.
Figure 1: The ratio of pollution tolerant to
intolerant taxa for every site.
Figure 4: The percent of RBP pollution-
tolerant organisms in each given site.
0
10
20
30
40
50
60
70
80
0.013 µg/L 0.016 µg/L 0.017 µg/L 0.021 µg/L 0.022 µg/L 0.027 µg/L 0.042 µg/L
War Eagle LBR Kings Cave White Big Bear
%EPT
0
10
20
30
40
50
60
70
80
0.013 µg/L 0.016 µg/L 0.017 µg/L 0.021 µg/L 0.022 µg/L 0.027 µg/L 0.042 µg/L
War Eagle LBR Kings Cave White Big Bear
PercentChironmidae0
0.5
1
1.5
2
2.5
3
3.5
4
4.5
0.013 µg/L 0.016 µg/L 0.017 µg/L 0.021 µg/L 0.022 µg/L 0.027 µg/L 0.042 µg/L
War Eagle LBR Kings Cave White Big Bear
RatioofToleranttoIntolerant
0
10
20
30
40
50
60
70
80
90
0.013 µg/L 0.016 µg/L 0.017 µg/L 0.021 µg/L 0.022 µg/L 0.027 µg/L 0.042 µg/L
War Eagle LBR Kings Cave White Big Bear
PercentPollutionTolerant
Sites War Eagle LBR Kings Cave White Big Bear
TP 0.013 µg/L 0.016 µg/L 0.017 µg/L 0.021 µg/L 0.022 µg/L 0.027 µg/L 0.042 µg/L