SlideShare a Scribd company logo
1 of 1
Download to read offline
Study of a long-term series of repeated quarry blasts using spectrograms, waveform cross-correlation and
Principal Component Analysis
Matthew Yedlin1, Yochai Ben Horin2, Ivan Kitov3, Gary Margrave4, Mikhail Rozhkov3
1University of British Columbia, 2Soreq Nuclear Research Centre, 3CTBTO Preparatory Commission for the Comprehensive Nuclear Test-Ban Organization, 4Devon Canada Corporation
Abstract We have collected and processed 1654 Jordan
Phosphate Mines quarry blast waveforms recorded by the three
component (3-C) station HRFI. Judging by satellite images
taken for the same period, the largest spacing between these
blasts might exceed 20 km while their seismic (ML) magnitudes
vary in the range from 2 to 3. We have selected short waveform
segments (8 min.) for each of 1654 signals, and aligned all
waveforms to the Pn-wave arrival times as picked by the same
detection procedure based on the STA/LTA threshold. For each
event, we have created a waveform template. These waveform
templates were obtained by appropriate bandpass filtering, with
bands chosen heuristically by examining a spectrogram movie
constructed from a subset of the data. We cross-correlated
1654x1654 waveform-template pairs in order to estimate the
level of similarity between the measured signals as expressed by
cross-correlation coefficient (CC). As a result of the cross-
correlation procedure, a CC time series is created to which we
apply standard STA/LTA detector with the same threshold as for
the original waveforms to find arrival times in the CC domain.
When only the Z-component is used for CC, the best four 12.5 s
long templates can find all other 1653 signals. For 3-C records,
there are 119 templates which can find all other signals and
these observations highlight the importance of 3-C records for
the performance of the waveform cross-correlation (WCC)
technique. It is also found that longer templates result in lower
cross-correlation because of larger difference in the shape of S-
waves. To characterize the overall similarity of the whole set,
we have used the Principal Component Analysis (PCA) as based
on the Singular Value Decomposition technique. We have
demonstrated that the level of eigenvalues falls to 0.2 for the
first fifteen components and the first five components are able
to find all 1654 signals when WCC is applied. Therefore, the
first component obtained by SVD may serve as the most
effective detector for the studied quarry. When SVD is applied
to each of three components separately, the level of coherency
between vertical and horizontal components falls and the level
of cross-correlation does not exceed that observed for the SVD
for the Z-component only.
Disclaimer: The views expressed on this poster are those of the authors
and do not necessary reflect the views of the PTS CTBTO
DIMENSIONALITY REDUCTION : THE PRINCIPAL COMPONENT ANALYSIS
WAVEFORM CROSS CORRELATION AT STATION HRFI PERFORMANCE OF PCA TEMPLATES
Preparatory Commission for the Comprehensive Nuclear-Test Ban Treaty Organization, Provisional Technical Secretariat, Vienna International Centre,
P.O. Box 1200, A-1400 Vienna, Austria. E-mail: ivan.kitov@ctbto.org
www.ctbto.org
S51A-2758
Figure 1. The phosphate mine Eshidiya, 70 km away from Ma'an District and
330 km from Amman, has been extracting fossils using chemical blasts since
1989. It has two sites with the largest possible distance between events of
approximately 20 km, which is a challenge for detection using waveform cross
correlation
Figure 2. A few thousand blasts were conducted within the quarry. For the study
of waveform cross correlation, we have selected 1654 events (blue circles) with
records at station HRFI. There are other stations measuring most of these
events: PRNI, EIL, ASF, MMAI, which will be studied next.
Waveform cross correlation (WCC) is
a powerful technique to detect and
accurately locate repeated events.
Quarries provide extensive series of
waveforms characterized by a higher
level of similarity since blasts are
conducted within a few km from each
other. The Jordan phosphate mine
Eshidiya (see Figure 1) has a long
history of blasting (since 1989), with
thousands of events measured at near-
regional distances by several seismic
stations. These blasts have different
yields, and thus, some of them
produce stronger signals. The level of
microseismic noise is also changing
within a day and between seasons that
changes detection conditions.
Therefore, not all blasts can be
detected even by the nearest stations.
Another problem is association of
detected signals with a given mine.
Natural earthquakes around quarries
can also be detected and wrongly
associated with mining activity.
Waveform cross correlation is able to
separate blasts and natural events
using the difference in waveform
shape and/or differences in arrival
times at several stations.
Here we study the level of similarity
of waveforms from quarry blasts
conducted at the Eshidiya mine since
2004 and detected at near-regional
distances. We have selected the 3-
component station HRFI of the Israel
National Seismic Network operated
by Geophysical Institute of Israel (GII
Israel). HRFI is situated at a distance
of approximately 130 km from the
quarry, as Figure 2 illustrates, and has
sampling rate of 40 Hz. We use 1654
signals for waveform cross
correlation. Figure 2 depicts locations
of these events as measured by the
Israel National Seismic Network.
These locations are characterized by
high scattering around the mine,
beyond the boundaries of the blasting
area. Therefore, identification and
accurate location of these events is a
challenge for the WCC method.
We processed all 1654 seismograms
using the standard detector STA/LTA
with STA=0.5 s and LTA=20 s and
detected all 1654 signals with SNR>4.
Figure 3 presents spectrograms as
obtained for the vertical channel of
HRFI. To increase signal-to-noise
ratio (SNR=STA/LTA) we used a set
of filters covering the frequency
bands between 1 Hz and 16 Hz: 1) 1-3
Hz, 2) 2-4 Hz, 3) 3-6 Hz, 4) 4-8 Hz,
5) 6-12 Hz, 6) 8-16 Hz. This set
covers frequencies of observed
signals: from P to Rg waves. Figures
4 and 5 depict the frequency
distribution of SNR and detection
filters, respectively. Just a few dozens
of detections have SNR<10. At the
same time, the peak SNR value varies
between filters, with a larger part of
P-wave detections observed at higher
frequencies. To accommodate the
observed differences in relative
frequency content between the
measured signals in calculation of
cross correlation coefficients, we
created waveform templates in all six
frequency bands. Typical templates as
obtained from the quarry blasts are
show in Figure 6, which illustrates the
difference in frequency content of the
P- and S-wave arrivals as well as the
difference in amplitudes of vertical
and horizontal component. For
waveform cross correlation, each blast
from the 1654 can play the role of
master and slave.
The studied blasts were conducted
between January 2004 and January
2015. There is a gap in data between
June 2007 and July 2010.
Figure 6. 3-C templates (E – east-west, N – north-south, and Z - vertical) as
measured by HRFI from 4 blasts conducted within the quarry. Each waveform
has been filtered in six frequency bands in order to obtain the highest signal-
to-noise ratio. Three frequency bands are shown in the Figure. All templates
include 5-second-long (200 samples) pre-signal segments.
Figure 9. Detection rates for all templates.
There are 501 templates which have found
all slave signals with detection threshold
SNRCC=3.0
At first, we calculated cross correlation
coefficient for all pairs of events as
masters and slaves using all three
components (3-C) and Z-component
only. This allows direct comparison of
detection efficiency, with standard
SNRCC=STA/LTA>3.0 used as a
detector threshold. We selected a time
window of 15 s after the P-wave
arrivals and filters from 2 to 6. The
lower frequency filter between 1 Hz and
3 Hz is sensitive to the ambient noise,
and thus, was excluded from our
analysis.
Figures 7 and 8 illustrate the results
obtained for 3-C cross correlation.
There are three distinct blasting periods
with different level of similarity
between waveforms. Between 2004 to
2007 (upper left corner), majority of
signals are characterized by high CC
above 0.7, which is accompanied by
high SNRs shown in Figure 8. The
signals measured between 2010 and
January 2014 are split in smaller
clusters as expressed by high CC
values. However, they do not correlate
well with the signals measured between
2004 and 2007 and have lower
correlation with the signals observed
from January 2014 to January 2015
(lower right corner). It is important that
there exist events, whose signals do not
correlate with other waveform
templates. These are likely the events
with low SNRCC in Figure 4. In some
cases, cross correlation detection can be
more efficient than that with original
waveforms.
Figure 9 presents detection rates for all
templates, i.e. the portion of slave
events found by a given template. All
templates have detection rate above
0.996 and there are 501 templates,
which have found all slave signals with
the detection threshold SNRCC=3.0. The
latter could serve for detection of
signals from the studied quarry with the
WCC method. One can select the best
templates from 501 using the minimum
SNRCC values for a given template,
which are shown in Figure 10. The
largest value of SNRCCmin is above
3.75 and several templates can best
serve for detection. Moreover, for any
given slave the lowermost SNRCC
among all masters is around 8, i.e. much
higher than the smallest SNR found by
in original waveforms in Figure 4. For
these two templates, the detection
threshold can be increased to 3.5 with
the perfect detection rate of 1. Higher
detection thresholds are important for
better discrimination between the
studied quarry blasts and natural
seismic sources as well as for effective
elimination of false alarms associated
with microseismic noise.
Figure 11 and 12 presents the average
SNRCC and CC for each template, with
non detections (SNRCC<3.0) excluded.
Three different periods of blasting are
clearly seen.
Figure 13 compares the detection
performance of 10 best 3-C and Z-
templates as expressed by SNRCCmin.
The 3-C templates are characterized by
higher values and provide larger SNRCC
threshold. Overall, the 3-C templates
contain more information on signals
and better suppress the ambient noise.
Figure 14 illustrates the difference in
detection filters between 3-C and Z-
templates. The most efficient filter is
lower for 3-C templates since horizontal
components (see Figure 6) are
characterized by lower frequency
content.
Figure 10. Minimum SNRCC for all
templates, which is 0 when at least one
signal is not detected by a given template.
The largest SNRCCmin is above 3.75,
which can be used as the highest detection
threshold with at least one template
detecting all signals
Figure 11. Average SNRCC for all templates,
with non-detections, i.e. SNRCC<3.0,
excluded. The largest mean SNRCC is ~8.5,
also with detection rate 1.0. The mean
SNRCC is significantly lower in the
beginning of blasting (between 2004 and
2007) and during 2014.
Figure 12. Average CC for all templates,
with non-detections, i.e. SNR<3.0,
excluded. Three periods and clusters are
clear seen.
Figure 8. Maximum SNRCC for all master/slave pairs. The
highest SNR is observed for autocorrelation - diagonal
elements. Window length is 15 s. Three highest frequency
band are used.
Figure 7. Maximum absolute CC-values for all master/slave
pairs. There are clear clusters with CC close to 1, which are
likely series of spatially close blasts. There are three distinct
periods – 2004 to 2007 (upper left corner), 2010 to the end
of 2013, and 2014 (lower right corner). There are events (as
expressed by vertical blue lines) with low correlation with
all other templates.
Figure 3. Spectrogram of a typical signal
measured at vertical channel
Figure 14. Distribution of detections over
filters. For 3-C, the largest number
corresponds to filter 4 Hz to 8 Hz, and for
Z-component the peak is for
the filter between 8 Hz and 16 Hz.
Figure 4. Frequency distribution
of SNR of detected P-waves
Figure 5. Frequency distribution
of detections over filters
Figure 15. All eigenvalues obtained by SVD for 3
different components (E, N, Z) and 6 filters we
normalized to their peak values. Only 100
components are shown in this Figure. For Z-
component, normalized eigenvalues fall below 0.2 for
PCA component 10.
BLASTS AT ESHIDIYA MINE DETECTED AT STATION HRFI
The original signals are used to prepare
waveform templates for cross correlation.
Some of these templates demonstrate the
highest possible detection rate with all
slaves found for threshold SNRCC>3.0 and
even SNRCC>3.75. Overall, the result of
cross correlation implies high similarity
between waveforms. Lower CC values for
some master/slave pairs can be explained by
the effect of similarity decreasing with
distance and/or change in blast setting, but
also by the influence of the ambient noise.
The Principle Component Analysis (PCA) is
a technique to obtain waveform templates
retrieving similar features from all signals,
which are also orthogonal to permanent
features observed in the micro-seismic
noise. Therefore, the use of templates
obtained by the PCA may increase the
average and minimal SNR.
We used all 1654 waveforms and the
Singular Value Decomposition (SVD)
method to calculate eigenvalues and
eigenvectors. The latter are used as
waveform templates. SVD was applied to
three sets of signals measured at E-, N-, and
Z-components and to each filter band
separately. The length of waveform
segment for the SVD was 75 s, and thus, all
regular seismic phases were included.
Figure 15 illustrates the dramatic fall in
eigenvalues for components beyond 10 to
15. The normalized eigenvalue drops below
0.2, and thus, the corresponding
eigenvectors do not contribute much to the
decomposed original waveforms. The
behavior of the eigenvalues is in line with
the result of detection in Figure 9 - the
original waveforms are very similar.
The rate of fall in normalized eigenvalues is
slightly different between components and
filters, however. This observation makes it
important to use all filters and components
to prepare waveform templates. Figure 16
presents four 3-C templates as compiled
from eigenvectors 1, 2, 5, and 10. The
difference between vertical and horizontal
components is expressed in relative
amplitudes and frequency content. The Z-
component of the P-wave is of relatively
higher amplitude at higher frequencies, but
this difference decreases with frequency. For
the S-wave group, the E-component is the
highest between 4 Hz and 8 Hz, but shear
waves almost disappear at higher
frequencies. The performance of the
obtained PCA components should change
with template length, filter, and the use of
one or three components together.
Therefore, we have to determine template
settings optimal for detection.
At first, we calculated CC-traces and SNRCC
for eigenvectors from 1 to 100 using
template length 15 s, i.e. the P-wave group
before the S-wave arrival. Figure 17 shows
the averaged SNRCC estimates as obtained
for the 3-C and Z templates. We have
excluded SNRCC<3.0, i.e. non-detections,
from averaging process. The use of 3-C
templates in cross correlation is likely more
efficient as expressed by higher average
SNRCC observed for first two PCA
components. The same effect is observed for
the original templates. The difference
between 3-C and Z-templates decreases with
index. One also should not use for detection
templates beyond the 10th because their
performance is poor.
Figure 18 presents frequency distribution of
detection filters (i.e. the filter with the
highest SNRCC) for the first ten PCA
templates. For detection, the most effective
is the filter between 8 Hz and 16 Hz (see
Figure 16).
Figure 16. Four PCA templates (E – east-west, N – north-south, and Z - vertical) as
compiled from eigenvectors 1, 2, 5, and 10, which were obtained separately for E-, N-
and Z-components. Three frequency bands are shown in the Figure. All templates
include 2.5-second-long (100 samples) pre-signal segments.
Figure 17. Comparison of the averaged
SNR estimates as obtained for the 3-C and
Z templates based on the PCA
components 1 to 100. Non-detections are
excluded. The average 3-C SNR estimates
for the first two components are the
largest. Templates 1 to 10 are the best in
both cases.
Figure 18. Frequency distribution of
detection filters for the 3-C templates from
1 to 10. The filter between 8 Hz and 16 Hz
is superior for detection with PCA.
Figure 19. Comparison of detection rates
for Z and 3-C templates from 1 to 50. The
first three 3-C templates guarantee 100%
detection rate.
Figure 20. Comparison of average CC for
different template lengths – from 7.5 s to
40 s. Shorter signals are characterized by
higher CC
Figure 21. Comparison of average SNR
for for different template lengths – from
7.5 s to 40 s. The length optimal for
detection is near 15 s.
Figure 27. Average SNRCC as obtained
for 100 templates from station EIL and all
signals recorded at HRFI. Template length
is 15 s. The level of similarity between
signals at two stations is illustrative.
In Figure 19, we compare detection rates
obtained for the first 50 Z and 3-C PCA
templates. The first three Z templates
guarantee 100% detection rate.
The first 10 average CC values for four
different 3-C template lengths – from 7.5 s
to 40 s are displayed in Figure 20. Overall,
shorter templates produce higher CC. This
is in line with increasing specificity of
waveform templates as expressed by the
product of frequency bandwidth and
window length.
Figure 21 presents the estimates of average
SNRCC for first 10 3-C components. There
exists an optimal window length expressing
the trade-off between cross correlation with
signal and noise suppression. Overall, for
the HRFI principal components, this length
is between 15 s and 25 s. For higher order
components, the SNRCC peak shifts to
longer windows, however.
A more important detection characteristic is
the minimum SNRCC presented in Figure
22. It defines the detection threshold. For
the shortest window of 7.5 s, there is no
component with 100% detection rate. The
largest SNRCCmin belongs to the longest
window. When only Z-component is used
for cross correlation, the peak SNRCCmin
value increases to 3.3, as Figure 23 shows.
The choice of optimal filters for efficient
detection is an important task. Figure 24
depicts the portion of detections as obtained
by filters from 2 to 6 for the 10 first Z and
3-C templates. The portion of detections
obtained by Z-templates increases with
frequency. For 3-C templates, there is a
deeper minimum around 3rd filter.
Finally, we compare the original and PCA
templates. In Figure 25, the average SNRCC
for the best 10 original and first 10 PCA
templates are presented. The 3-C PCA
templates correlate better with the original
signals on average.
However, the smallest SNRCC is much
higher for the original 3-C templates, as
shown in Figure 26. This is one of main
results of this study. In continuous data
processing at station HRFI, the best 3-C
templates are an optimal choice to detect
signals from the Jordan phosphate mine.
The length of these templates has to be
between 15 s and 25 s and all five filters
should be used. With these templates, we
could expect more signals to be found.
At this stage, only one station is analyzed.
There are other near-regional stations,
which measured the same events, e.g. EIL,
PRNI, ASF, MMAI. Cross comparison of
these stations can reveal important
similarities and differences in their
waveforms. Figure 27 shows results of
cross correlation between signals measured
at two stations - HRFI and EIL. One
hundred EIL signal were used as waveform
templates and all HRFI signals participated
in cross correlation. The average SNR is
almost at the same level as between signals
of HRFI only (see Figure 11). EIL signals
can be used as templates to detect signals at
HRFI.
The Geographical distribution of these 5
stations allows effective relative location of
quarry blasts using travel time difference
between arrivals detected by cross
correlation, which provide more accurate
onset times. This is especially important for
weak signals.
We will continue the study of
dimensionality reduction and are going to
extend simple PCA methods to the level of
tensor PCA, which takes into account the
link between vertical and horizontal
components of the same records.
Figure 22. Comparison of minimal
SNRCC for different template lengths –
from 7.5 s to 40 s. The largest SNRCCmin
belongs to the longest window.
Figure 13. SNRCCmin for 10 best 3-C and
Z- templates. The 3-C templates are
superior, and thus, can provide larger
SNRCC threshold important for efficient
signal separation from background noise.
Figure 23. Comparison of min SNR for
Z and 3-C templates.
Figure 24. Distribution of detection filters
for 10 first Z and 3-C templates as
obtained from PCA eigenvectors. All in
all, the Z-templates demonstrate an
increasing portion of detections with
frequency. For 3-C templates, there is a
deeper minimum around the 3rd filter.
Figure 25. Comparison of average SNRCC
for the best 10 original and first 10 PCA
templates. The 3-C PCA templates
correlate better with original signals on
average.
Figure 26. Comparison of min SNRCC for
the best 10 original and first 10 PCA
templates. The original 3-C templates
are most appropriate for detection.

More Related Content

What's hot

Towards the identification of the primary particle nature by the radiodetecti...
Towards the identification of the primary particle nature by the radiodetecti...Towards the identification of the primary particle nature by the radiodetecti...
Towards the identification of the primary particle nature by the radiodetecti...Ahmed Ammar Rebai PhD
 
P-Wave Onset Point Detection for Seismic Signal Using Bhattacharyya Distance
P-Wave Onset Point Detection for Seismic Signal Using Bhattacharyya DistanceP-Wave Onset Point Detection for Seismic Signal Using Bhattacharyya Distance
P-Wave Onset Point Detection for Seismic Signal Using Bhattacharyya DistanceCSCJournals
 
MIRAS: The SMOS Instrument
MIRAS: The SMOS InstrumentMIRAS: The SMOS Instrument
MIRAS: The SMOS Instrumentadrianocamps
 
MIRAS: the instrument aboard SMOS
MIRAS: the instrument aboard SMOSMIRAS: the instrument aboard SMOS
MIRAS: the instrument aboard SMOSadrianocamps
 
1-Wang-FR1020-IGARSS11.pptx
1-Wang-FR1020-IGARSS11.pptx1-Wang-FR1020-IGARSS11.pptx
1-Wang-FR1020-IGARSS11.pptxgrssieee
 
Towards the identification of the primary particle nature by the radiodetecti...
Towards the identification of the primary particle nature by the radiodetecti...Towards the identification of the primary particle nature by the radiodetecti...
Towards the identification of the primary particle nature by the radiodetecti...Ahmed Ammar Rebai PhD
 
Dr Jian Zhong - Modelling the neighbourhood-scale dispersion of ultrafine par...
Dr Jian Zhong - Modelling the neighbourhood-scale dispersion of ultrafine par...Dr Jian Zhong - Modelling the neighbourhood-scale dispersion of ultrafine par...
Dr Jian Zhong - Modelling the neighbourhood-scale dispersion of ultrafine par...IES / IAQM
 
Prof Tom Trainor (University of Washington, Seattle, USA)
Prof Tom Trainor (University of Washington, Seattle, USA)Prof Tom Trainor (University of Washington, Seattle, USA)
Prof Tom Trainor (University of Washington, Seattle, USA)Rene Kotze
 
Espectrometría en el infrarrojo (IR) - Clase 2
Espectrometría en el infrarrojo (IR) - Clase 2Espectrometría en el infrarrojo (IR) - Clase 2
Espectrometría en el infrarrojo (IR) - Clase 2José Luis Castro Soto
 
Dma ppt
Dma pptDma ppt
Dma pptsinelk
 
G Kornakov Ea Smultivariate Analysis
G Kornakov Ea Smultivariate AnalysisG Kornakov Ea Smultivariate Analysis
G Kornakov Ea Smultivariate AnalysisMiguel Morales
 
1 radar basic -part i 1
1 radar basic -part i 11 radar basic -part i 1
1 radar basic -part i 1Solo Hermelin
 
Thesis_powerpoint
Thesis_powerpointThesis_powerpoint
Thesis_powerpointTim Costa
 
Recovery of aftershock sequences using waveform cross correlation: from catas...
Recovery of aftershock sequences using waveform cross correlation: from catas...Recovery of aftershock sequences using waveform cross correlation: from catas...
Recovery of aftershock sequences using waveform cross correlation: from catas...Ivan Kitov
 
IGARSS_2011_XB_v007.pptx
IGARSS_2011_XB_v007.pptxIGARSS_2011_XB_v007.pptx
IGARSS_2011_XB_v007.pptxgrssieee
 

What's hot (20)

qHNMR for purity determination
qHNMR for purity determinationqHNMR for purity determination
qHNMR for purity determination
 
Warrp sesimic_ aghazde
Warrp sesimic_ aghazdeWarrp sesimic_ aghazde
Warrp sesimic_ aghazde
 
DSP preliminaries
DSP preliminariesDSP preliminaries
DSP preliminaries
 
Towards the identification of the primary particle nature by the radiodetecti...
Towards the identification of the primary particle nature by the radiodetecti...Towards the identification of the primary particle nature by the radiodetecti...
Towards the identification of the primary particle nature by the radiodetecti...
 
P-Wave Onset Point Detection for Seismic Signal Using Bhattacharyya Distance
P-Wave Onset Point Detection for Seismic Signal Using Bhattacharyya DistanceP-Wave Onset Point Detection for Seismic Signal Using Bhattacharyya Distance
P-Wave Onset Point Detection for Seismic Signal Using Bhattacharyya Distance
 
MIRAS: The SMOS Instrument
MIRAS: The SMOS InstrumentMIRAS: The SMOS Instrument
MIRAS: The SMOS Instrument
 
MIRAS: the instrument aboard SMOS
MIRAS: the instrument aboard SMOSMIRAS: the instrument aboard SMOS
MIRAS: the instrument aboard SMOS
 
IJET-V3I2P9
IJET-V3I2P9IJET-V3I2P9
IJET-V3I2P9
 
muondecay
muondecaymuondecay
muondecay
 
1-Wang-FR1020-IGARSS11.pptx
1-Wang-FR1020-IGARSS11.pptx1-Wang-FR1020-IGARSS11.pptx
1-Wang-FR1020-IGARSS11.pptx
 
Towards the identification of the primary particle nature by the radiodetecti...
Towards the identification of the primary particle nature by the radiodetecti...Towards the identification of the primary particle nature by the radiodetecti...
Towards the identification of the primary particle nature by the radiodetecti...
 
Dr Jian Zhong - Modelling the neighbourhood-scale dispersion of ultrafine par...
Dr Jian Zhong - Modelling the neighbourhood-scale dispersion of ultrafine par...Dr Jian Zhong - Modelling the neighbourhood-scale dispersion of ultrafine par...
Dr Jian Zhong - Modelling the neighbourhood-scale dispersion of ultrafine par...
 
Prof Tom Trainor (University of Washington, Seattle, USA)
Prof Tom Trainor (University of Washington, Seattle, USA)Prof Tom Trainor (University of Washington, Seattle, USA)
Prof Tom Trainor (University of Washington, Seattle, USA)
 
Espectrometría en el infrarrojo (IR) - Clase 2
Espectrometría en el infrarrojo (IR) - Clase 2Espectrometría en el infrarrojo (IR) - Clase 2
Espectrometría en el infrarrojo (IR) - Clase 2
 
Dma ppt
Dma pptDma ppt
Dma ppt
 
G Kornakov Ea Smultivariate Analysis
G Kornakov Ea Smultivariate AnalysisG Kornakov Ea Smultivariate Analysis
G Kornakov Ea Smultivariate Analysis
 
1 radar basic -part i 1
1 radar basic -part i 11 radar basic -part i 1
1 radar basic -part i 1
 
Thesis_powerpoint
Thesis_powerpointThesis_powerpoint
Thesis_powerpoint
 
Recovery of aftershock sequences using waveform cross correlation: from catas...
Recovery of aftershock sequences using waveform cross correlation: from catas...Recovery of aftershock sequences using waveform cross correlation: from catas...
Recovery of aftershock sequences using waveform cross correlation: from catas...
 
IGARSS_2011_XB_v007.pptx
IGARSS_2011_XB_v007.pptxIGARSS_2011_XB_v007.pptx
IGARSS_2011_XB_v007.pptx
 

Similar to Investigation of repeated events at Jordan phosphate mine with waveform cross cottelation

SHIPS MATCHING BASED ON AN ADAPTIVE ACOUSTIC SPECTRUM SIGNATURE DETECTION ALG...
SHIPS MATCHING BASED ON AN ADAPTIVE ACOUSTIC SPECTRUM SIGNATURE DETECTION ALG...SHIPS MATCHING BASED ON AN ADAPTIVE ACOUSTIC SPECTRUM SIGNATURE DETECTION ALG...
SHIPS MATCHING BASED ON AN ADAPTIVE ACOUSTIC SPECTRUM SIGNATURE DETECTION ALG...sipij
 
Senior Honors Research Thesis
Senior Honors Research ThesisSenior Honors Research Thesis
Senior Honors Research ThesisMichael McMearty
 
An Overview of Array Signal Processing and Beam Forming TechniquesAn Overview...
An Overview of Array Signal Processing and Beam Forming TechniquesAn Overview...An Overview of Array Signal Processing and Beam Forming TechniquesAn Overview...
An Overview of Array Signal Processing and Beam Forming TechniquesAn Overview...Editor IJCATR
 
Observation of gravitational waves from a binary black hole merger
Observation of gravitational waves from a binary black hole mergerObservation of gravitational waves from a binary black hole merger
Observation of gravitational waves from a binary black hole mergerSérgio Sacani
 
A JOINT TIMING OFFSET AND CHANNEL ESTIMATION USING FRACTIONAL FOURIER TRANSFO...
A JOINT TIMING OFFSET AND CHANNEL ESTIMATION USING FRACTIONAL FOURIER TRANSFO...A JOINT TIMING OFFSET AND CHANNEL ESTIMATION USING FRACTIONAL FOURIER TRANSFO...
A JOINT TIMING OFFSET AND CHANNEL ESTIMATION USING FRACTIONAL FOURIER TRANSFO...IJCNCJournal
 
New Method of R-Wave Detection by Continuous Wavelet Transform
New Method of R-Wave Detection by Continuous Wavelet TransformNew Method of R-Wave Detection by Continuous Wavelet Transform
New Method of R-Wave Detection by Continuous Wavelet TransformCSCJournals
 
Stability of Target Resonance Modes: Ina Quadrature Polarization Context
Stability of Target Resonance Modes: Ina Quadrature Polarization ContextStability of Target Resonance Modes: Ina Quadrature Polarization Context
Stability of Target Resonance Modes: Ina Quadrature Polarization ContextIJERA Editor
 
Optical interferometery to detect sound waves as an analogue for gravitationa...
Optical interferometery to detect sound waves as an analogue for gravitationa...Optical interferometery to detect sound waves as an analogue for gravitationa...
Optical interferometery to detect sound waves as an analogue for gravitationa...Thomas Actn
 
EXPERIMENTAL RESEARCH OF HIGHLY RELIABLE METHODS OF HYDROACOUSTIC COMMUNICATI...
EXPERIMENTAL RESEARCH OF HIGHLY RELIABLE METHODS OF HYDROACOUSTIC COMMUNICATI...EXPERIMENTAL RESEARCH OF HIGHLY RELIABLE METHODS OF HYDROACOUSTIC COMMUNICATI...
EXPERIMENTAL RESEARCH OF HIGHLY RELIABLE METHODS OF HYDROACOUSTIC COMMUNICATI...sipij
 
Modeling and Estimation of Stationary and Non-stationary Noises of Rubidium A...
Modeling and Estimation of Stationary and Non-stationary Noises of Rubidium A...Modeling and Estimation of Stationary and Non-stationary Noises of Rubidium A...
Modeling and Estimation of Stationary and Non-stationary Noises of Rubidium A...IJERA Editor
 
Probability-Based Diagnostic Imaging Technique Using Error Functions for Acti...
Probability-Based Diagnostic Imaging Technique Using Error Functions for Acti...Probability-Based Diagnostic Imaging Technique Using Error Functions for Acti...
Probability-Based Diagnostic Imaging Technique Using Error Functions for Acti...IJERA Editor
 
Detection and Location of Faults in 11KV Underground Cable by using Continuou...
Detection and Location of Faults in 11KV Underground Cable by using Continuou...Detection and Location of Faults in 11KV Underground Cable by using Continuou...
Detection and Location of Faults in 11KV Underground Cable by using Continuou...IOSR Journals
 
Ultrasonic thickness estimation using multimodal guided lamb waves generated ...
Ultrasonic thickness estimation using multimodal guided lamb waves generated ...Ultrasonic thickness estimation using multimodal guided lamb waves generated ...
Ultrasonic thickness estimation using multimodal guided lamb waves generated ...Innerspec Technologies
 
METHOD FOR THE DETECTION OF MIXED QPSK SIGNALS BASED ON THE CALCULATION OF FO...
METHOD FOR THE DETECTION OF MIXED QPSK SIGNALS BASED ON THE CALCULATION OF FO...METHOD FOR THE DETECTION OF MIXED QPSK SIGNALS BASED ON THE CALCULATION OF FO...
METHOD FOR THE DETECTION OF MIXED QPSK SIGNALS BASED ON THE CALCULATION OF FO...sipij
 

Similar to Investigation of repeated events at Jordan phosphate mine with waveform cross cottelation (20)

REU_paper
REU_paperREU_paper
REU_paper
 
SHIPS MATCHING BASED ON AN ADAPTIVE ACOUSTIC SPECTRUM SIGNATURE DETECTION ALG...
SHIPS MATCHING BASED ON AN ADAPTIVE ACOUSTIC SPECTRUM SIGNATURE DETECTION ALG...SHIPS MATCHING BASED ON AN ADAPTIVE ACOUSTIC SPECTRUM SIGNATURE DETECTION ALG...
SHIPS MATCHING BASED ON AN ADAPTIVE ACOUSTIC SPECTRUM SIGNATURE DETECTION ALG...
 
Senior Honors Research Thesis
Senior Honors Research ThesisSenior Honors Research Thesis
Senior Honors Research Thesis
 
An Overview of Array Signal Processing and Beam Forming TechniquesAn Overview...
An Overview of Array Signal Processing and Beam Forming TechniquesAn Overview...An Overview of Array Signal Processing and Beam Forming TechniquesAn Overview...
An Overview of Array Signal Processing and Beam Forming TechniquesAn Overview...
 
Observation of gravitational waves from a binary black hole merger
Observation of gravitational waves from a binary black hole mergerObservation of gravitational waves from a binary black hole merger
Observation of gravitational waves from a binary black hole merger
 
A JOINT TIMING OFFSET AND CHANNEL ESTIMATION USING FRACTIONAL FOURIER TRANSFO...
A JOINT TIMING OFFSET AND CHANNEL ESTIMATION USING FRACTIONAL FOURIER TRANSFO...A JOINT TIMING OFFSET AND CHANNEL ESTIMATION USING FRACTIONAL FOURIER TRANSFO...
A JOINT TIMING OFFSET AND CHANNEL ESTIMATION USING FRACTIONAL FOURIER TRANSFO...
 
New Method of R-Wave Detection by Continuous Wavelet Transform
New Method of R-Wave Detection by Continuous Wavelet TransformNew Method of R-Wave Detection by Continuous Wavelet Transform
New Method of R-Wave Detection by Continuous Wavelet Transform
 
Stability of Target Resonance Modes: Ina Quadrature Polarization Context
Stability of Target Resonance Modes: Ina Quadrature Polarization ContextStability of Target Resonance Modes: Ina Quadrature Polarization Context
Stability of Target Resonance Modes: Ina Quadrature Polarization Context
 
Optical interferometery to detect sound waves as an analogue for gravitationa...
Optical interferometery to detect sound waves as an analogue for gravitationa...Optical interferometery to detect sound waves as an analogue for gravitationa...
Optical interferometery to detect sound waves as an analogue for gravitationa...
 
Ch16 sound and waves
Ch16 sound and wavesCh16 sound and waves
Ch16 sound and waves
 
EXPERIMENTAL RESEARCH OF HIGHLY RELIABLE METHODS OF HYDROACOUSTIC COMMUNICATI...
EXPERIMENTAL RESEARCH OF HIGHLY RELIABLE METHODS OF HYDROACOUSTIC COMMUNICATI...EXPERIMENTAL RESEARCH OF HIGHLY RELIABLE METHODS OF HYDROACOUSTIC COMMUNICATI...
EXPERIMENTAL RESEARCH OF HIGHLY RELIABLE METHODS OF HYDROACOUSTIC COMMUNICATI...
 
Modeling and Estimation of Stationary and Non-stationary Noises of Rubidium A...
Modeling and Estimation of Stationary and Non-stationary Noises of Rubidium A...Modeling and Estimation of Stationary and Non-stationary Noises of Rubidium A...
Modeling and Estimation of Stationary and Non-stationary Noises of Rubidium A...
 
Probability-Based Diagnostic Imaging Technique Using Error Functions for Acti...
Probability-Based Diagnostic Imaging Technique Using Error Functions for Acti...Probability-Based Diagnostic Imaging Technique Using Error Functions for Acti...
Probability-Based Diagnostic Imaging Technique Using Error Functions for Acti...
 
Honors Thesis
Honors ThesisHonors Thesis
Honors Thesis
 
Detection and Location of Faults in 11KV Underground Cable by using Continuou...
Detection and Location of Faults in 11KV Underground Cable by using Continuou...Detection and Location of Faults in 11KV Underground Cable by using Continuou...
Detection and Location of Faults in 11KV Underground Cable by using Continuou...
 
G010144450
G010144450G010144450
G010144450
 
Ultrasonic thickness estimation using multimodal guided lamb waves generated ...
Ultrasonic thickness estimation using multimodal guided lamb waves generated ...Ultrasonic thickness estimation using multimodal guided lamb waves generated ...
Ultrasonic thickness estimation using multimodal guided lamb waves generated ...
 
METHOD FOR THE DETECTION OF MIXED QPSK SIGNALS BASED ON THE CALCULATION OF FO...
METHOD FOR THE DETECTION OF MIXED QPSK SIGNALS BASED ON THE CALCULATION OF FO...METHOD FOR THE DETECTION OF MIXED QPSK SIGNALS BASED ON THE CALCULATION OF FO...
METHOD FOR THE DETECTION OF MIXED QPSK SIGNALS BASED ON THE CALCULATION OF FO...
 
Microwave advancement
Microwave advancementMicrowave advancement
Microwave advancement
 
Crabtree_2012
Crabtree_2012Crabtree_2012
Crabtree_2012
 

More from Ivan Kitov

Assessing the consistency, quality, and completeness of the Reviewed Event Bu...
Assessing the consistency, quality, and completeness of the Reviewed Event Bu...Assessing the consistency, quality, and completeness of the Reviewed Event Bu...
Assessing the consistency, quality, and completeness of the Reviewed Event Bu...Ivan Kitov
 
Detection and location of small aftershocks using waveform cross correlation
Detection and location of small aftershocks using waveform cross correlationDetection and location of small aftershocks using waveform cross correlation
Detection and location of small aftershocks using waveform cross correlationIvan Kitov
 
Remote detection of weak aftershocks of the DPRK underground explosions using...
Remote detection of weak aftershocks of the DPRK underground explosions using...Remote detection of weak aftershocks of the DPRK underground explosions using...
Remote detection of weak aftershocks of the DPRK underground explosions using...Ivan Kitov
 
Investigation of repeated blasts at Aitik mine using waveform cross correlation
Investigation of repeated blasts at Aitik mine using waveform cross correlationInvestigation of repeated blasts at Aitik mine using waveform cross correlation
Investigation of repeated blasts at Aitik mine using waveform cross correlationIvan Kitov
 
Testing the global grid of master events for waveform cross correlation with ...
Testing the global grid of master events for waveform cross correlation with ...Testing the global grid of master events for waveform cross correlation with ...
Testing the global grid of master events for waveform cross correlation with ...Ivan Kitov
 
The use of a 3-C array for regional monitoring
The use of a 3-C array for regional monitoringThe use of a 3-C array for regional monitoring
The use of a 3-C array for regional monitoringIvan Kitov
 
The use of waveform cross correlation for creation of an accurate catalogue o...
The use of waveform cross correlation for creation of an accurate catalogue o...The use of waveform cross correlation for creation of an accurate catalogue o...
The use of waveform cross correlation for creation of an accurate catalogue o...Ivan Kitov
 
Inflation, Unemployment, and Labor Force: The Phillips Curve and Long-term Pr...
Inflation, Unemployment, and Labor Force: The Phillips Curve and Long-term Pr...Inflation, Unemployment, and Labor Force: The Phillips Curve and Long-term Pr...
Inflation, Unemployment, and Labor Force: The Phillips Curve and Long-term Pr...Ivan Kitov
 
Big Data solution for CTBT monitoring:CEA-IDC joint global cross correlation ...
Big Data solution for CTBT monitoring:CEA-IDC joint global cross correlation ...Big Data solution for CTBT monitoring:CEA-IDC joint global cross correlation ...
Big Data solution for CTBT monitoring:CEA-IDC joint global cross correlation ...Ivan Kitov
 
Joint interpretation of infrasound, acoustic, and seismic waves from meteorit...
Joint interpretation of infrasound, acoustic, and seismic waves from meteorit...Joint interpretation of infrasound, acoustic, and seismic waves from meteorit...
Joint interpretation of infrasound, acoustic, and seismic waves from meteorit...Ivan Kitov
 
The Chelyabinsk meteor: joint interpretation of infrasound, acoustic, and sei...
The Chelyabinsk meteor: joint interpretation of infrasound, acoustic, and sei...The Chelyabinsk meteor: joint interpretation of infrasound, acoustic, and sei...
The Chelyabinsk meteor: joint interpretation of infrasound, acoustic, and sei...Ivan Kitov
 
Synthetics vs. real waveforms from underground nuclear explosions as master t...
Synthetics vs. real waveforms from underground nuclear explosions as master t...Synthetics vs. real waveforms from underground nuclear explosions as master t...
Synthetics vs. real waveforms from underground nuclear explosions as master t...Ivan Kitov
 
Performance of waveform cross correlation using a global and regular grid of ...
Performance of waveform cross correlation using a global and regular grid of ...Performance of waveform cross correlation using a global and regular grid of ...
Performance of waveform cross correlation using a global and regular grid of ...Ivan Kitov
 
Modelling the transition from a socialist to capitalist economic system
Modelling the transition from a socialist to capitalist economic systemModelling the transition from a socialist to capitalist economic system
Modelling the transition from a socialist to capitalist economic system Ivan Kitov
 
Evolution of the personal income distribution in the USA: high incomes
Evolution of the personal income distribution in the USA: high incomesEvolution of the personal income distribution in the USA: high incomes
Evolution of the personal income distribution in the USA: high incomesIvan Kitov
 
Searching for aftershocks of underground explosions with cross correlation
Searching for aftershocks of underground explosions with cross correlationSearching for aftershocks of underground explosions with cross correlation
Searching for aftershocks of underground explosions with cross correlationIvan Kitov
 
Review regional Source Specific Station Corrections (SSSCs) developed for no...
Review regional Source Specific Station Corrections (SSSCs) developed for  no...Review regional Source Specific Station Corrections (SSSCs) developed for  no...
Review regional Source Specific Station Corrections (SSSCs) developed for no...Ivan Kitov
 
The dynamics of personal income distribution and inequality in the United States
The dynamics of personal income distribution and inequality in the United StatesThe dynamics of personal income distribution and inequality in the United States
The dynamics of personal income distribution and inequality in the United StatesIvan Kitov
 
Global grid of master events for waveform cross correlation: design and testing
Global grid of master events for waveform cross correlation: design and testingGlobal grid of master events for waveform cross correlation: design and testing
Global grid of master events for waveform cross correlation: design and testingIvan Kitov
 
Acoustic and seismic effects of the 2013 Chelyabinsk meteorite as measured by...
Acoustic and seismic effects of the 2013 Chelyabinsk meteorite as measured by...Acoustic and seismic effects of the 2013 Chelyabinsk meteorite as measured by...
Acoustic and seismic effects of the 2013 Chelyabinsk meteorite as measured by...Ivan Kitov
 

More from Ivan Kitov (20)

Assessing the consistency, quality, and completeness of the Reviewed Event Bu...
Assessing the consistency, quality, and completeness of the Reviewed Event Bu...Assessing the consistency, quality, and completeness of the Reviewed Event Bu...
Assessing the consistency, quality, and completeness of the Reviewed Event Bu...
 
Detection and location of small aftershocks using waveform cross correlation
Detection and location of small aftershocks using waveform cross correlationDetection and location of small aftershocks using waveform cross correlation
Detection and location of small aftershocks using waveform cross correlation
 
Remote detection of weak aftershocks of the DPRK underground explosions using...
Remote detection of weak aftershocks of the DPRK underground explosions using...Remote detection of weak aftershocks of the DPRK underground explosions using...
Remote detection of weak aftershocks of the DPRK underground explosions using...
 
Investigation of repeated blasts at Aitik mine using waveform cross correlation
Investigation of repeated blasts at Aitik mine using waveform cross correlationInvestigation of repeated blasts at Aitik mine using waveform cross correlation
Investigation of repeated blasts at Aitik mine using waveform cross correlation
 
Testing the global grid of master events for waveform cross correlation with ...
Testing the global grid of master events for waveform cross correlation with ...Testing the global grid of master events for waveform cross correlation with ...
Testing the global grid of master events for waveform cross correlation with ...
 
The use of a 3-C array for regional monitoring
The use of a 3-C array for regional monitoringThe use of a 3-C array for regional monitoring
The use of a 3-C array for regional monitoring
 
The use of waveform cross correlation for creation of an accurate catalogue o...
The use of waveform cross correlation for creation of an accurate catalogue o...The use of waveform cross correlation for creation of an accurate catalogue o...
The use of waveform cross correlation for creation of an accurate catalogue o...
 
Inflation, Unemployment, and Labor Force: The Phillips Curve and Long-term Pr...
Inflation, Unemployment, and Labor Force: The Phillips Curve and Long-term Pr...Inflation, Unemployment, and Labor Force: The Phillips Curve and Long-term Pr...
Inflation, Unemployment, and Labor Force: The Phillips Curve and Long-term Pr...
 
Big Data solution for CTBT monitoring:CEA-IDC joint global cross correlation ...
Big Data solution for CTBT monitoring:CEA-IDC joint global cross correlation ...Big Data solution for CTBT monitoring:CEA-IDC joint global cross correlation ...
Big Data solution for CTBT monitoring:CEA-IDC joint global cross correlation ...
 
Joint interpretation of infrasound, acoustic, and seismic waves from meteorit...
Joint interpretation of infrasound, acoustic, and seismic waves from meteorit...Joint interpretation of infrasound, acoustic, and seismic waves from meteorit...
Joint interpretation of infrasound, acoustic, and seismic waves from meteorit...
 
The Chelyabinsk meteor: joint interpretation of infrasound, acoustic, and sei...
The Chelyabinsk meteor: joint interpretation of infrasound, acoustic, and sei...The Chelyabinsk meteor: joint interpretation of infrasound, acoustic, and sei...
The Chelyabinsk meteor: joint interpretation of infrasound, acoustic, and sei...
 
Synthetics vs. real waveforms from underground nuclear explosions as master t...
Synthetics vs. real waveforms from underground nuclear explosions as master t...Synthetics vs. real waveforms from underground nuclear explosions as master t...
Synthetics vs. real waveforms from underground nuclear explosions as master t...
 
Performance of waveform cross correlation using a global and regular grid of ...
Performance of waveform cross correlation using a global and regular grid of ...Performance of waveform cross correlation using a global and regular grid of ...
Performance of waveform cross correlation using a global and regular grid of ...
 
Modelling the transition from a socialist to capitalist economic system
Modelling the transition from a socialist to capitalist economic systemModelling the transition from a socialist to capitalist economic system
Modelling the transition from a socialist to capitalist economic system
 
Evolution of the personal income distribution in the USA: high incomes
Evolution of the personal income distribution in the USA: high incomesEvolution of the personal income distribution in the USA: high incomes
Evolution of the personal income distribution in the USA: high incomes
 
Searching for aftershocks of underground explosions with cross correlation
Searching for aftershocks of underground explosions with cross correlationSearching for aftershocks of underground explosions with cross correlation
Searching for aftershocks of underground explosions with cross correlation
 
Review regional Source Specific Station Corrections (SSSCs) developed for no...
Review regional Source Specific Station Corrections (SSSCs) developed for  no...Review regional Source Specific Station Corrections (SSSCs) developed for  no...
Review regional Source Specific Station Corrections (SSSCs) developed for no...
 
The dynamics of personal income distribution and inequality in the United States
The dynamics of personal income distribution and inequality in the United StatesThe dynamics of personal income distribution and inequality in the United States
The dynamics of personal income distribution and inequality in the United States
 
Global grid of master events for waveform cross correlation: design and testing
Global grid of master events for waveform cross correlation: design and testingGlobal grid of master events for waveform cross correlation: design and testing
Global grid of master events for waveform cross correlation: design and testing
 
Acoustic and seismic effects of the 2013 Chelyabinsk meteorite as measured by...
Acoustic and seismic effects of the 2013 Chelyabinsk meteorite as measured by...Acoustic and seismic effects of the 2013 Chelyabinsk meteorite as measured by...
Acoustic and seismic effects of the 2013 Chelyabinsk meteorite as measured by...
 

Recently uploaded

Earth Day Presentation wow hello nice great
Earth Day Presentation wow hello nice greatEarth Day Presentation wow hello nice great
Earth Day Presentation wow hello nice greatYousafMalik24
 
“Oh GOSH! Reflecting on Hackteria's Collaborative Practices in a Global Do-It...
“Oh GOSH! Reflecting on Hackteria's Collaborative Practices in a Global Do-It...“Oh GOSH! Reflecting on Hackteria's Collaborative Practices in a Global Do-It...
“Oh GOSH! Reflecting on Hackteria's Collaborative Practices in a Global Do-It...Marc Dusseiller Dusjagr
 
Roles & Responsibilities in Pharmacovigilance
Roles & Responsibilities in PharmacovigilanceRoles & Responsibilities in Pharmacovigilance
Roles & Responsibilities in PharmacovigilanceSamikshaHamane
 
Types of Journalistic Writing Grade 8.pptx
Types of Journalistic Writing Grade 8.pptxTypes of Journalistic Writing Grade 8.pptx
Types of Journalistic Writing Grade 8.pptxEyham Joco
 
MARGINALIZATION (Different learners in Marginalized Group
MARGINALIZATION (Different learners in Marginalized GroupMARGINALIZATION (Different learners in Marginalized Group
MARGINALIZATION (Different learners in Marginalized GroupJonathanParaisoCruz
 
EPANDING THE CONTENT OF AN OUTLINE using notes.pptx
EPANDING THE CONTENT OF AN OUTLINE using notes.pptxEPANDING THE CONTENT OF AN OUTLINE using notes.pptx
EPANDING THE CONTENT OF AN OUTLINE using notes.pptxRaymartEstabillo3
 
Software Engineering Methodologies (overview)
Software Engineering Methodologies (overview)Software Engineering Methodologies (overview)
Software Engineering Methodologies (overview)eniolaolutunde
 
Computed Fields and api Depends in the Odoo 17
Computed Fields and api Depends in the Odoo 17Computed Fields and api Depends in the Odoo 17
Computed Fields and api Depends in the Odoo 17Celine George
 
How to Make a Pirate ship Primary Education.pptx
How to Make a Pirate ship Primary Education.pptxHow to Make a Pirate ship Primary Education.pptx
How to Make a Pirate ship Primary Education.pptxmanuelaromero2013
 
POINT- BIOCHEMISTRY SEM 2 ENZYMES UNIT 5.pptx
POINT- BIOCHEMISTRY SEM 2 ENZYMES UNIT 5.pptxPOINT- BIOCHEMISTRY SEM 2 ENZYMES UNIT 5.pptx
POINT- BIOCHEMISTRY SEM 2 ENZYMES UNIT 5.pptxSayali Powar
 
KSHARA STURA .pptx---KSHARA KARMA THERAPY (CAUSTIC THERAPY)————IMP.OF KSHARA ...
KSHARA STURA .pptx---KSHARA KARMA THERAPY (CAUSTIC THERAPY)————IMP.OF KSHARA ...KSHARA STURA .pptx---KSHARA KARMA THERAPY (CAUSTIC THERAPY)————IMP.OF KSHARA ...
KSHARA STURA .pptx---KSHARA KARMA THERAPY (CAUSTIC THERAPY)————IMP.OF KSHARA ...M56BOOKSTORE PRODUCT/SERVICE
 
Painted Grey Ware.pptx, PGW Culture of India
Painted Grey Ware.pptx, PGW Culture of IndiaPainted Grey Ware.pptx, PGW Culture of India
Painted Grey Ware.pptx, PGW Culture of IndiaVirag Sontakke
 
Introduction to ArtificiaI Intelligence in Higher Education
Introduction to ArtificiaI Intelligence in Higher EducationIntroduction to ArtificiaI Intelligence in Higher Education
Introduction to ArtificiaI Intelligence in Higher Educationpboyjonauth
 
Final demo Grade 9 for demo Plan dessert.pptx
Final demo Grade 9 for demo Plan dessert.pptxFinal demo Grade 9 for demo Plan dessert.pptx
Final demo Grade 9 for demo Plan dessert.pptxAvyJaneVismanos
 
Employee wellbeing at the workplace.pptx
Employee wellbeing at the workplace.pptxEmployee wellbeing at the workplace.pptx
Employee wellbeing at the workplace.pptxNirmalaLoungPoorunde1
 
Pharmacognosy Flower 3. Compositae 2023.pdf
Pharmacognosy Flower 3. Compositae 2023.pdfPharmacognosy Flower 3. Compositae 2023.pdf
Pharmacognosy Flower 3. Compositae 2023.pdfMahmoud M. Sallam
 
Solving Puzzles Benefits Everyone (English).pptx
Solving Puzzles Benefits Everyone (English).pptxSolving Puzzles Benefits Everyone (English).pptx
Solving Puzzles Benefits Everyone (English).pptxOH TEIK BIN
 
CELL CYCLE Division Science 8 quarter IV.pptx
CELL CYCLE Division Science 8 quarter IV.pptxCELL CYCLE Division Science 8 quarter IV.pptx
CELL CYCLE Division Science 8 quarter IV.pptxJiesonDelaCerna
 

Recently uploaded (20)

Earth Day Presentation wow hello nice great
Earth Day Presentation wow hello nice greatEarth Day Presentation wow hello nice great
Earth Day Presentation wow hello nice great
 
“Oh GOSH! Reflecting on Hackteria's Collaborative Practices in a Global Do-It...
“Oh GOSH! Reflecting on Hackteria's Collaborative Practices in a Global Do-It...“Oh GOSH! Reflecting on Hackteria's Collaborative Practices in a Global Do-It...
“Oh GOSH! Reflecting on Hackteria's Collaborative Practices in a Global Do-It...
 
Roles & Responsibilities in Pharmacovigilance
Roles & Responsibilities in PharmacovigilanceRoles & Responsibilities in Pharmacovigilance
Roles & Responsibilities in Pharmacovigilance
 
Types of Journalistic Writing Grade 8.pptx
Types of Journalistic Writing Grade 8.pptxTypes of Journalistic Writing Grade 8.pptx
Types of Journalistic Writing Grade 8.pptx
 
MARGINALIZATION (Different learners in Marginalized Group
MARGINALIZATION (Different learners in Marginalized GroupMARGINALIZATION (Different learners in Marginalized Group
MARGINALIZATION (Different learners in Marginalized Group
 
EPANDING THE CONTENT OF AN OUTLINE using notes.pptx
EPANDING THE CONTENT OF AN OUTLINE using notes.pptxEPANDING THE CONTENT OF AN OUTLINE using notes.pptx
EPANDING THE CONTENT OF AN OUTLINE using notes.pptx
 
OS-operating systems- ch04 (Threads) ...
OS-operating systems- ch04 (Threads) ...OS-operating systems- ch04 (Threads) ...
OS-operating systems- ch04 (Threads) ...
 
Software Engineering Methodologies (overview)
Software Engineering Methodologies (overview)Software Engineering Methodologies (overview)
Software Engineering Methodologies (overview)
 
TataKelola dan KamSiber Kecerdasan Buatan v022.pdf
TataKelola dan KamSiber Kecerdasan Buatan v022.pdfTataKelola dan KamSiber Kecerdasan Buatan v022.pdf
TataKelola dan KamSiber Kecerdasan Buatan v022.pdf
 
Computed Fields and api Depends in the Odoo 17
Computed Fields and api Depends in the Odoo 17Computed Fields and api Depends in the Odoo 17
Computed Fields and api Depends in the Odoo 17
 
How to Make a Pirate ship Primary Education.pptx
How to Make a Pirate ship Primary Education.pptxHow to Make a Pirate ship Primary Education.pptx
How to Make a Pirate ship Primary Education.pptx
 
POINT- BIOCHEMISTRY SEM 2 ENZYMES UNIT 5.pptx
POINT- BIOCHEMISTRY SEM 2 ENZYMES UNIT 5.pptxPOINT- BIOCHEMISTRY SEM 2 ENZYMES UNIT 5.pptx
POINT- BIOCHEMISTRY SEM 2 ENZYMES UNIT 5.pptx
 
KSHARA STURA .pptx---KSHARA KARMA THERAPY (CAUSTIC THERAPY)————IMP.OF KSHARA ...
KSHARA STURA .pptx---KSHARA KARMA THERAPY (CAUSTIC THERAPY)————IMP.OF KSHARA ...KSHARA STURA .pptx---KSHARA KARMA THERAPY (CAUSTIC THERAPY)————IMP.OF KSHARA ...
KSHARA STURA .pptx---KSHARA KARMA THERAPY (CAUSTIC THERAPY)————IMP.OF KSHARA ...
 
Painted Grey Ware.pptx, PGW Culture of India
Painted Grey Ware.pptx, PGW Culture of IndiaPainted Grey Ware.pptx, PGW Culture of India
Painted Grey Ware.pptx, PGW Culture of India
 
Introduction to ArtificiaI Intelligence in Higher Education
Introduction to ArtificiaI Intelligence in Higher EducationIntroduction to ArtificiaI Intelligence in Higher Education
Introduction to ArtificiaI Intelligence in Higher Education
 
Final demo Grade 9 for demo Plan dessert.pptx
Final demo Grade 9 for demo Plan dessert.pptxFinal demo Grade 9 for demo Plan dessert.pptx
Final demo Grade 9 for demo Plan dessert.pptx
 
Employee wellbeing at the workplace.pptx
Employee wellbeing at the workplace.pptxEmployee wellbeing at the workplace.pptx
Employee wellbeing at the workplace.pptx
 
Pharmacognosy Flower 3. Compositae 2023.pdf
Pharmacognosy Flower 3. Compositae 2023.pdfPharmacognosy Flower 3. Compositae 2023.pdf
Pharmacognosy Flower 3. Compositae 2023.pdf
 
Solving Puzzles Benefits Everyone (English).pptx
Solving Puzzles Benefits Everyone (English).pptxSolving Puzzles Benefits Everyone (English).pptx
Solving Puzzles Benefits Everyone (English).pptx
 
CELL CYCLE Division Science 8 quarter IV.pptx
CELL CYCLE Division Science 8 quarter IV.pptxCELL CYCLE Division Science 8 quarter IV.pptx
CELL CYCLE Division Science 8 quarter IV.pptx
 

Investigation of repeated events at Jordan phosphate mine with waveform cross cottelation

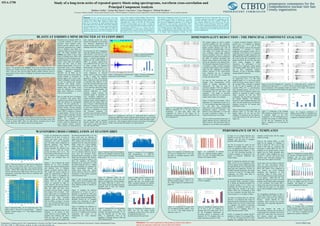
  • 1. Study of a long-term series of repeated quarry blasts using spectrograms, waveform cross-correlation and Principal Component Analysis Matthew Yedlin1, Yochai Ben Horin2, Ivan Kitov3, Gary Margrave4, Mikhail Rozhkov3 1University of British Columbia, 2Soreq Nuclear Research Centre, 3CTBTO Preparatory Commission for the Comprehensive Nuclear Test-Ban Organization, 4Devon Canada Corporation Abstract We have collected and processed 1654 Jordan Phosphate Mines quarry blast waveforms recorded by the three component (3-C) station HRFI. Judging by satellite images taken for the same period, the largest spacing between these blasts might exceed 20 km while their seismic (ML) magnitudes vary in the range from 2 to 3. We have selected short waveform segments (8 min.) for each of 1654 signals, and aligned all waveforms to the Pn-wave arrival times as picked by the same detection procedure based on the STA/LTA threshold. For each event, we have created a waveform template. These waveform templates were obtained by appropriate bandpass filtering, with bands chosen heuristically by examining a spectrogram movie constructed from a subset of the data. We cross-correlated 1654x1654 waveform-template pairs in order to estimate the level of similarity between the measured signals as expressed by cross-correlation coefficient (CC). As a result of the cross- correlation procedure, a CC time series is created to which we apply standard STA/LTA detector with the same threshold as for the original waveforms to find arrival times in the CC domain. When only the Z-component is used for CC, the best four 12.5 s long templates can find all other 1653 signals. For 3-C records, there are 119 templates which can find all other signals and these observations highlight the importance of 3-C records for the performance of the waveform cross-correlation (WCC) technique. It is also found that longer templates result in lower cross-correlation because of larger difference in the shape of S- waves. To characterize the overall similarity of the whole set, we have used the Principal Component Analysis (PCA) as based on the Singular Value Decomposition technique. We have demonstrated that the level of eigenvalues falls to 0.2 for the first fifteen components and the first five components are able to find all 1654 signals when WCC is applied. Therefore, the first component obtained by SVD may serve as the most effective detector for the studied quarry. When SVD is applied to each of three components separately, the level of coherency between vertical and horizontal components falls and the level of cross-correlation does not exceed that observed for the SVD for the Z-component only. Disclaimer: The views expressed on this poster are those of the authors and do not necessary reflect the views of the PTS CTBTO DIMENSIONALITY REDUCTION : THE PRINCIPAL COMPONENT ANALYSIS WAVEFORM CROSS CORRELATION AT STATION HRFI PERFORMANCE OF PCA TEMPLATES Preparatory Commission for the Comprehensive Nuclear-Test Ban Treaty Organization, Provisional Technical Secretariat, Vienna International Centre, P.O. Box 1200, A-1400 Vienna, Austria. E-mail: ivan.kitov@ctbto.org www.ctbto.org S51A-2758 Figure 1. The phosphate mine Eshidiya, 70 km away from Ma'an District and 330 km from Amman, has been extracting fossils using chemical blasts since 1989. It has two sites with the largest possible distance between events of approximately 20 km, which is a challenge for detection using waveform cross correlation Figure 2. A few thousand blasts were conducted within the quarry. For the study of waveform cross correlation, we have selected 1654 events (blue circles) with records at station HRFI. There are other stations measuring most of these events: PRNI, EIL, ASF, MMAI, which will be studied next. Waveform cross correlation (WCC) is a powerful technique to detect and accurately locate repeated events. Quarries provide extensive series of waveforms characterized by a higher level of similarity since blasts are conducted within a few km from each other. The Jordan phosphate mine Eshidiya (see Figure 1) has a long history of blasting (since 1989), with thousands of events measured at near- regional distances by several seismic stations. These blasts have different yields, and thus, some of them produce stronger signals. The level of microseismic noise is also changing within a day and between seasons that changes detection conditions. Therefore, not all blasts can be detected even by the nearest stations. Another problem is association of detected signals with a given mine. Natural earthquakes around quarries can also be detected and wrongly associated with mining activity. Waveform cross correlation is able to separate blasts and natural events using the difference in waveform shape and/or differences in arrival times at several stations. Here we study the level of similarity of waveforms from quarry blasts conducted at the Eshidiya mine since 2004 and detected at near-regional distances. We have selected the 3- component station HRFI of the Israel National Seismic Network operated by Geophysical Institute of Israel (GII Israel). HRFI is situated at a distance of approximately 130 km from the quarry, as Figure 2 illustrates, and has sampling rate of 40 Hz. We use 1654 signals for waveform cross correlation. Figure 2 depicts locations of these events as measured by the Israel National Seismic Network. These locations are characterized by high scattering around the mine, beyond the boundaries of the blasting area. Therefore, identification and accurate location of these events is a challenge for the WCC method. We processed all 1654 seismograms using the standard detector STA/LTA with STA=0.5 s and LTA=20 s and detected all 1654 signals with SNR>4. Figure 3 presents spectrograms as obtained for the vertical channel of HRFI. To increase signal-to-noise ratio (SNR=STA/LTA) we used a set of filters covering the frequency bands between 1 Hz and 16 Hz: 1) 1-3 Hz, 2) 2-4 Hz, 3) 3-6 Hz, 4) 4-8 Hz, 5) 6-12 Hz, 6) 8-16 Hz. This set covers frequencies of observed signals: from P to Rg waves. Figures 4 and 5 depict the frequency distribution of SNR and detection filters, respectively. Just a few dozens of detections have SNR<10. At the same time, the peak SNR value varies between filters, with a larger part of P-wave detections observed at higher frequencies. To accommodate the observed differences in relative frequency content between the measured signals in calculation of cross correlation coefficients, we created waveform templates in all six frequency bands. Typical templates as obtained from the quarry blasts are show in Figure 6, which illustrates the difference in frequency content of the P- and S-wave arrivals as well as the difference in amplitudes of vertical and horizontal component. For waveform cross correlation, each blast from the 1654 can play the role of master and slave. The studied blasts were conducted between January 2004 and January 2015. There is a gap in data between June 2007 and July 2010. Figure 6. 3-C templates (E – east-west, N – north-south, and Z - vertical) as measured by HRFI from 4 blasts conducted within the quarry. Each waveform has been filtered in six frequency bands in order to obtain the highest signal- to-noise ratio. Three frequency bands are shown in the Figure. All templates include 5-second-long (200 samples) pre-signal segments. Figure 9. Detection rates for all templates. There are 501 templates which have found all slave signals with detection threshold SNRCC=3.0 At first, we calculated cross correlation coefficient for all pairs of events as masters and slaves using all three components (3-C) and Z-component only. This allows direct comparison of detection efficiency, with standard SNRCC=STA/LTA>3.0 used as a detector threshold. We selected a time window of 15 s after the P-wave arrivals and filters from 2 to 6. The lower frequency filter between 1 Hz and 3 Hz is sensitive to the ambient noise, and thus, was excluded from our analysis. Figures 7 and 8 illustrate the results obtained for 3-C cross correlation. There are three distinct blasting periods with different level of similarity between waveforms. Between 2004 to 2007 (upper left corner), majority of signals are characterized by high CC above 0.7, which is accompanied by high SNRs shown in Figure 8. The signals measured between 2010 and January 2014 are split in smaller clusters as expressed by high CC values. However, they do not correlate well with the signals measured between 2004 and 2007 and have lower correlation with the signals observed from January 2014 to January 2015 (lower right corner). It is important that there exist events, whose signals do not correlate with other waveform templates. These are likely the events with low SNRCC in Figure 4. In some cases, cross correlation detection can be more efficient than that with original waveforms. Figure 9 presents detection rates for all templates, i.e. the portion of slave events found by a given template. All templates have detection rate above 0.996 and there are 501 templates, which have found all slave signals with the detection threshold SNRCC=3.0. The latter could serve for detection of signals from the studied quarry with the WCC method. One can select the best templates from 501 using the minimum SNRCC values for a given template, which are shown in Figure 10. The largest value of SNRCCmin is above 3.75 and several templates can best serve for detection. Moreover, for any given slave the lowermost SNRCC among all masters is around 8, i.e. much higher than the smallest SNR found by in original waveforms in Figure 4. For these two templates, the detection threshold can be increased to 3.5 with the perfect detection rate of 1. Higher detection thresholds are important for better discrimination between the studied quarry blasts and natural seismic sources as well as for effective elimination of false alarms associated with microseismic noise. Figure 11 and 12 presents the average SNRCC and CC for each template, with non detections (SNRCC<3.0) excluded. Three different periods of blasting are clearly seen. Figure 13 compares the detection performance of 10 best 3-C and Z- templates as expressed by SNRCCmin. The 3-C templates are characterized by higher values and provide larger SNRCC threshold. Overall, the 3-C templates contain more information on signals and better suppress the ambient noise. Figure 14 illustrates the difference in detection filters between 3-C and Z- templates. The most efficient filter is lower for 3-C templates since horizontal components (see Figure 6) are characterized by lower frequency content. Figure 10. Minimum SNRCC for all templates, which is 0 when at least one signal is not detected by a given template. The largest SNRCCmin is above 3.75, which can be used as the highest detection threshold with at least one template detecting all signals Figure 11. Average SNRCC for all templates, with non-detections, i.e. SNRCC<3.0, excluded. The largest mean SNRCC is ~8.5, also with detection rate 1.0. The mean SNRCC is significantly lower in the beginning of blasting (between 2004 and 2007) and during 2014. Figure 12. Average CC for all templates, with non-detections, i.e. SNR<3.0, excluded. Three periods and clusters are clear seen. Figure 8. Maximum SNRCC for all master/slave pairs. The highest SNR is observed for autocorrelation - diagonal elements. Window length is 15 s. Three highest frequency band are used. Figure 7. Maximum absolute CC-values for all master/slave pairs. There are clear clusters with CC close to 1, which are likely series of spatially close blasts. There are three distinct periods – 2004 to 2007 (upper left corner), 2010 to the end of 2013, and 2014 (lower right corner). There are events (as expressed by vertical blue lines) with low correlation with all other templates. Figure 3. Spectrogram of a typical signal measured at vertical channel Figure 14. Distribution of detections over filters. For 3-C, the largest number corresponds to filter 4 Hz to 8 Hz, and for Z-component the peak is for the filter between 8 Hz and 16 Hz. Figure 4. Frequency distribution of SNR of detected P-waves Figure 5. Frequency distribution of detections over filters Figure 15. All eigenvalues obtained by SVD for 3 different components (E, N, Z) and 6 filters we normalized to their peak values. Only 100 components are shown in this Figure. For Z- component, normalized eigenvalues fall below 0.2 for PCA component 10. BLASTS AT ESHIDIYA MINE DETECTED AT STATION HRFI The original signals are used to prepare waveform templates for cross correlation. Some of these templates demonstrate the highest possible detection rate with all slaves found for threshold SNRCC>3.0 and even SNRCC>3.75. Overall, the result of cross correlation implies high similarity between waveforms. Lower CC values for some master/slave pairs can be explained by the effect of similarity decreasing with distance and/or change in blast setting, but also by the influence of the ambient noise. The Principle Component Analysis (PCA) is a technique to obtain waveform templates retrieving similar features from all signals, which are also orthogonal to permanent features observed in the micro-seismic noise. Therefore, the use of templates obtained by the PCA may increase the average and minimal SNR. We used all 1654 waveforms and the Singular Value Decomposition (SVD) method to calculate eigenvalues and eigenvectors. The latter are used as waveform templates. SVD was applied to three sets of signals measured at E-, N-, and Z-components and to each filter band separately. The length of waveform segment for the SVD was 75 s, and thus, all regular seismic phases were included. Figure 15 illustrates the dramatic fall in eigenvalues for components beyond 10 to 15. The normalized eigenvalue drops below 0.2, and thus, the corresponding eigenvectors do not contribute much to the decomposed original waveforms. The behavior of the eigenvalues is in line with the result of detection in Figure 9 - the original waveforms are very similar. The rate of fall in normalized eigenvalues is slightly different between components and filters, however. This observation makes it important to use all filters and components to prepare waveform templates. Figure 16 presents four 3-C templates as compiled from eigenvectors 1, 2, 5, and 10. The difference between vertical and horizontal components is expressed in relative amplitudes and frequency content. The Z- component of the P-wave is of relatively higher amplitude at higher frequencies, but this difference decreases with frequency. For the S-wave group, the E-component is the highest between 4 Hz and 8 Hz, but shear waves almost disappear at higher frequencies. The performance of the obtained PCA components should change with template length, filter, and the use of one or three components together. Therefore, we have to determine template settings optimal for detection. At first, we calculated CC-traces and SNRCC for eigenvectors from 1 to 100 using template length 15 s, i.e. the P-wave group before the S-wave arrival. Figure 17 shows the averaged SNRCC estimates as obtained for the 3-C and Z templates. We have excluded SNRCC<3.0, i.e. non-detections, from averaging process. The use of 3-C templates in cross correlation is likely more efficient as expressed by higher average SNRCC observed for first two PCA components. The same effect is observed for the original templates. The difference between 3-C and Z-templates decreases with index. One also should not use for detection templates beyond the 10th because their performance is poor. Figure 18 presents frequency distribution of detection filters (i.e. the filter with the highest SNRCC) for the first ten PCA templates. For detection, the most effective is the filter between 8 Hz and 16 Hz (see Figure 16). Figure 16. Four PCA templates (E – east-west, N – north-south, and Z - vertical) as compiled from eigenvectors 1, 2, 5, and 10, which were obtained separately for E-, N- and Z-components. Three frequency bands are shown in the Figure. All templates include 2.5-second-long (100 samples) pre-signal segments. Figure 17. Comparison of the averaged SNR estimates as obtained for the 3-C and Z templates based on the PCA components 1 to 100. Non-detections are excluded. The average 3-C SNR estimates for the first two components are the largest. Templates 1 to 10 are the best in both cases. Figure 18. Frequency distribution of detection filters for the 3-C templates from 1 to 10. The filter between 8 Hz and 16 Hz is superior for detection with PCA. Figure 19. Comparison of detection rates for Z and 3-C templates from 1 to 50. The first three 3-C templates guarantee 100% detection rate. Figure 20. Comparison of average CC for different template lengths – from 7.5 s to 40 s. Shorter signals are characterized by higher CC Figure 21. Comparison of average SNR for for different template lengths – from 7.5 s to 40 s. The length optimal for detection is near 15 s. Figure 27. Average SNRCC as obtained for 100 templates from station EIL and all signals recorded at HRFI. Template length is 15 s. The level of similarity between signals at two stations is illustrative. In Figure 19, we compare detection rates obtained for the first 50 Z and 3-C PCA templates. The first three Z templates guarantee 100% detection rate. The first 10 average CC values for four different 3-C template lengths – from 7.5 s to 40 s are displayed in Figure 20. Overall, shorter templates produce higher CC. This is in line with increasing specificity of waveform templates as expressed by the product of frequency bandwidth and window length. Figure 21 presents the estimates of average SNRCC for first 10 3-C components. There exists an optimal window length expressing the trade-off between cross correlation with signal and noise suppression. Overall, for the HRFI principal components, this length is between 15 s and 25 s. For higher order components, the SNRCC peak shifts to longer windows, however. A more important detection characteristic is the minimum SNRCC presented in Figure 22. It defines the detection threshold. For the shortest window of 7.5 s, there is no component with 100% detection rate. The largest SNRCCmin belongs to the longest window. When only Z-component is used for cross correlation, the peak SNRCCmin value increases to 3.3, as Figure 23 shows. The choice of optimal filters for efficient detection is an important task. Figure 24 depicts the portion of detections as obtained by filters from 2 to 6 for the 10 first Z and 3-C templates. The portion of detections obtained by Z-templates increases with frequency. For 3-C templates, there is a deeper minimum around 3rd filter. Finally, we compare the original and PCA templates. In Figure 25, the average SNRCC for the best 10 original and first 10 PCA templates are presented. The 3-C PCA templates correlate better with the original signals on average. However, the smallest SNRCC is much higher for the original 3-C templates, as shown in Figure 26. This is one of main results of this study. In continuous data processing at station HRFI, the best 3-C templates are an optimal choice to detect signals from the Jordan phosphate mine. The length of these templates has to be between 15 s and 25 s and all five filters should be used. With these templates, we could expect more signals to be found. At this stage, only one station is analyzed. There are other near-regional stations, which measured the same events, e.g. EIL, PRNI, ASF, MMAI. Cross comparison of these stations can reveal important similarities and differences in their waveforms. Figure 27 shows results of cross correlation between signals measured at two stations - HRFI and EIL. One hundred EIL signal were used as waveform templates and all HRFI signals participated in cross correlation. The average SNR is almost at the same level as between signals of HRFI only (see Figure 11). EIL signals can be used as templates to detect signals at HRFI. The Geographical distribution of these 5 stations allows effective relative location of quarry blasts using travel time difference between arrivals detected by cross correlation, which provide more accurate onset times. This is especially important for weak signals. We will continue the study of dimensionality reduction and are going to extend simple PCA methods to the level of tensor PCA, which takes into account the link between vertical and horizontal components of the same records. Figure 22. Comparison of minimal SNRCC for different template lengths – from 7.5 s to 40 s. The largest SNRCCmin belongs to the longest window. Figure 13. SNRCCmin for 10 best 3-C and Z- templates. The 3-C templates are superior, and thus, can provide larger SNRCC threshold important for efficient signal separation from background noise. Figure 23. Comparison of min SNR for Z and 3-C templates. Figure 24. Distribution of detection filters for 10 first Z and 3-C templates as obtained from PCA eigenvectors. All in all, the Z-templates demonstrate an increasing portion of detections with frequency. For 3-C templates, there is a deeper minimum around the 3rd filter. Figure 25. Comparison of average SNRCC for the best 10 original and first 10 PCA templates. The 3-C PCA templates correlate better with original signals on average. Figure 26. Comparison of min SNRCC for the best 10 original and first 10 PCA templates. The original 3-C templates are most appropriate for detection.