Recovery of aftershock sequences using waveform cross correlation: from catastrophic earthquakes to smallest aftershocks
•
1 like•95 views

Description of a software package for signal detection and association using waveform cross correlation. Recovery of aftershock sequences of the largest events: Sumatra 2004 and Tohoku 2011. Finding of a small aftershock of the September 9, 2016 DPRK test.
Recommended

Recommended
More Related Content
What's hot
What's hot (20)
Similar to Recovery of aftershock sequences using waveform cross correlation: from catastrophic earthquakes to smallest aftershocks
Similar to Recovery of aftershock sequences using waveform cross correlation: from catastrophic earthquakes to smallest aftershocks (20)
More from Ivan Kitov
More from Ivan Kitov (14)
Recently uploaded
Recently uploaded (20)
Recovery of aftershock sequences using waveform cross correlation: from catastrophic earthquakes to smallest aftershocks
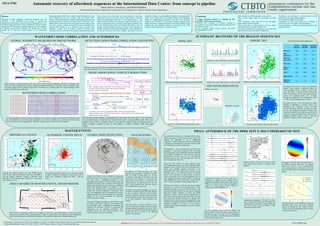
- 1. Automatic recovery of aftershock sequences at the International Data Centre: from concept to pipeline Dmitry Bobrov, Ivan Kitov, and Mikhail Rozhkov International Data Centre, Preparatory Commission for the Comprehensive Nuclear Test-Ban Treaty Organization Abstract Aftershocks of larger earthquakes represent an important source of information on the distribution and evolution of stresses and deformations in pre-seismic, co-seismic and post-seismic phases. For the International Data Centre (IDC) of the Comprehensive Nuclear-Test-Ban Organization (CTBTO) largest aftershocks sequences are also a challenge for automatic and interactive processing. The highest rate of events recorded by two and more seismic stations of the International Monitoring System (IMS) from a relatively small aftershock area may reach hundreds per hour (e.g. Sumatra 2004 and Tohoku 2011). Moreover, there are thousands of reflected/refracted phases per hour with azimuth and slowness within the uncertainty limits of the first P-waves. Misassociation of these later phases, both regular and site specific, as the first P-wave results in creation of numerous wrong event hypotheses in automatic IDC pipeline. In turn, interactive review of such wrong hypotheses is direct waste of analysts’ resources. Waveform cross correlation (WCC) is a powerful tool to separate coda phases from actual P-wave arrivals and to fully utilize the repeat character of waveforms generated by events close in space. Array seismic stations of the IMS enhance the performance of the WCC in two important aspects – they reduce detection threshold and effectively suppress arrivals from all sources except master events. A prototype of IDC specific aftershock tool has been developed and merged with standard IDC pipeline. The tool includes several procedures: creation of master events consisting of waveform templates at ten and more IMS stations; cross correlation (CC) of real-time waveforms with these templates, association of arrivals detected at CC-traces in event hypotheses; building events matching IDC quality criteria; and resolution of conflicts between events hypotheses created by neighbouring master-events. The final cross correlation standard event lists (XSEL) is a start point of interactive analysis. Since global monitoring of underground nuclear tests is based on historical and synthetic data, each aftershock sequence can be tested for the CTBT violation with big earthquakes as an evasion scenario. Disclaimer: The views expressed on this poster are those of the authors and do not necessary reflect the views of the PTS CTBTO AUTOMATIC RECOVERY OF THE BIGGEST SEQUENCIESWAVEFORM CROSS CORRELATION AND AFTERSHOCKS MASTER EVENTS SMALL AFTERSHOCK OF THE DPRK SEPT 9, 2016 UNDERGROUND TEST Preparatory Commission for the Comprehensive Nuclear-Test Ban Treaty Organization, Provisional Technical Secretariat, Vienna International Centre, P.O. Box 1200, A-1400 Vienna, Austria. E-mail: ivan.kitov@ctbto.org www.ctbto.org S31A-2703 Conclusion A bigger aftershock sequence is a challenge for IDC automatic and interactive processing. Waveform cross correlation is an effective technique to accurately recover even the biggest aftershock sequences with thousands of events. Cross correlation bulletin (XSEL) includes only REB- compatible (EDC) events. XSEL provides more REB-compatible events than GA. XSEL provides higher quality and consistency for REB events. XSEL completeness grows with time as new and higher quality master events are available. XSEL events need no global location and have smaller confidence ellipses as related to master events. The analysts’ workload may be reduced by several times with higher location accuracy and bulletin completeness. Waveforms cross correlation is a powerful tool for REB quality check and expert technical analysis. Cross correlation works best with arrays. Configuration of IMS arrays should not be changed to preserve the same set of master events and templates. Cross correlation is an effective monitoring method for weak aftershock activity. The method of waveform cross correlation (WCC) allows remote monitoring of weak seismic activity induced by moderate size earthquakes as well as underground explosions. For nuclear explosions, this type of monitoring is considered as a principal task of on-site inspection under the Comprehensive nuclear-test-ban treaty. On September 11, 2016, a seismic event with body wave magnitude 2.1 was found in automatic WCC processing near the epicenter of the underground explosion conducted by the DPRK on September 9, 2016. This event occurred approximately two days after the test. The automatic procedure based on WCC was developed by the IDC and runs in testing mode since 2011. Using the WCC method, two array stations of the International Monitoring System (IMS), USRK and KSRS, detected Pn-wave arrivals, which were associated with a unique event. Standard automatic processing at the International Data Centre (IDC) did not create an event hypothesis, but in the following interactive processing based on WCC detections, an IDC analyst was able to create a two-station event with local magnitude ML=2.4 (after magnitude correction at station USRK). Location and other characteristics of this small seismic source indicate that it is likely an aftershock of the preceding explosion. Building on the success of automatic detection and phase association, we carried out an extended analysis, which included later phases and closest non-IMS stations. The final cross correlation solution uses four stations, including MDJ (The People's Republic of China) and SEHB (Republic of Korea), with the epicenter approximately 2 km to north-west from the epicenter of the Sept. 9 test. We also located the aftershock epicenter by standard IDC program LocSAT using the arrival times obtained by cross correlation. The distance between the DPRK and LocSAT aftershock epicenters is 25.5 km, i.e. by an order of magnitude larger than that obtained by the WCC relative location method. Component-to-component, E-W (H1), N-S (H2), Z, comparison of signals from the DPRK5 and its aftershock as measured at IMS stations USRK (a) and KSRS (b). Pn- and Pg-waves from the aftershock at channels H1 (E-W) and H2 (N-S) of USRK are similar to those from the DPRK5 - c). The local association grid around the DPRK4. The distance between circles and nodes is approximately 15 km. Red star shows the node with the automatically found event hypothesis. The RMS origin time residual for the two-station event is 0.054 s. Component-to-component, E-W (H1), N-S (H2), and Z, comparison of signals from the DPRK5 and its aftershock as measured at stations SEHB and MDJ. The Pn-wave arrival at SEHB is poor, nevertheless found by WCC. Relative positions of the test site (star), two IMS arrays (open circles), and two 3-C stations (open triangles). The position of the aftershock (red dot) relative to the DPRK5 epicenter (blue dot). The distance between two events is ~2 km as estimated from cross correlation arrivals at four stations. Color bar shows the RMS origin time residual measured in seconds. Absolute locations of the DPRK5 (red star) and aftershock (blue circle) with 90% confidence ellipses as obtained by IDC location software LocSAT. The result of aftershock relative location is shown by green circle. a) b) c) For purposes of signal association and event location, each grid point is extended by a subnet with five circles of nodes spaces by ~25 km. Coordinates of all nodes for all masters are fixed and saved in WCC database. For each node, the master-station travel times are corrected for the distance between the global grid point and the node. These corrected travel times are used in arrival association by origin times. All nodes are processed individually, but may use the same set of physical signals (arrivals) obtained by cross correlation. The node with the largest number of associated stations and the lowermost scattering (RMS) of origin times wins and is saved as an event hypothesis. Other hypotheses are rejected. The fifths circle is ~100 km in radius (i.e. very close to the grid points of adjacent masters) and all winning hypotheses obtained at this circle, which are many, are rejected in further conflict resolution because they must be found by the adjacent masters in the first place Global Grid of Master Events is designed for finding and location of seismic events based on cross-correlation (CC). The whole globe is subdivided uniformly by cells surrounding the grid points. The IMS stations consider the hypotheses of seismic event occurrence within these cells based on matched filter detection with the pre-established Master Event signals (template). The template is a set of certain data, including array multi-channel waveforms, azimuth and slowness estimations, event-station travel times, and magnitude. When the predefined and master- station dependent WCC detection threshold is exceeded as triggered by the current seismogram, the multi-stage location procedure is started. The choice of adequate templates is one of the key points of detection and location procedures. Real masters work best for similar events – earthquakes for earthquakes and explosions for explosions. All kind of sources and thus seismograms can be simulated numerically. These synthetic master events most useful in aseismic zones, where real master events are not available. GLOBAL SEISMICITY MEASURED BY IMS NETWORK WAVEFORM CROSS CORRELATION DETECTION USING CROSS CORRELATION COEFFICIENT PHASE ASSOCIATION, CONFLICT RESOLUTION Global seismicity is unevenly distributed with a few zones, where catastrophic earthquakes with Mw>7 can happen. Such events are usually accompanied by extensive aftershock sequences (black areas in the map), which are repeated events with similar signals within a relatively tight territory. Waveform cross correlation (WCC) is a natural method to detect signals and associate them with events. We select high quality waveform templates (left panel) from a number of master events measured at IMS stations and run cross correlation over real-time signals (right panel). For an array, we calculate CC on each trace and then average them over all traces to get an aggregate CC. Selection of master events is crucial for the WCC method. Detection is carried out with STA/LTA method adapted at the IDC. Detection threshold depends on station (3-C, array). When detected on a CC-trace, all signals are processed by standard procedures to estimate their attributes, After extensive quality checking, valid detections are associated with events with a Local Association (LA) procedure based on empirical travel times between master events and IMS stations. IDC event definition criteria (EDC) are applied. When several masters compete for the same physical arrival, conflict resolution is applied as based on event quality, i.e. number of phases, RMS origin time residual. HISTORICAL EVENTS AUTOMATIC EVENTS (SEL3) GLOBAL GRID (DETECTION) Currently, IDC database includes more than 500,000 seismic events. We have selected 6,000 master events, also with depth, to cover the observed seismicity. Example of historical events (open black circles) available before Tohoku 2011. Green circles - IDC interactive events. REGULAR GRID OF MASTER EVENTS, GRAND MASTER IDC produces automatic event list, SEL3, which may contain a number of quality event hypothesis, which can be used as master events. Example of Tohoku 2011 SEL3 – open red circles. When historical or automatic events are not available in some zones, one (Grand Master) or several best quality events can be moved from their estimated positions to nodes of a regular grid to cover these blind spots. Grand Master creates a uniform master set with uniform resolution over the studied area and can be extended to global level. NEPAL 2015 GG (LOCATION) TOHOKU 2011 Selection of master events (red circles) from the REB Recovery of the aftershock sequence (blue circles) Selection of master events (red circles) from the REB. Recovery of the aftershock sequence (blue circles) Nepal 2015: input of IMS stations to XSEL and REB Tohoku 2011: input of IMS stations to XSEL and REB NEPAL (2015115) TOHOKU (2011070) SUMATRA (2004361) REB ALL 286 797 724 REB aftershocks 209 725 625 REB with SEL3 evid’s 132 538 497 SEL3 ALL 262 887 910 SEL3 in AREA 109 628 526 XSEL 362 1408 1459 REB FOUND 197 694 592 REB NOT FOUND 12 31 33 STATISTICS OF PERFORMANCE NEPAL: 12 events NOT FOUND REB EVENTS TOHOKU: 31 event The pipeline based of the waveform cross correlation method is more effective in automatic finding real event hypotheses (XSEL vs. SEL3 with the same evid’s and XSEL vs. REB FOUND)) matching the IDC Event Definition Criteria and creates much less invalid event hypothesis (SEL3 ALL vs REB). Overall, the completeness of the REB increases (REB vs. XSEL) with decreasing analyst workload. By design, the WCC is also characterized by higher potential of adjustment to specific sources, e.g. earthquakes and explosions. When recovering intensive aftershock sequences (hundreds of events per day) with standard seismological methods based on detections related to the change in energy flux one might miss bigger man-made events. Fine tuning of templates to specific sources is able to reduce the threshold of detection for the events of interest.