Warrp sesimic_ aghazde
•Download as PPTX, PDF•
1 like•157 views

wide aperture reflection refraction profiling is studied in this presentation ,\

Recommended
Recommended
More Related Content
What's hot
What's hot (20)
Similar to Warrp sesimic_ aghazde
Similar to Warrp sesimic_ aghazde (20)
More from Inistute of Geophysics, Tehran university , Tehran/ iran
More from Inistute of Geophysics, Tehran university , Tehran/ iran (10)
Recently uploaded
Recently uploaded (20)
Warrp sesimic_ aghazde
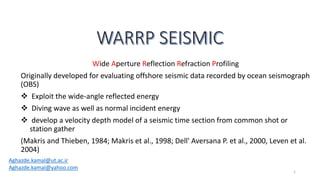
- 1. Wide Aperture Reflection Refraction Profiling Originally developed for evaluating offshore seismic data recorded by ocean seismograph (OBS) Exploit the wide-angle reflected energy Diving wave as well as normal incident energy develop a velocity depth model of a seismic time section from common shot or station gather (Makris and Thieben, 1984; Makris et al., 1998; Dell' Aversana P. et al., 2000, Leven et al. 2004) 1 Aghazde.kamal@ut.ac.ir Aghazde.kamal@yahoo.com
- 2. Coparing Warrp & conventional methods Short ranged near normal incidence long ranges large produce “image “ of impedance contrasts angle of incident Detailed structure: sediments,faults,etc produce”model” of structure major variation only 2
- 3. • Long offset data: Observe the wave field of Diving waves & Wide angle reflection that have penetrated deeper into section 3
- 4. 4
- 5. energy conversion at the interface between two layers in a simple, two layer case. 5
- 6. energy partitioning between the p and s phases Greater portion of energy propagate in reflected phase at angles of incidence beyond the critical angle. Beyond the critical distance S-waves penetrate and map the structure where P- waves are no more transmitted. 6
- 7. Warrp is modelling not a processing technique. • Warrp is based on: first break tomography none linear tomography by exploiting later arrival forward modelling by ray tracing or finite difference calculation Velocity model is used to time and depth migrate the common shot gathers 7
- 8. Effective under conditions where CDP approach fails to reveal subsurface structure. essential to observe offsets significantly larger than the depth of the target zone. penetrate the geological structures with sufficiently redundant seismic energy. 8
- 9. 9
- 10. Invert for velocity structure on a grid (akin to medical tomography) Can formulate problem as: 10
- 11. • First break picks: an initial estimate of velocity structure of any seismic profile 11
- 12. First break for tomography inversion 12
- 13. Defining velocities for the different layers that are identified 13
- 14. 14
- 15. the spatial of a warrp model depends on the density of shots and receivers and the redundancy of the seismic energy that penetrates the different parts of the model. The advantage of WARRP mapping over a standard CDP or CRS- survey is that since CDP or CRS-stacking is not needed we can map the subsurface using less shots (i.e. one out of three). Also modeling is accomplished on the real topography and static corrections are not needed. 15
- 16. In order to improve the velocity model derived by the first break inversion and define the boundaries of the velocity layers, first order discontinuities are introduced in the zones of steep velocity gradients. The v(x,z)-functions within these layers are basically substantiated by the apparent velocities of reversed observations over identical parts of a line, as directly derived from CSG observations and the velocity gradient model that first break tomography has produced. The identification procedure is based on a cross-correlation procedure using amplitudes and waveform characteristics. 16
- 17. • In order to improve the velocity model derived by the first break inversion and define the boundaries of the velocity layers, first order discontinuities are introduced in the zones of steep velocity gradients. The v(x,z)-functions within these layers are basically substantiated by the apparent velocities of reversed observations over identical parts of a line, as directly derived from CSG observations and the velocity gradient model that first break tomography has produced. The identified arrivals for first breaks and reflected phases are presented in below 2 figures . The identification procedure is based on a cross- correlation procedure using amplitudes and waveform characteristics. Wrongly picked and correlated arrivals are manually corrected. 17
- 18. 18 identification arrivals for first breaks and reflected phases
- 19. 19
- 20. 20
- 21. 21
- 22. 22
- 23. 23
- 24. 24
- 25. 25
- 26. 26
- 27. • The P-wave speed-depth structure is finalized by iterative forward modeling as stated above using a modified and optimized ray tracing software program. • The starting P-wave speed-depth model is derived from correlated travel times in the WARRP sections by evaluating apparent velocities and depth of shallow structures. The P wave speed model is finalized when the observed arrival times of reflected and refracted energy and the observed amplitudes are reproduced by the model within acceptable limits defined by the picking accuracy of the first arrivals. 27
- 28. simplified schema of the ray paths explioted in this procedure 28 Similar to first arrival tomography but now we can include wide-angle reflections, which tell us about “velocity discontinuities" Reflection-refraction tomography
- 29. Guess velocity structure (based on graphical fit, 1D models etc) Calculate expected travel times for this model Compare expected travel times with observed travel times Refine model and repeat 29
- 30. One example of a ray traced CSG and its synthetic amplitudes 30
- 31. • to delineate small scale structures, smoothed usually by ray-tracing, and resolve faults and tectonic details, prestack migration is necessary. Algorithm described in details by: • Pilipenko, V.N. and Makris, J. (1997) and Pilipenko, V.N. (1982). 31
- 32. 32
Editor's Notes
- Static or any other corrections, except instrumental time drift effects, are not required for this procedure.
- However one should not forget that energy propagation is alsoa function of the geology itslef. Since the velocity model must satisfy all traveltimes of the CSG, along a seismic line.
- This procedure is constrained at its initial steps by the linear tomographic velocity model as described above.