Waveform cross correlation: coherency of seismic signals estimated from repeated mining blasts

Waveform cross correlation (WCC) is an optimal detection technique for signals from spatially close seismic sources. Observations at various distances from a multitude of sources in a variety of seismotectonic and geological conditions demonstrate that signals from close events recorded at common stations are characterized by high level of similarity. Signals from remote sources are less similar mainly because of the variations in propagation paths. Different parts of a complete seismic wavetrain have different sensitivity to the propagation path. The initial part retains general characteristics of the source time function. The shape of later seismic phases is chiefly defined by propagation path. Here, we investigate the level of similarity between hundreds of signals generated by chemical blasts within a phosphate mine in Jordan and measured by 5 seismic stations at near-regional distances. We have revealed a much higher similarity of the first 3 s to 5 s of signals from different blasts, also at distances of about 20 km, at the same station as well as at different stations. This observation evidences in favour of high coherency in the initial part of signals at all stations. We also demonstrate that the observed coherency allows the use of very short (say, 3 s) waveform templates for detection and further phase association of signals based on cross correlation. Longer templates are characterized by larger overall signal specificity, which may reduce detection threshold and spatial resolution of the WCC method. However, different propagation paths within the same geological province may have similar transfer functions producing regular seismic phases with similar shapes independent on source position. This may increase the number of false detections from remote sources. We compare the performance of short and long waveform templates using detection statistics and the results of event hypotheses creation and further event location.
Recommended

Recommended
More Related Content
What's hot
What's hot (20)
Similar to Waveform cross correlation: coherency of seismic signals estimated from repeated mining blasts
Similar to Waveform cross correlation: coherency of seismic signals estimated from repeated mining blasts (20)
More from Ivan Kitov
More from Ivan Kitov (20)
Recently uploaded
Recently uploaded (20)
Waveform cross correlation: coherency of seismic signals estimated from repeated mining blasts
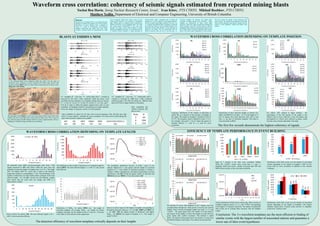
- 1. Abstract Waveform cross correlation (WCC) is an optimal detection technique for signals from spatially close seismic sources. Observations at various distances from a multitude of sources in a variety of seismotectonic and geological conditions demonstrate that signals from close events recorded at common stations are characterized by a high level of similarity. Signals from remote sources are less similar mainly because of the variations in propagation paths. Different parts of a complete seismic wavetrain have different sensitivities to the propagation path. The initial part retains general characteristics of the source time function. The shape of later seismic phases is chiefly defined by propagation path. Here, we investigate the level of similarity between hundreds of signals generated by chemical blasts within a phosphate mine in Jordan and measured by 5 seismic stations at near-regional distances. We have revealed a much higher similarity of the first 3 s to 5 s of signals from different blasts, at distances of about 20 km, at the same station as well as at different stations. This observation favours high coherency in the initial part of signals at all stations. We also demonstrate that the observed coherency allows the use of very short (say, 3 s) waveform templates for detection and further phase association of signals based on cross correlation. Longer templates are characterized by larger overall signal specificity, which may reduce the detection threshold and spatial resolution of the WCC method. However, different propagation paths within the same geological province may have similar transfer functions producing regular seismic phases with similar shapes independent of source position. This may increase the number of false detections from remote sources. We compare the performance of short and long waveform templates using detection statistics and the results of event hypotheses creation and further event location. WAVEFORM CROSS CORRELATION DEPENDING ON TEMPLATE POSITION WAVEFORM CROSS CORRELATION DEPENDING ON TEMPLATE LENGTH EFFICIENCY OF TEMPLATE PERFORMANCE IN EVENT BUILDING The phosphate mine Eshidiya, 70 km away from Ma'an District and 330 km from Amman, has been extracting fossils using chemical blasts since 1989. It has two sites with the largest possible distance between events of approximately 20 km, a challenge for detection using waveform cross correlation A few thousand blasts were conducted within the quarry. For the study of waveform cross correlation, we have selected 1654 events (blue circles) with records at station HRFI. There are other stations measuring most of these events: PRNI, EIL, ASF, MMAI. 3-C templates (E – east-west, N – north-south, and Z - vertical) as measured by EIL from a blast conducted within the quarry. Each waveform has been filtered in six frequency bands (four are shown): F1: 1-3 Hz, F2: 2-4 Hz, F3: 3-6 Hz, F4: 4-8 Hz, F5: 6-12 Hz, and F : 8-16 Hz in order to obtain the highest signal-to-noise ratio in cross correlation. All templates include 5-second-long pre-signal segments. Notice the change in frequency content in P and Lg phases. BLASTS AT ESHIDIYA MINE Waveform cross correlation: coherency of seismic signals estimated from repeated mining blasts Yochai Ben Horin, Soreq Nuclear Research Centre, Israel, Ivan Kitov, PTS CTBTO, Mikhail Rozhkov, PTS CTBTO, Matthew Yedlin, Department of Electrical and Computer Engineering, University of British Columbia Hourly distribution of built events within a day. Three versions of template Length are shown: 3 s, 5 s, and “LONG” corresponding to the highest CC-detector sensitivity. The number of potentially false events out of working hours increases with the template length. Distribution of the built events over the number of associated stations depending on the length of templates. The longest template created more 3-station events and the 3-s templates create more 5-station events Distribution of the built events over the number of associated stations depending on the length of templates. NEW are the events built by cross correlation in addition to the external Catalogue. We randomly select 2000 waveform/template pairs from ~1500 signals measured by EIL from blasts within the same mine and gradually increase the length of template from 1s to 22 s. The length with the highest SNR for a given pair is taken as the detection length and counted in corresponding 1 s bin. The distribution of the number of detections over these beams allows selection of the most efficient length – 18 s for EIL. Second run with different random pairs shows that the result does not change and 2000 is a representative number. Same as above for station ASF. The most efficient length is 36 s with 2 s the second most efficient. The distribution of the number of detections over template length for station PRNI. The most efficient length is 1 s with 17 s the second most efficient. Distribution of SNRCC for station PRNI over the length of waveform template. On average, SNRCC are smaller for shorter templates and larger for the lengths between 15 and 20 s. The latter is the effect of more effective noise suppression. ASF EIL HRFI MMAI PRNI DATA DAYS NSTA>2 364 385 399 391 203 402 Nsta # 3 44 4 204 5 154 3-C templates (E – east-west, N – north-south, and Z - vertical) as measured by ASF from a blast conducted within the quarry. The ASF waveforms are different from those at EIL due to larger distance to the quarry Data availability by station for 415 days with reviewed catalogue. Only 402 days have data from 3 or more stations available for cross correlation. No events can be found during the days when less than 3 stations are available. Data availability the number of stations. 402 days in total. Frequency distribution of the number of detections at station EIL as a function of the position of template in the signal. The length of template is defined by letter S (3-5-7). The frequency band is defined by letter F (1-5). For example, start point 3 s for S7 means the portion of template between 3 s and 10 s is used for cross correlation. Performance of three detection lengths at stations EIL, HRFI, and PRNI for one filter – F3. For the length of 3 s (S3) al stations have peak detection rates with 0 start time, i.e. the start of waveform template. This effect is most prominent at HRFI. For station ASF situated at larger distance the performance of the first portion of the signal is less effective due to lower coherency in the first phases and development of a likely more coherent Lg phase, which becomes more structure dependent with range The probability distribution function of SNRCC values at five stations obtained for 1 year period with the length of waveform template of 3 s. Total number of individual estimates is 365days x 24hours x 3600s x sampling rate. All stations demonstrate very close distributions with EIL having the largest number of detection and MMAI the lowest. PRNI is worse than remote ASF. Same as in above figure for the length of template corresponding to the highest detection efficiency: 18 s for EIL, HRFI and PRNI; 36 s for ASF. ASF has largest number of detections with higher SNRCC.. For MMAI, the length of template is 6 s. This length is called “LONG”. We selected 22 events with templates at all 5 stations and cross correlated them through the whole period covered by the external bulletin. Three versions of template length were used: 3 s, 5 s, and “LONG”. The upper panel shows the number of events built by each master. In the middle, we show the number of events left for a given master after conflict resolution. This bulletin is called XSEL_CR and the bottom panel shows the number of events from the bulletin found by each master. Five masters are most prolific. Input of 5 stations to the final cross correlation bulletin XSEL_CR. “LONG” creates more events than 3 s and 5 s templates. PRNI gives lower number of arrivals than ASF and MMAI likely because of the worst data availability. Conclusion: The 3-s waveform templates are the most efficient in finding of similar events with the largest number of associated stations and guarantee a lower rate of false event hypotheses The first few seconds demonstrate the highest coherency of signals The detection efficiency of waveform templates critically depends on their lengths