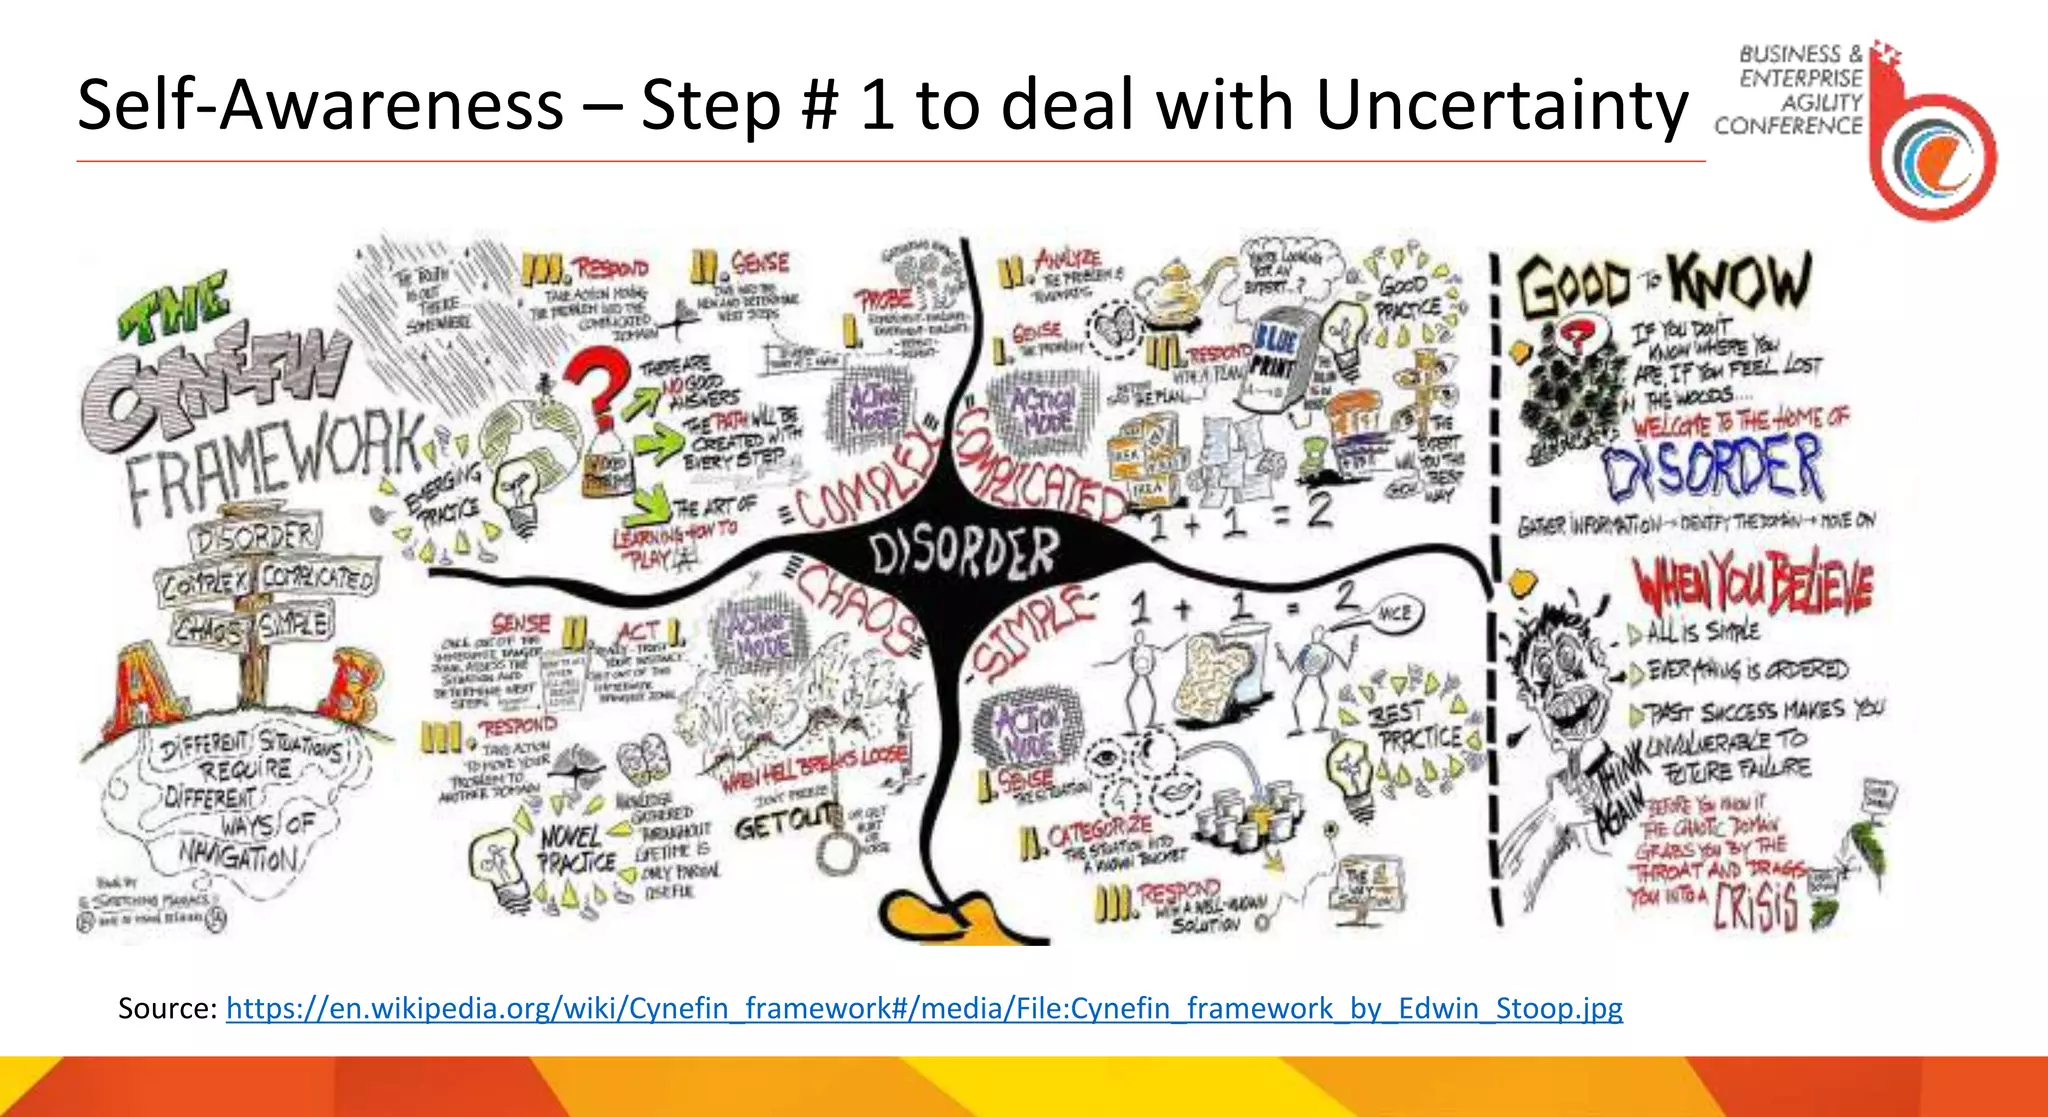
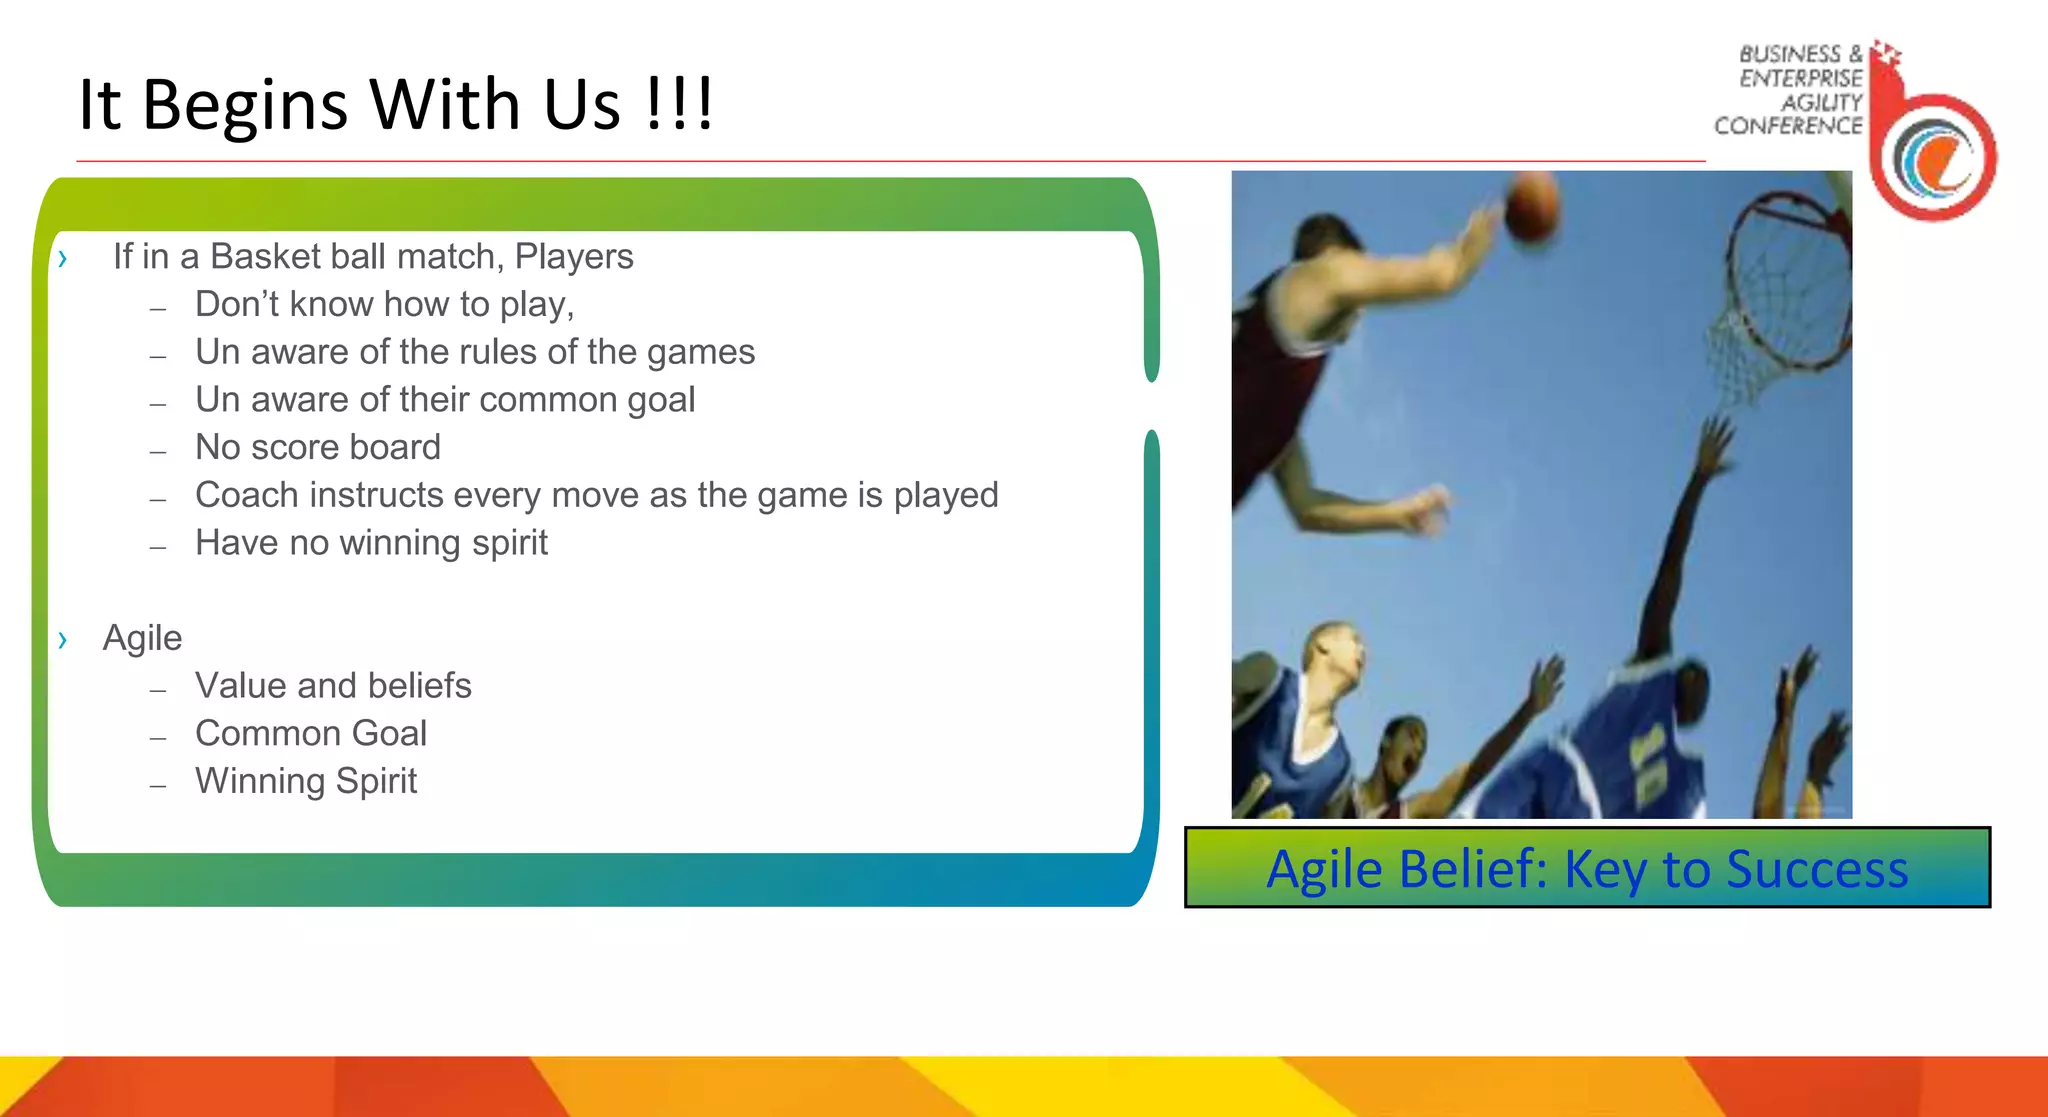
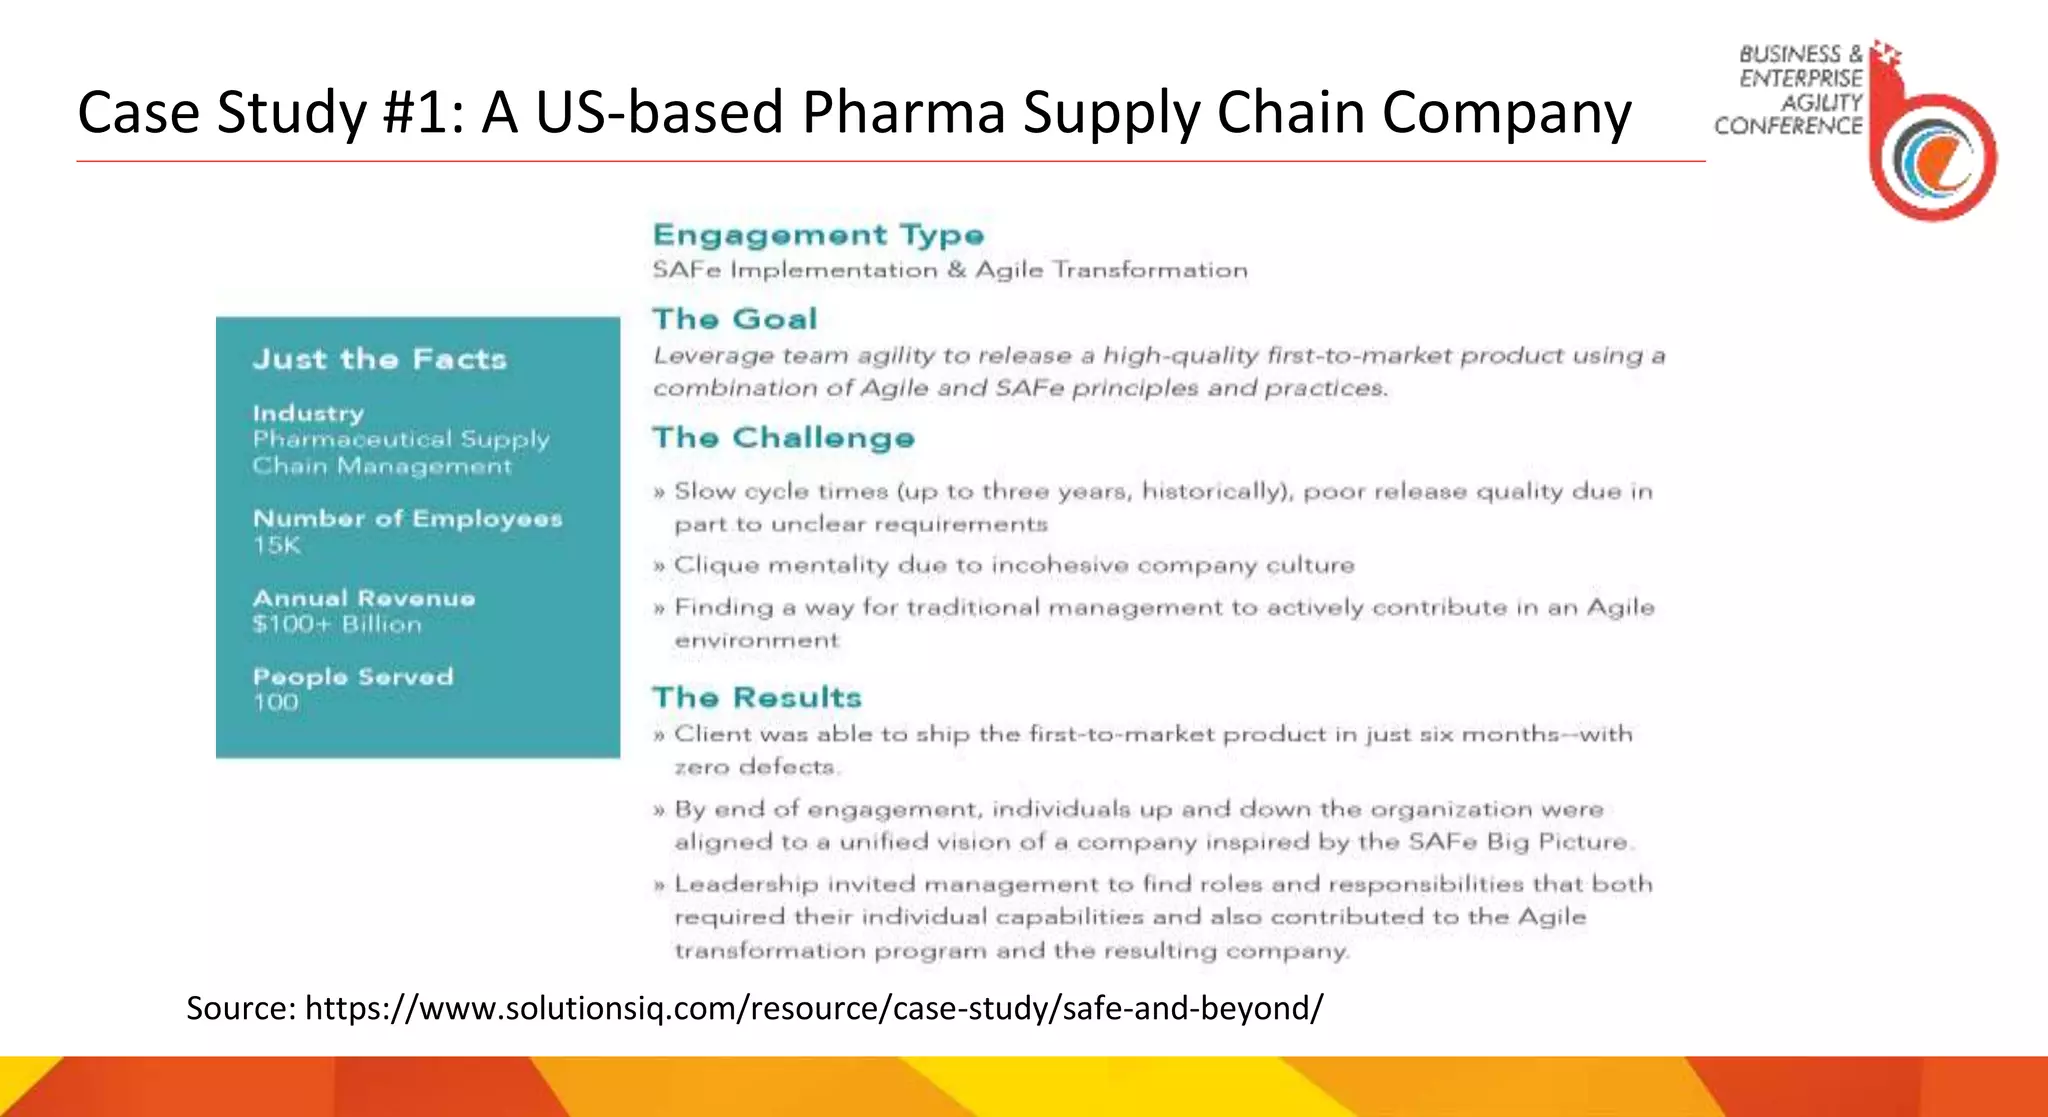
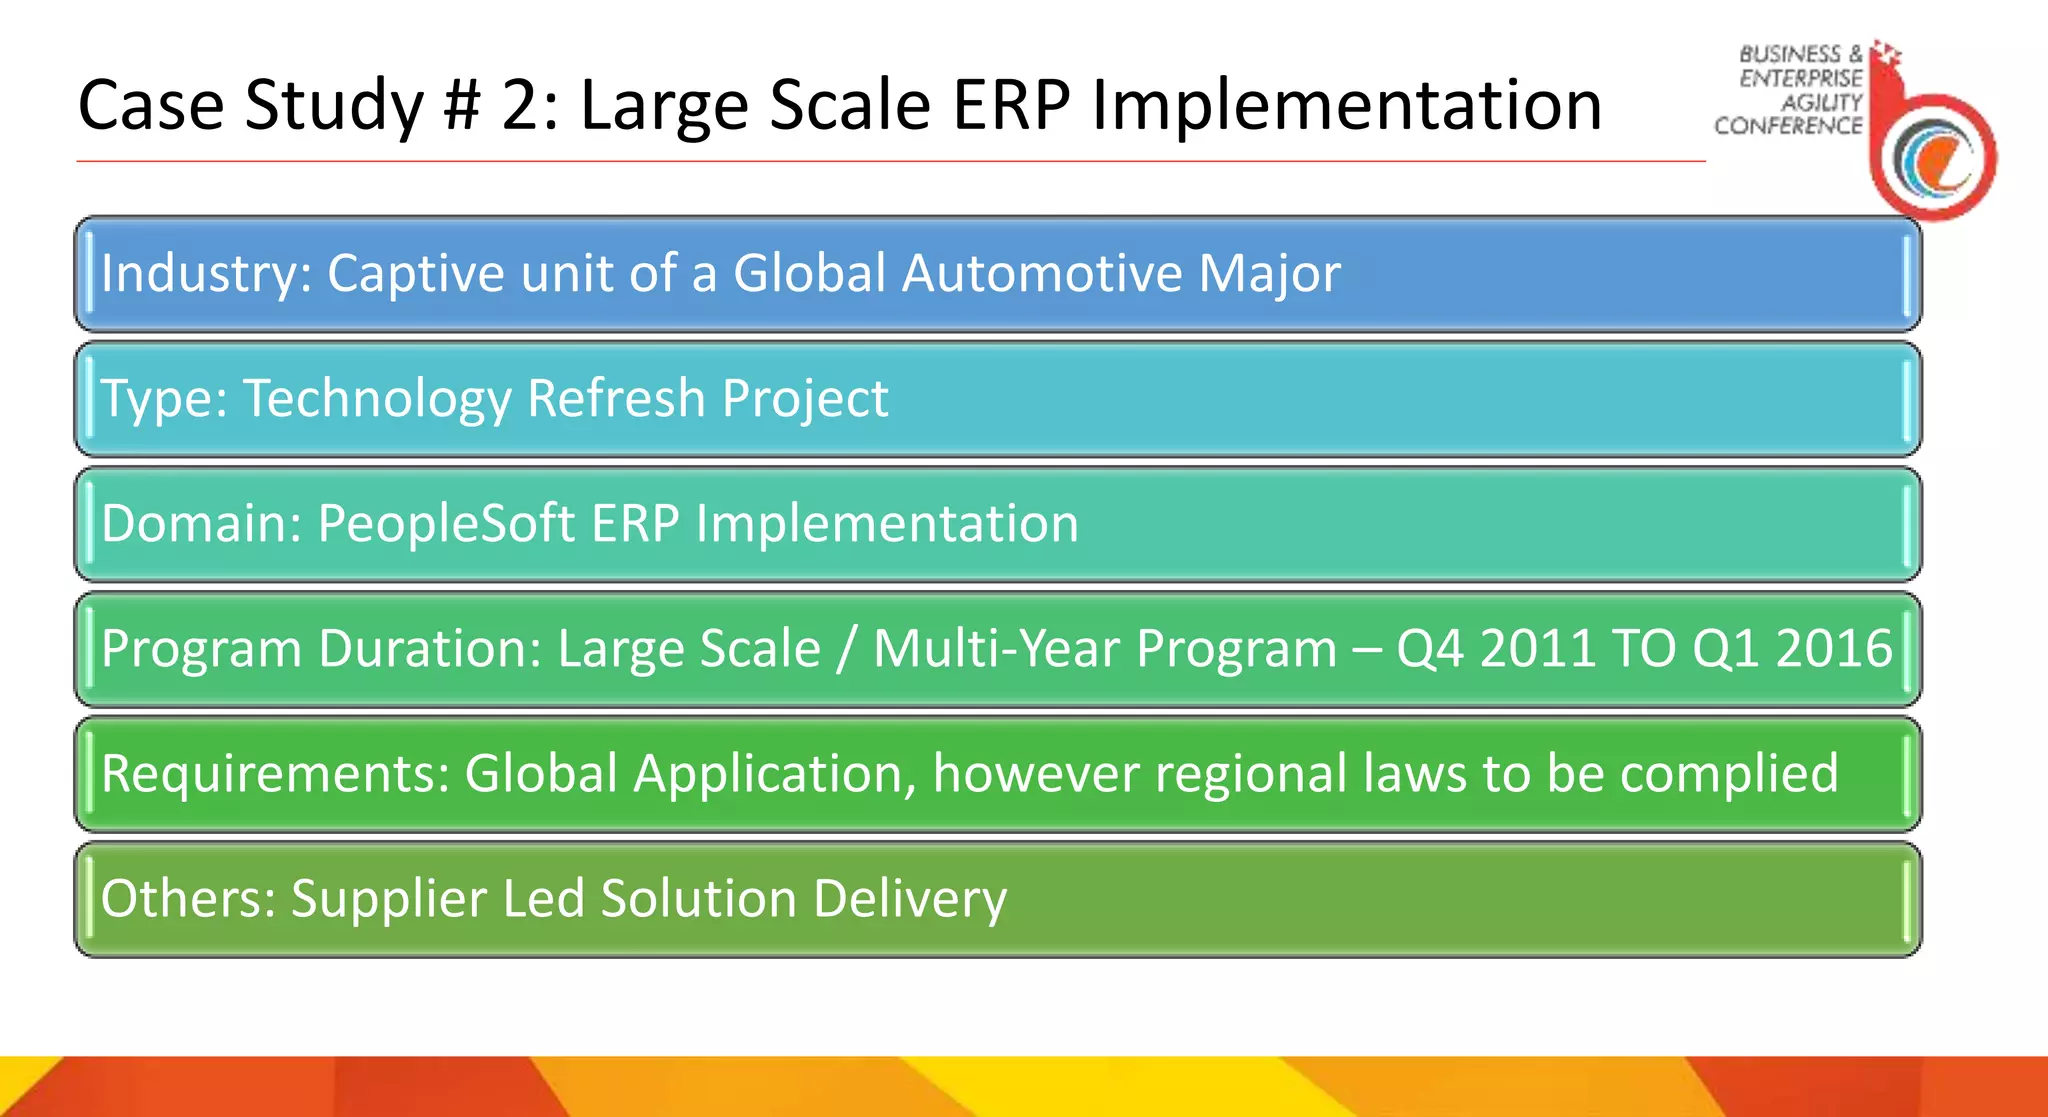
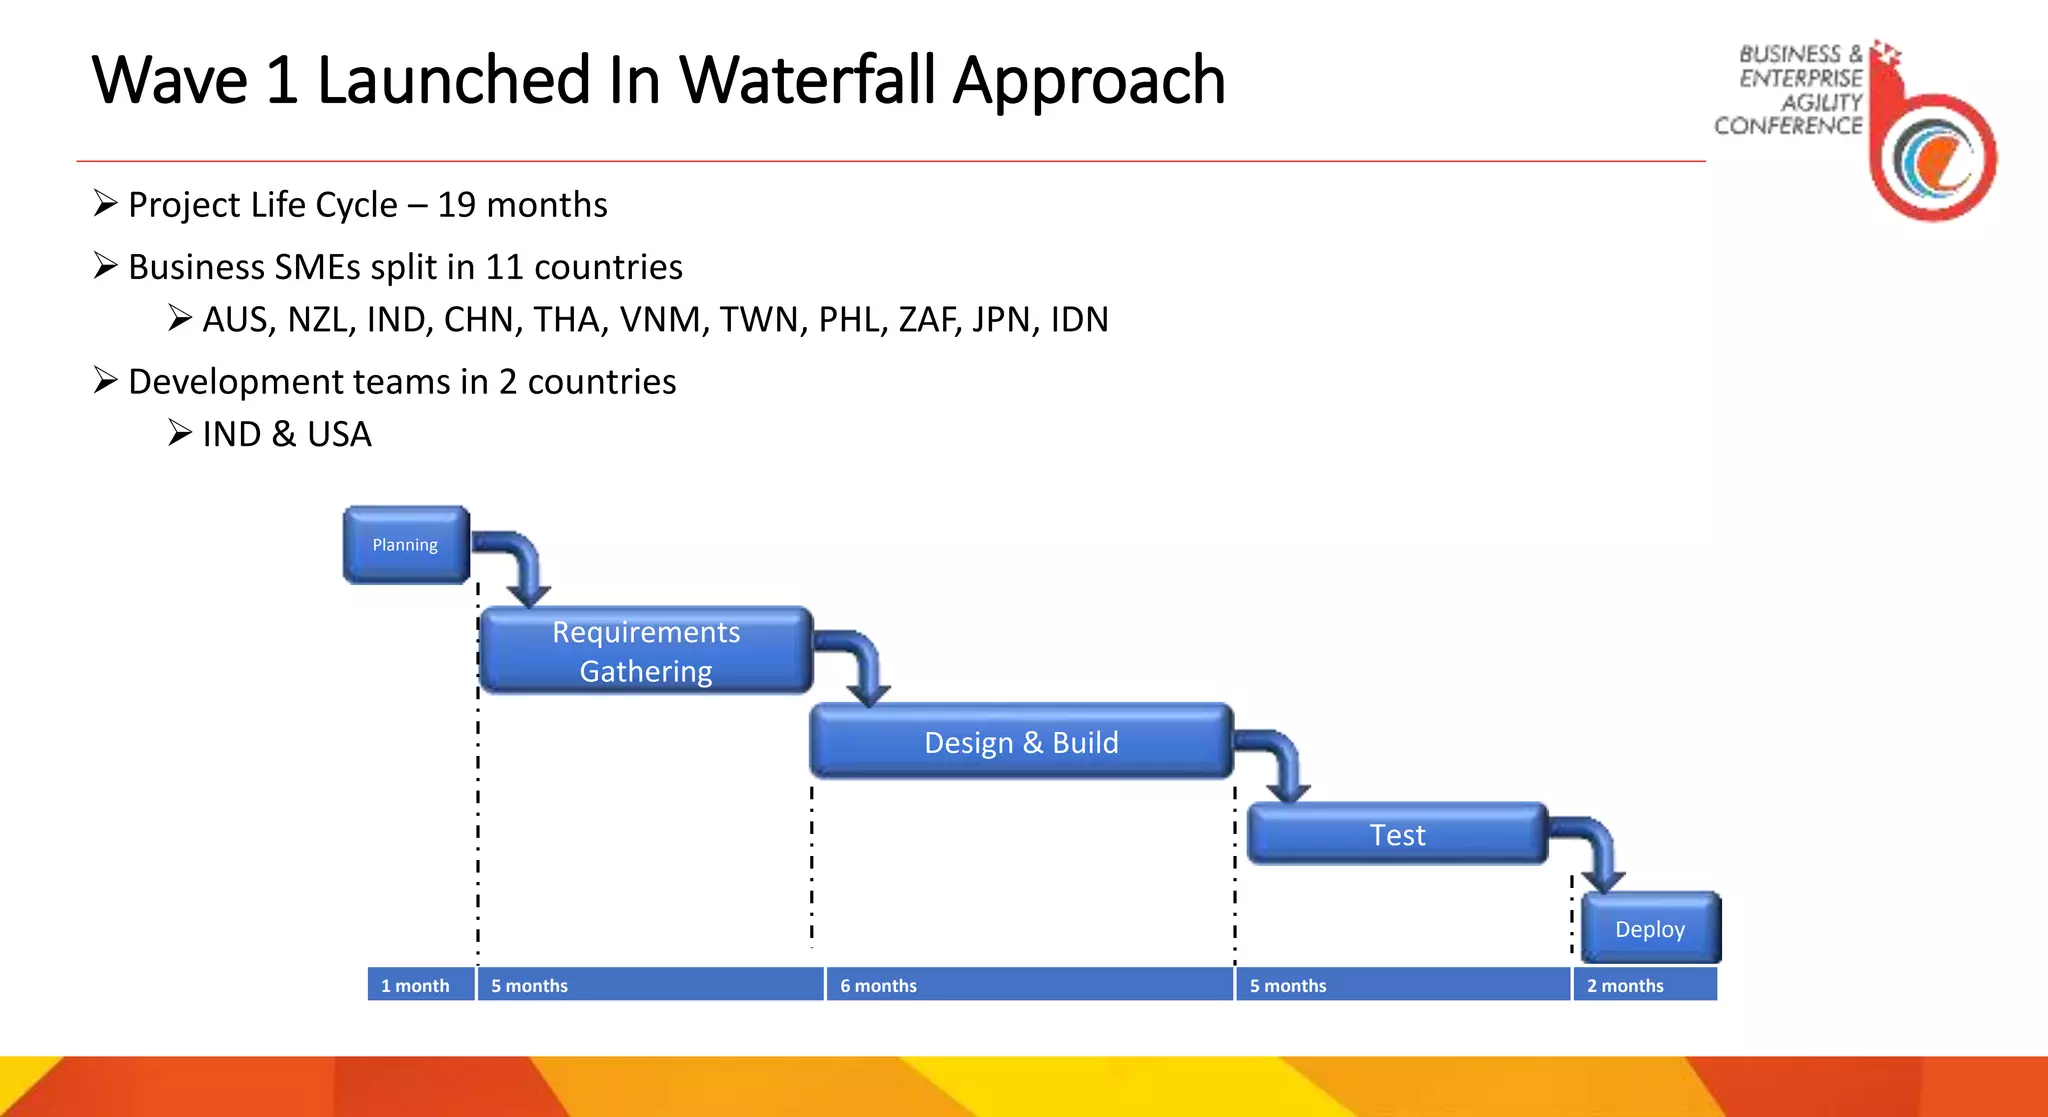
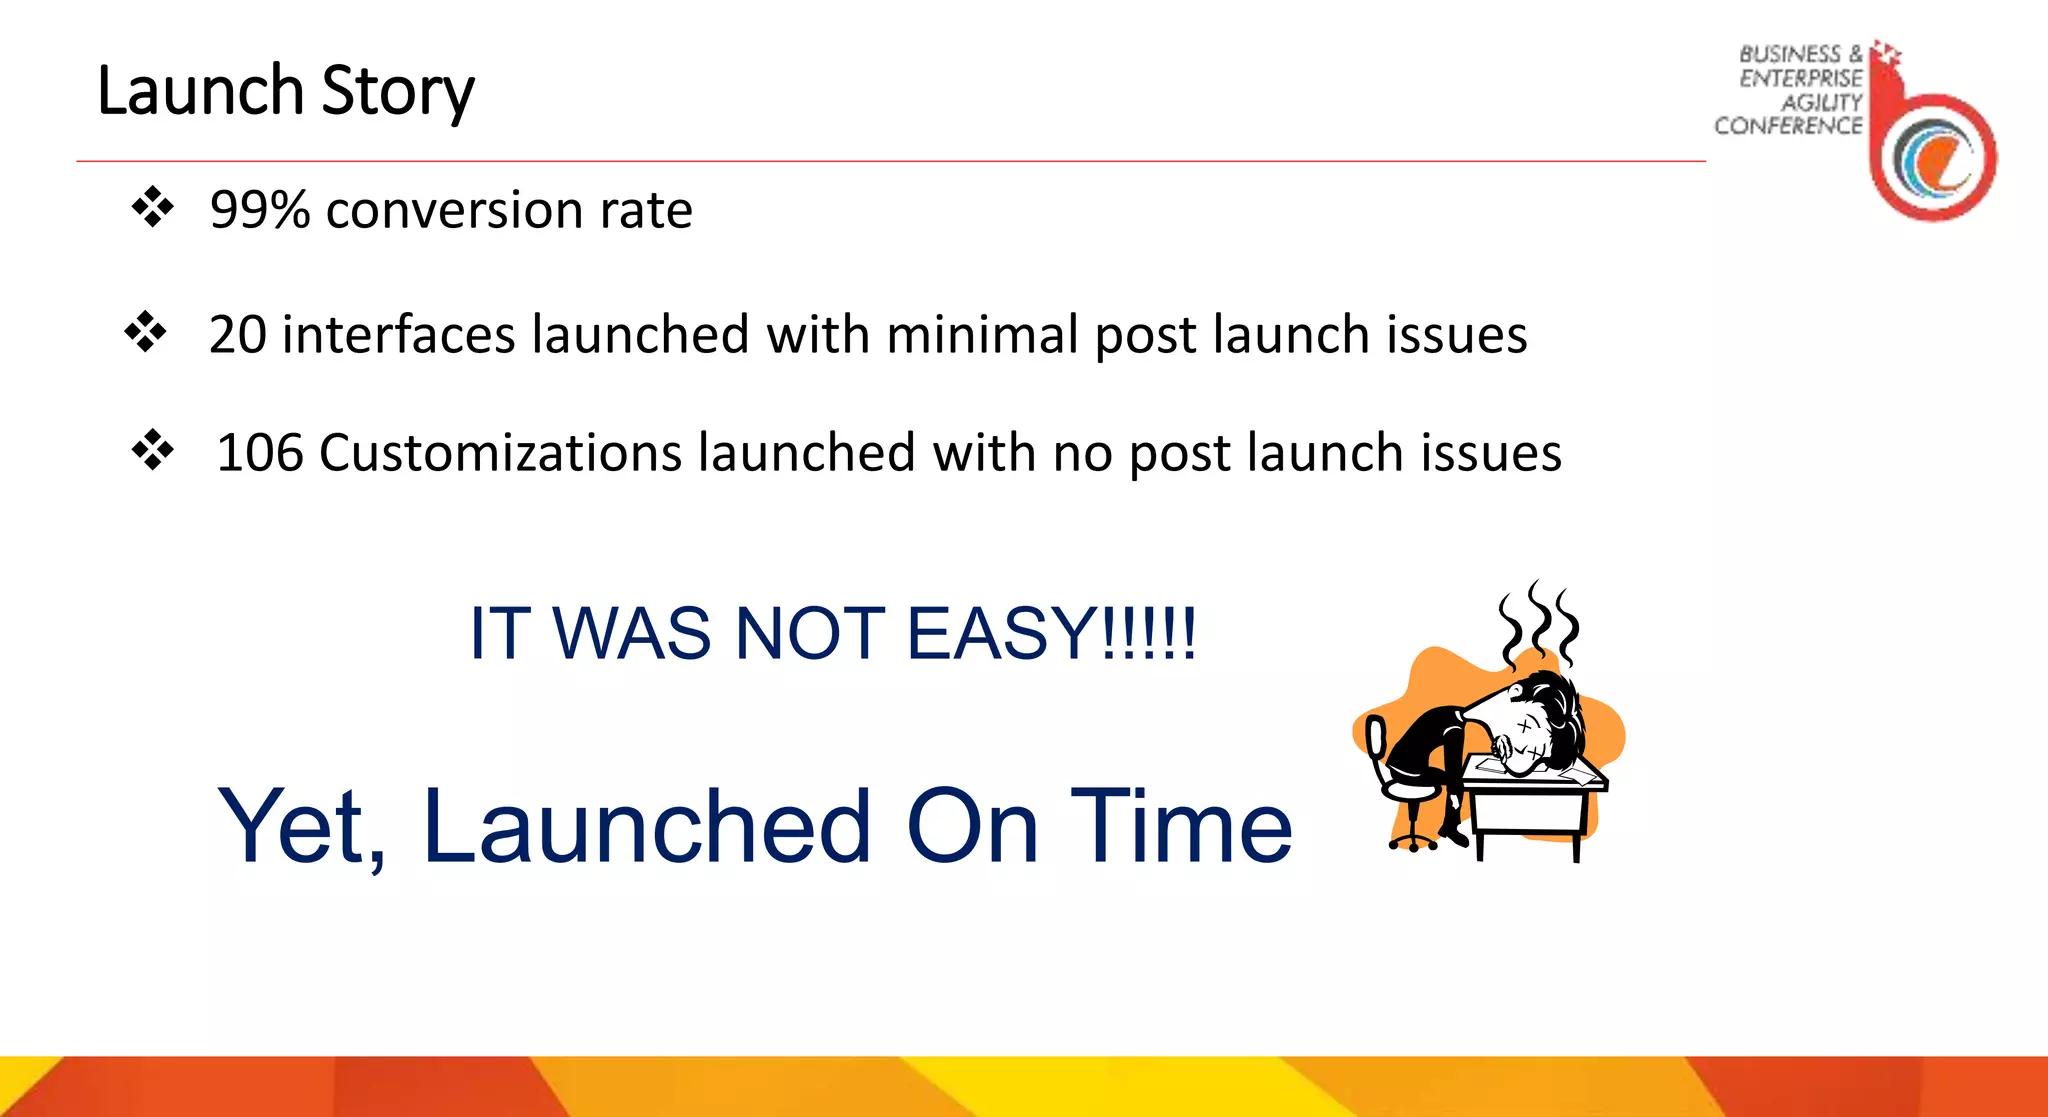
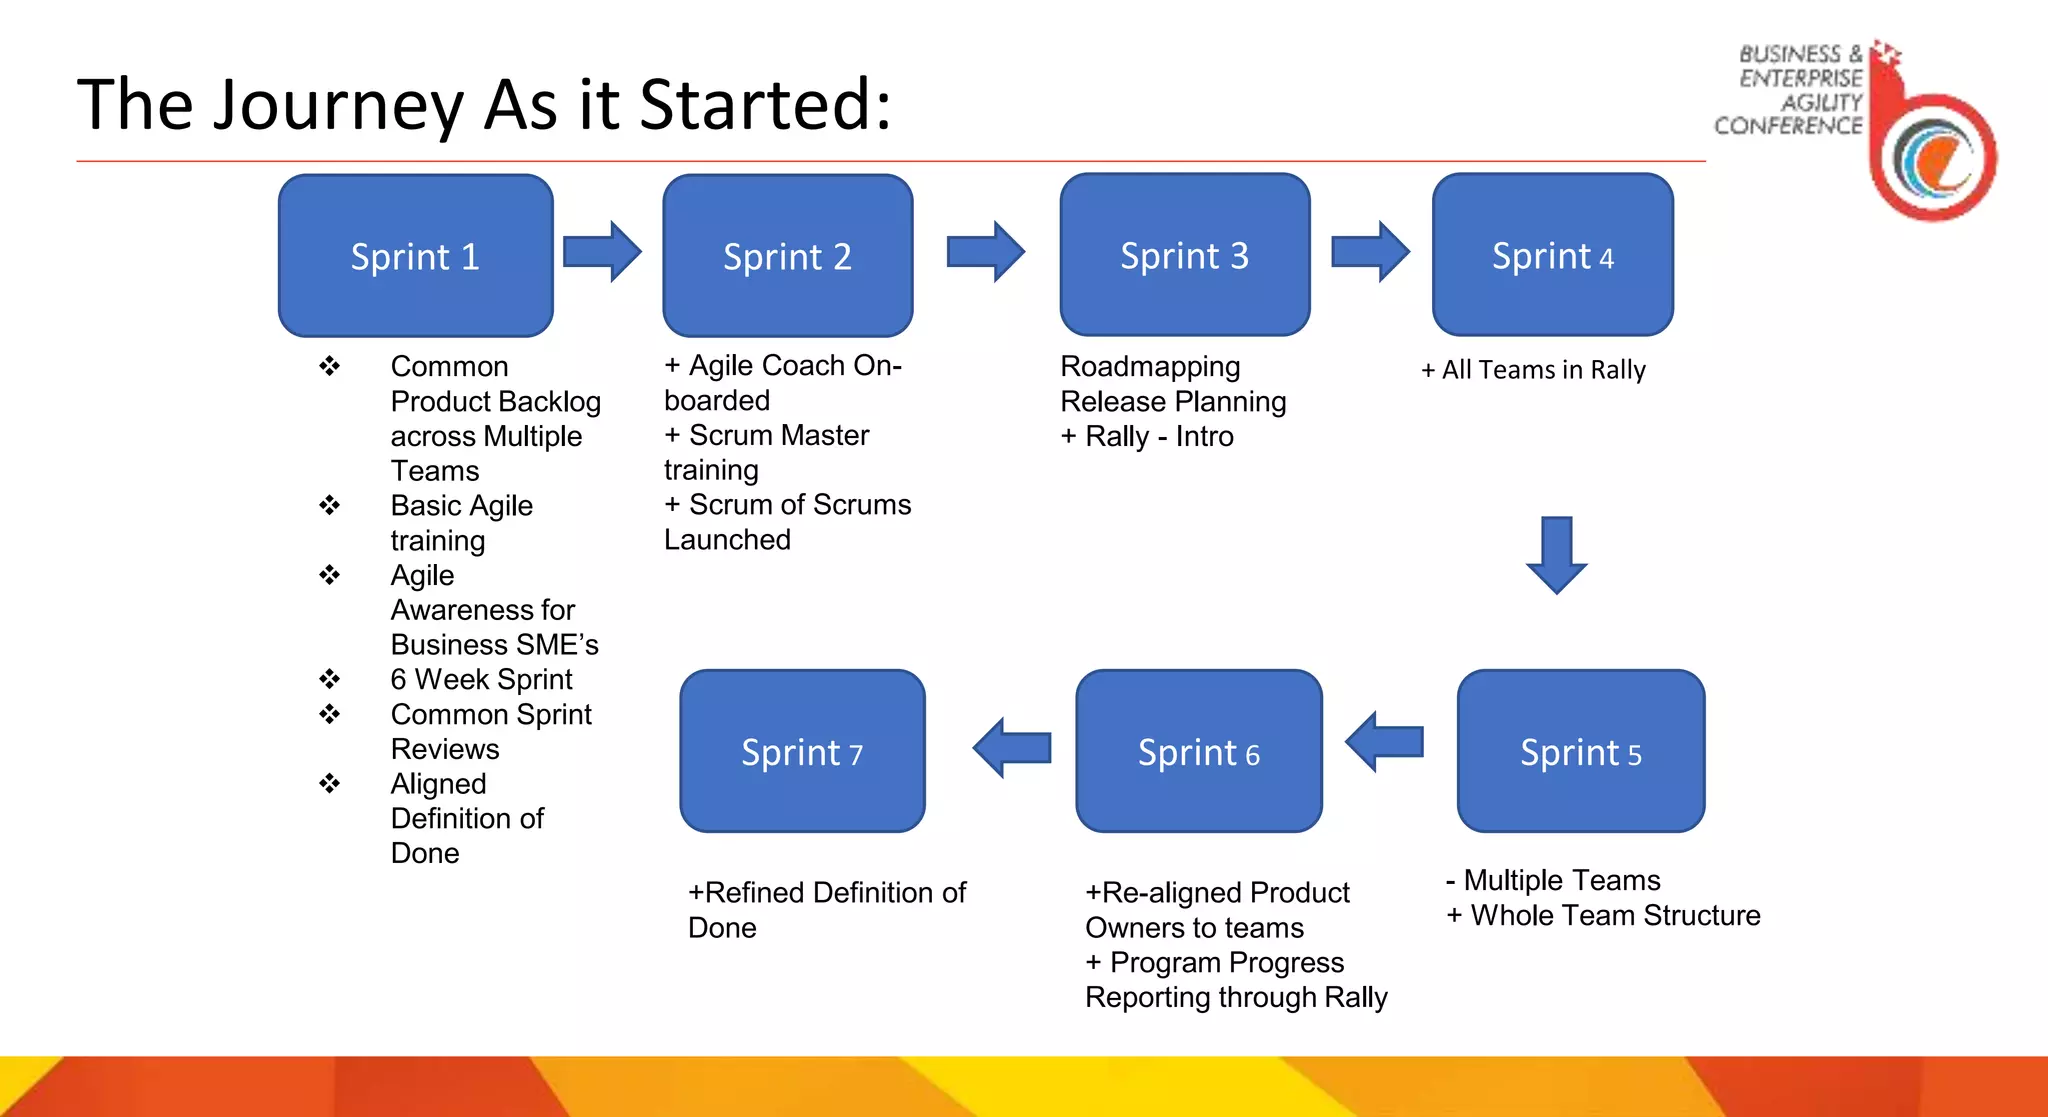
Traditionally, businesses like banking and telecom focused high on standardization and national regulation. The development lead times were long. Consequently, the solution providers developed capabilities to influence standards, develop products and interact with the end-service providers. The changing business landscape challenges providers to keep pace. In the slow-moving market, providers honed the ability to run major multi—year projects. Solution Providers became predictable development machinery with extensive mechanisms to enable predictability and control at the expense of flexibility and customer closeness. This led to organizational setups focusing on the alignment with the project structures and deepening the competencies in narrow areas both in the product and in the functional dimensions. The result? Organizational silos with multiple related hand-over challenges.
My talk will cover solutions to these challenges when multiple teams come together to deliver a solution.
Measuring True Process Yield using Robust Yield Metrics
“How We Learnt to Stop Worrying and Live with Uncertainty” – Case Studies from Large Scale Agile Program Management
1. HOW WE LEARNT TO STOP WORRYING
AND LIVE WITH UNCERTAINTY
CASE STUDIES FROM LARGE SCALE
AGILE PROGRAMS
Mahesh Varadharajan
1st – 3rd December, 2017 | Westin, Hyderabad, INDIA
2. Self-Awareness – Step # 1 to deal with Uncertainty
Source: https://en.wikipedia.org/wiki/Cynefin_framework#/media/File:Cynefin_framework_by_Edwin_Stoop.jpg
3. It Begins With Us !!!
› If in a Basket ball match, Players
– Don’t know how to play,
– Un aware of the rules of the games
– Un aware of their common goal
– No score board
– Coach instructs every move as the game is played
– Have no winning spirit
› Agile
– Value and beliefs
– Common Goal
– Winning Spirit
Agile Belief: Key to Success
4. Case Study #1: A US-based Pharma Supply Chain Company
Source: https://www.solutionsiq.com/resource/case-study/safe-and-beyond/
5. How did we Achieve: The LOPDE Approach
Leadership
Organization
Product / Business Strategy
Delivery
Execution
Organization
Coaching
Team
Coaching
6. Case Study # 2: Large Scale ERP Implementation
Industry: Captive unit of a Global Automotive Major
Type: Technology Refresh Project
Domain: PeopleSoft ERP Implementation
Program Duration: Large Scale / Multi-Year Program – Q4 2011 TO Q1 2016
Requirements: Global Application, however regional laws to be complied
Others: Supplier Led Solution Delivery
7. Wave 1 Launched In Waterfall Approach
Project Life Cycle – 19 months
Business SMEs split in 11 countries
AUS, NZL, IND, CHN, THA, VNM, TWN, PHL, ZAF, JPN, IDN
Development teams in 2 countries
IND & USA
Planning
Deploy
Requirements
Gathering
Design & Build
1 month 5 months 6 months 5 months 2 months
Test
8. Launch Story
99% conversion rate
Yet, Launched On Time
20 interfaces launched with minimal post launch issues
106 Customizations launched with no post launch issues
IT WAS NOT EASY!!!!!
9. 9
Inaccurate estimations
Sequential development
phases
Impact
Delayed start of each subsequent phase
Changes to requirements were
difficult to contain
High volume of CR’s - User
engagement towards the end
All Stakeholders required for
decision making
Capacity utilization at peak
Impact
Impact
Impact
Delayed decisions with
cascading effect
Meetings at odd times
Impact
Long Working Hours
10. Project Life Cycle – 19 months
Business SMEs split in 9 countries
USA, CAN, MEX, CHL, ARG, VEN, BRA, PER, COL
Development teams in 3 countries
IND, MEX, USA
Overlap with Wave 3 - significantly limiting SME availability
20
70
Number of
Interfaces
Wave 1
Wave 2
106
200
Number of
Customizations
Wave 1
Wave 2
37
200
Records to be
Converted…
Wave 1
Wave 2
1919
Time (in months)
Wave 1
Wave 2
Scope Comparison
Significant increase in the number of Interfaces,
Customizations and Population.
Higher Complexity.
No Change in the Delivery time.
Shift to Agile in Wave-2 Launch
11. Deliver on time
Effective distribution of SME time
Increase team productivity
Maintain cross functional alignment
Project
Preparation
Blueprint Realization
Determined
Project Scope
Product Backlog
Creation
Sprint Backlog
Creation
Cut Over Go Live
4 Week
Cycle
Integration Testing Phase 1
Integration Testing Phase 2
Integration Testing Phase 3
15 Sprints
The Initial Agile Approach Planned (Before Coaching):
Drivers for the Shift in Approach:
12. 12
Mind-set shift
Teams split across regions
Team ramp-up – For changed approach
Business Buy-in Development to
start at Day 1
Complex Interfaces
Challenges Faced During the Transition
13. Sprint 1
Common
Product Backlog
across Multiple
Teams
Basic Agile
training
Agile
Awareness for
Business SME’s
6 Week Sprint
Common Sprint
Reviews
Aligned
Definition of
Done
Sprint 2 Sprint 3 Sprint 4
Sprint 5Sprint 6Sprint 7
+ Agile Coach On-
boarded
+ Scrum Master
training
+ Scrum of Scrums
Launched
Roadmapping
Release Planning
+ Rally - Intro
+ All Teams in Rally
+Re-aligned Product
Owners to teams
+ Program Progress
Reporting through Rally
- Multiple Teams
+ Whole Team Structure
+Refined Definition of
Done
The Journey As it Started:
15. 15
Product
Backlog
Common Sprint
Closure
Iteration 1 Iteration 2 Iteration 3 Iteration 4 Iteration 5 Iteration 6 Iteration 7
Deliverable 1 Deliverable 2 Deliverable 3 Deliverable 4 Deliverable 5 Deliverable 6 Deliverable 7
Iteration wise breakdown of deliverables
Agile Team 1
Agile Team 2
Agile Team 3
Advantages -
Sample -
Forecasted Roadmap Across
Teams
Prioritization of Backlog Items
Management of interdependencies
Advantages -
Common Sprint Reviews across Teams
Common Product Backlog and Release Planning resulted in Forecasted Backlog for a quarter
Agenda -
Sprint Reviews Roadblocks Risks
Rewards &
Recognition
Next Sprint’s
Plan
Sprint Metrics –
Velocity, Defects etc.
Improved Progress Visualization More transparency
Drives performance
Scaling Practices Adopted to Manage Complexity
16. 16
Build
Run
Valid
ate
Clea
n-up
Rule
s for
Build
Impact
Small Conversion Cycles – 4
weeks
Early availability of converted data
Improved Performance
Risks identified upfront
Better Quality
Positive Linear Growth in the Conversion
Rate
Few Emergent Practices in Data Conversion:
• Learnt from error(s)
• Learnt by running conversions
• Overall Defects minimized
17. Week
1
Week
2
Week
3
Week
4
Week
5
Week
6
Week
7
Week
8
Week
9
Week
10
Week
11
Week
12
Week
13
Week
14
Week
15
Week
16
Requirements Design Build Test Deploy
Week 1 Week 2 Week 3 Week 4 Week 5 Week 6 Week 7 Week 8 Week 9
Week
10
Week
11
Week
12
Agile Attributes:
• 100 Points
• 3 Features
• 600 hours
Business Process – Set 1
Extract
Transform
Load
Business Process –Set 2
Extract
Transform
Load
Business Process –Set 3
Extract
Transform
Load
1
2
Dependency:
Needs Customizations
Needs Configurations
Needs Converted Data
Agile approach
Waterfall approach
Extract
for all Business
Processes
Transform
for all Business
Processes
Load
for all Business
Processes
Complexity in Data Conversion: Waterfall Vs Iterative
18. Want to Get Smarter EveryDay?
Stop Worrying and Learn to Embrace Uncertainty
• Focus on Continuous Learning
• Be the Change You Wish to See – Mahatma Gandhi
19. Disclaimer
This Talk Proposal has been submitted for participation purposes only and is not
intended to serve as advice of any nature whatsoever. This Talk Proposal also
contains certain information available in public domain, created and maintained
by private and public organizations.. The Talk Proposal is the property of
Accenture and its affiliates and Accenture be the holder of the copyright or any
intellectual property over the news release . No part of this document may be
reproduced in any manner without the written permission of Accenture. Opinions
expressed herein are subject to change without notice.