Buy Britannia Industries for a target of Rs1110 - Prabhudas Lilladher
•
0 likes•221 views

BRIT plans to undertake 1) faster and bigger innovations 2) aggressive cost reduction 3) distribution expansion and 4) provision of delightful and affordable consumer experience Maintain ‘BUY’ with a target of Rs1,110

Recommended
Recommended
More Related Content
What's hot
What's hot (20)
Viewers also liked
Similar to Buy Britannia Industries for a target of Rs1110 - Prabhudas Lilladher
Similar to Buy Britannia Industries for a target of Rs1110 - Prabhudas Lilladher (20)
More from IndiaNotes.com
More from IndiaNotes.com (20)
Recently uploaded
Recently uploaded (20)
Buy Britannia Industries for a target of Rs1110 - Prabhudas Lilladher
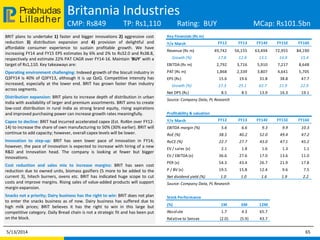
- 1. Lilladher Prabhudas Britannia Industries CMP: Rs849 TP: Rs1,110 Rating: BUY MCap: Rs101.5bn BRIT plans to undertake 1) faster and bigger innovations 2) aggressive cost reduction 3) distribution expansion and 4) provision of delightful and affordable consumer experience to sustain profitable growth. We have increasing FY14 and FY15 EPS estimates by 6% and 2% to Rs32.0 and Rs38.8, respectively and estimate 22% PAT CAGR over FY14‐16. Maintain ‘BUY’ with a target of Rs1,110. Key takeaways are: Operating environment challenging: Indexed growth of the biscuit industry in Q3FY14 is 40% of Q3FY13, although it is up QoQ. Competitive intensity has increased, especially at the lower end. BRIT has grown faster than industry across segments. Distribution expansion: BRIT plans to increase depth of distribution in urban India with availability of larger and premium assortments. BRIT aims to create low-cost distribution in rural India as strong brand equity, rising aspirations and improved purchasing power can increase growth rates meaningfully. Capex to decline: BRIT had incurred accelerated capex (Est. Rs4bn over FY12- 14) to increase the share of own manufacturing to 50% (30% earlier). BRIT will continue to add capacity; however, overall capex levels will be lower. Innovation to step‐up: BRIT has seen lower pace of innovation in FY14; however, the pace of innovation is expected to increase with hiring of a new R&D and Innovation head. The company is looking at fewer but bigger innovations. Cost reduction and sales mix to increase margins: BRIT has seen cost reduction due to owned units, biomass gasifiers (5 more to be added to the current 3), hitech burners, ovens etc. BRIT has indicated huge scope to cut costs and improve margins. Rising sales of value-added products will support margin expansion. Snacks not a priority; Dairy business has the right to win: BRIT does not plan to enter the snacks business as of now. Dairy business has suffered due to high milk prices; BRIT believes it has the right to win in this large but competitive category. Daily Bread chain is not a strategic fit and has been put on the block. 5/13/2014 65 Key Financials (Rs m) Y/e March FY12 FY13 FY14E FY15E FY16E Revenue (Rs m) 49,742 56,155 63,494 72,955 84,190 Growth (%) 17.8 12.9 13.1 14.9 15.4 EBITDA (Rs m) 2,792 3,716 5,910 7,217 8,648 PAT (Rs m) 1,868 2,339 3,807 4,641 5,705 EPS (Rs) 15.6 19.6 31.8 38.8 47.7 Growth (%) 27.3 25.1 62.7 21.9 22.9 Net DPS (Rs) 8.5 8.5 13.9 16.3 19.1 Source: Company Data, PL Research Profitability & valuation Y/e March FY12 FY13 FY14E FY15E FY16E EBITDA margin (%) 5.6 6.6 9.3 9.9 10.3 RoE (%) 38.5 40.2 52.0 49.4 47.2 RoCE (%) 22.7 27.7 43.0 47.1 45.2 EV / sales (x) 2.1 1.8 1.6 1.3 1.1 EV / EBITDA (x) 36.6 27.6 17.0 13.6 11.0 PER (x) 54.3 43.4 26.7 21.9 17.8 P / BV (x) 19.5 15.8 12.4 9.6 7.5 Net dividend yield (%) 1.0 1.0 1.6 1.9 2.2 Source: Company Data, PL Research Stock Performance (%) 1M 6M 12M Absolute 1.7 4.3 65.7 Relative to Sensex (2.0) (5.9) 43.7
- 2. Lilladher Prabhudas Financials Britannia Industries 5/13/2014 66 Income Statement (Rs m) Y/e March FY12 FY13 FY14E FY15E FY16E Net Revenue 49,742 56,155 63,494 72,955 84,190 Direct Expenses 36,680 41,015 44,526 50,620 58,049 % of Net Sales 73.7 73.0 70.1 69.4 68.9 Employee Cost 1,459 1,435 1,762 1,989 2,296 % of Net Sales 2.9 2.6 2.8 2.7 2.7 SG&A Expenses 5,376 6,375 7,331 8,572 10,020 % of Net Sales 10.8 11.4 11.5 11.7 11.9 Other Expenses 3,435 3,614 3,965 4,557 5,177 % of Net Sales 6.9 6.4 6.2 6.2 6.1 EBITDA 2,792 3,716 5,910 7,217 8,648 Margin (%) 5.6 6.6 9.3 9.9 10.3 Depreciation 473 571 653 791 866 PBIT 2,319 3,145 5,257 6,426 7,782 Interest Expenses 381 377 58 96 68 PBT 2,524 3,322 5,477 6,678 8,268 Total tax 656 983 1,671 2,037 2,563 Effective Tax rate (%) 26.0 29.6 30.5 30.5 31.0 PAT 1,868 2,339 3,807 4,640 5,705 Extraordinary Gain/(Loss) - - - (1) - Adjusted PAT 1,868 2,339 3,807 4,641 5,705 Source: Company Data, PL Research Balance Sheet (Rs m) Y/e March FY12 FY13 FY14E FY15E FY16E Share Capital 239 239 239 239 239 Reserves & Surplus 4,962 6,196 7,980 10,339 13,375 Shareholder's Fund 5,201 6,435 8,219 10,579 13,614 Preference Share Capital - - - - - Total Debt 4,345 2,764 452 750 500 Other Liabilities(net) - - - - - Deferred Tax Liability - - - - - Total Liabilities 9,546 9,199 8,671 11,329 14,114 Gross Block 6,774 7,842 10,042 11,042 12,042 Less: Depreciation 2,983 3,325 3,978 4,769 5,635 Net Block 3,791 4,517 6,064 6,273 6,408 Capital Work in Progress 797 1,284 150 175 200 Cash & Cash Equivalent 5,199 3,441 3,668 6,175 8,867 Total Current Assets 10,396 9,133 9,956 13,658 17,772 Total Current Liabilities 7,096 7,495 9,341 10,720 12,332 Net Current Assets 3,299 1,638 615 2,938 5,439 Other Assets (82) (136) (54) 46 170 Total Assets 9,545 9,199 8,671 11,329 14,114 Source: Company Data, PL Research
- 3. Lilladher Prabhudas Disclaimer 5/13/2014 80 BUY : Over 15% Outperformance to Sensex over 12-months Accumulate : Outperformance to Sensex over 12-months Reduce : Underperformance to Sensex over 12-months Sell : Over 15% underperformance to Sensex over 12-months Trading Buy : Over 10% absolute upside in 1-month Trading Sell : Over 10% absolute decline in 1-month Not Rated (NR) : No specific call on the stock Under Review (UR) : Rating likely to change shortly This document has been prepared by the Research Division of Prabhudas Lilladher Pvt. Ltd. Mumbai, India (PL) and is meant for use by the recipient only as information and is not for circulation. This document is not to be reported or copied or made available to others without prior permission of PL. It should not be considered or taken as an offer to sell or a solicitation to buy or sell any security. The information contained in this report has been obtained from sources that are considered to be reliable. However, PL has not independently verified the accuracy or completeness of the same. Neither PL nor any of its affiliates, its directors or its employees accept any responsibility of whatsoever nature for the information, statements and opinion given, made available or expressed herein or for any omission therein. Recipients of this report should be aware that past performance is not necessarily a guide to future performance and value of investments can go down as well. The suitability or otherwise of any investments will depend upon the recipient's particular circumstances and, in case of doubt, advice should be sought from an independent expert/advisor. Either PL or its affiliates or its directors or its employees or its representatives or its clients or their relatives may have position(s), make market, act as principal or engage in transactions of securities of companies referred to in this report and they may have used the research material prior to publication. We may from time to time solicit or perform investment banking or other services for any company mentioned in this document. Prabhudas Lilladher Pvt. Ltd. 3rd Floor, Sadhana House, 570, P. B. Marg, Worli, Mumbai 400 018, India. Tel: (91 22) 6632 2222 Fax: (91 22) 6632 2209 PL’s Recommendation Nomenclature Rating Distribution of Research Coverage 27.2% 51.5% 21.4% 0.0% 0% 10% 20% 30% 40% 50% 60% BUY Accumulate Reduce Sell %ofTotalCoverage