1. * Jefferies India Private Limited
Abhishek Sharma *
Equity Analyst
+91 98196 86016
asharma9@jefferies.com
Dhawal Khut *
Equity Associate
+91 9619388649
dkhut@jefferies.com
Pharmaceuticals
Bullish on Indian Pharma Vendors: Initiating
Coverage of Gland and Laurus
4 January 2022
Key Takeaway
Indian CDMO companies are seeing significant order flow improvement with strong
growth visibility. Several differentiated business models have emerged, and we like
the ones where vendors operate in less competitive spaces and those backed by
proven management. We initiate on Gland Pharma and Laurus Pharma with Buy
ratings — our top picks across the five CRO/CDMO firms we cover.
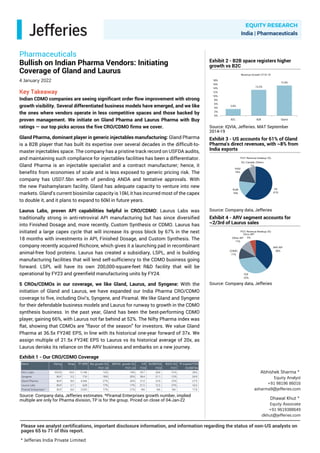
Gland Pharma, dominant player in generic injectables manufacturing: Gland Pharma
is a B2B player that has built its expertise over several decades in the difficult-to-
master injectables space. The company has a pristine track record on USFDA audits,
and maintaining such compliance for injectables facilities has been a differentiator.
Gland Pharma is an injectable specialist and a contract manufacturer; hence, it
benefits from economies of scale and is less exposed to generic pricing risk. The
company has USD7.5bn worth of pending ANDA and tentative approvals. With
the new Pashamylaram facility, Gland has adequate capacity to venture into new
markets. Gland’s current biosimilar capacity is 10kl, it has incurred most of the capex
to double it, and it plans to expand to 60kl in future years.
Laurus Labs, proven API capabilities helpful in CRO/CDMO: Laurus Labs was
traditionally strong in anti-retroviral API manufacturing but has since diversified
into Finished Dosage and, more recently, Custom Synthesis or CDMO. Laurus has
initiated a large capex cycle that will increase its gross block by 67% in the next
18 months with investments in API, Finished Dosage, and Custom Synthesis. The
company recently acquired Richcore, which gives it a launching pad in recombinant
animal-free food proteins. Laurus has created a subsidiary, LSPL, and is building
manufacturing facilities that will lend self-sufficiency to the CDMO business going
forward. LSPL will have its own 200,000-square-feet R&D facility that will be
operational by FY23 and greenfield manufacturing units by FY24.
5 CROs/CDMOs in our coverage, we like Gland, Laurus, and Syngene: With the
initiation of Gland and Laurus, we have expanded our India Pharma CRO/CDMO
coverage to five, including Divi’s, Syngene, and Piramal. We like Gland and Syngene
for their defendable business models and Laurus for runway to growth in the CDMO
synthesis business. In the past year, Gland has been the best-performing CDMO
player, gaining 66%, with Laurus not far behind at 52%. The Nifty Pharma index was
flat, showing that CDMOs are "flavor of the season" for investors. We value Gland
Pharma at 36.5x FY24E EPS, in line with its historical one-year forward of 37x. We
assign multiple of 21.5x FY24E EPS to Laurus vs its historical average of 20x, as
Laurus derisks its reliance on the ARV business and embarks on a new journey.
Exhibit 1 - Our CRO/CDMO Coverage
.
Name Rating Mcap TP (INR) Rev growth (%)
FY21-24
EBITDA growth (%)
FY21-24
P/E
FY24
EV/EBITDA
FY24
ROCE (%)
FY21
TP Implied FY24
EV/EBITDA
Divi's Labs HOLD 16.4 5,148 12% 14% 39.7 28.6 31% 28.6
Syngene BUY 3.3 710 18% 20% 38.4 21.1 12% 24.9
Gland Pharma BUY 8.6 4,566 27% 26% 31.0 23.9 25% 27.9
Laurus Labs BUY 3.7 628 17% 17% 21.5 12.5 37% 14.5
Piramal Enterprises* BUY 8.6 3,050 17% 21% NA NA NA 17.8
Source: Company data, Jefferies estimates. *Piramal Enterprises growth number, implied
multiple are only for Pharma division, TP is for the group. Priced on close of 04-Jan-22
Exhibit 2 - B2B space registers higher
growth vs B2C
.
3.4%
13.2%
15.4%
0%
2%
4%
6%
8%
10%
12%
14%
16%
18%
B2C B2B Gland
Revenue Growth CY14-19
Source: IQVIA, Jefferies. MAT September
2014-19
Exhibit 3 - US accounts for 61% of Gland
Pharma's direct revenues, with ~8% from
India exports
.
US
61%
RoW
16%
India
16%
EU, Canada, Others
7%
FY21 Revenue breakup (%)
Source: Company data, Jefferies
Exhibit 4 - ARV segment accounts for
~2/3rd of Laurus sales
.
ARV API
38%
FDF
35%
CDMO
11%
Other API
11%
Onco API
5%
FY21 Revenue Breakup (%)
Source: Company data, Jefferies
Please see analyst certifications, important disclosure information, and information regarding the status of non-US analysts on
pages 65 to 71 of this report.
EQUITY RESEARCH
India | Pharmaceuticals
2. Summary of Changes
Company Ticker Rating Price
Price
Target
EPS Estimates
2021 2022 2023
P/E
2021 2022 2023
Laurus Labs
LAURUS
IN
BUY INR528.70 INR628 INR17.82 INR18.19 INR24.19 29.7x 29.1x 21.9x
Gland Pharma GLAND IN BUY INR3,851.25 INR4,566 INR60.94 INR79.14 INR99.59 63.2x 48.7x 38.7x
Divi`s Laboratories DIVI IN HOLD INR4,653.55 INR5,148 INR74.75 INR89.65 INR106.20 62.3x 51.9x 43.8x
Syngene International SYNG IN BUY INR612.70 INR710 INR10.10 INR10.25 INR12.65 60.7x 59.8x 48.4x
Piramal PIEL IN BUY INR2,685.50 INR3,050 INR55.68 INR97.88 INR127.21 48.2x 27.4x 21.1x
4 January 2022
Please see important disclosure information on pages 65 - 71 of this report.
2
EQUITY RESEARCH
India | Pharmaceuticals
3. Table of Contents
Glossary...................................................................................................................... 4
Comparable multiples..................................................................................................... 5
Executive Summary........................................................................................................ 6
Injectables - The increasingly popular delivery form............................................................... 16
ARV Market: Dolutegravir regimens are the future................................................................. 24
CDMO opportunity - Large space with high growth potential..................................................... 33
Gland Pharma............................................................................................................. 38
Large Product Offerings.......................................................................................... 39
B2B operations with robust business model................................................................. 40
New Infrastructure provides long-term growth visibility....................................................43
Financials........................................................................................................... 47
Laurus Labs................................................................................................................ 49
Formulation capacity expansion and EU client contracts to sustain growth............................ 50
Non-ARV business to be in driver's seat for API division...................................................52
CDMO to constitute ~15% revenue by FY23.................................................................. 54
Financials........................................................................................................... 58
4 January 2022
Please see important disclosure information on pages 65 - 71 of this report.
3
EQUITY RESEARCH
India | Pharmaceuticals
4. Glossary
• 1L - First-line
• 2L - Second-line
• 3L - Third-line
• 3TC - Lamivudine
• AHD - Advanced HIV Disease
• AIDS - Acquired immunodeficiency syndrome
• ARV - Antiretroviral
• ART - Antiretroviral therapy
• DRV/r - Darunavir/Ritonavir
• EFV - Efavirenz
• DTG - Dolutegravir
• FDC - Fixed-dose combination
• GA - Generic-accessible
• HIV - Human immunodeficiency virus
• LMIC - Low- and middle-income country
• LPV/r - Lopinavir/Ritonavir
• MMD - Multi-month dispensing
• NNRTI - Non-nucleoside reverse transcriptase inhibitor
• NRTI - Nucleoside reverse transcriptase inhibitor
• NRTTI - Nucleoside reverse transcriptase
• translocation inhibitor
• NVP - Nevirapine
• PEPFAR - President's Emergency Plan for AIDS Relief
• PI - Protease inhibitor
• PLHIV - People living with HIV
• RTV - Ritonavir
• SOC - Standard of care
• TAF - Tenofovir alafenamide fumarate
• TDF - Tenofovir disoproxil fumarate
• TLD - TDF+3TC+DTG
4 January 2022
Please see important disclosure information on pages 65 - 71 of this report.
4
EQUITY RESEARCH
India | Pharmaceuticals
5. Comparable multiples
Exhibit 5 - CRO/CDMO comparable multiples
.
Company Name Ticker Currency Share Price TP Ratings Mcap (USD bn) EBITDA CAGR (%) ROCE (%)
Europe FY23/CY22 FY24/CY23 FY23/CY22 FY24/CY23 FY21-24 FY21
LONZA GROUP AG-REG LONN SW EQUITY CHF 743.2 830.0 BUY 60.2 47.6 41.1 30.7 26.6 26% 9%
LABORATORIOS FARMACEUTICOS R ROVI SM EQUITY EUR 70.7 67.0 BUY 4.5 24.5 23.3 17.6 17.0 56% 14%
SIEGFRIED HOLDING AG-REG SFZN SW EQUITY CHF 879.0 NC NC 4.2 30.7 28.4 17.7 16.6 39% 7%
EVOTEC SE EVT GR EQUITY EUR 40.8 55.0 BUY 8.1 216.0 155.8 54.4 45.4 23% 1%
ICON PLC ICLR US EQUITY USD 296.0 332.0 BUY 24.1 25.7 22.1 21.5 19.2 83% 16%
India
DIVI'S LABORATORIES LTD DIVI IN EQUITY INR 4,621.7 5,148.0 HOLD 16.4 43.5 39.7 30.7 28.6 14% 31%
SYNGENE INTERNATIONAL LTD SYNG IN EQUITY INR 617.8 710.0 BUY 3.3 48.8 38.4 26.9 21.1 20% 12%
GLAND PHARMA LTD GLAND IN EQUITY INR 3,885.6 4,566.0 BUY 8.6 39.0 31.0 29.6 23.9 26% 25%
NEULAND LABORATORIES LTD NLL IN EQUITY INR 1,558.5 NC NC 0.3 19.6 14.5 11.6 9.5 25% 10%
LAURUS LABS LTD LAURUS IN EQUITY INR 519.1 628.0 BUY 3.7 21.5 17.8 14.8 12.5 17% 37%
HIKAL LTD HKCI IN EQUITY INR 547.8 NC NC 0.9 27.3 21.9 15.4 13.0 32% 10%
China
WUXI APPTEC CO LTD-H 2359 HK Equity HKD 117.8 260.0 BUY 49.7 48.2 36.1 29.6 22.7 55% 11%
WUXI BIOLOGICS CAYMAN INC 2269 HK EQUITY HKD 82.9 200.0 BUY 45.3 64.3 44.5 37.8 27.2 100% 9%
PHARMARON BEIJING CO LTD-H 3759 HK EQUITY HKD 110.4 224.0 BUY 15.7 35.9 27.2 28.1 21.9 47% 12%
HANGZHOU TIGERMED CONSULTI-H 3347 HK EQUITY HKD 91.2 308.0 BUY 15.4 25.4 20.7 40.2 30.6 5% 17%
ASYMCHEM LABORATORIES TIAN-A 002821 CH EQUITY CNY 391.5 NC NC 15.7 61.0 49.0 45.7 36.6 68% 16%
ZHEJIANG JIUZHOU PHARMACEU-A 603456 CH EQUITY CNY 51.1 NC NC 6.7 50.0 38.7 31.8 25.0 46% 10%
HANGZHOU TIGERMED CONSULTI-A 300347 CH EQUITY CNY 118.5 260.0 BUY 15.4 41.6 34.3 40.0 32.0 9% 17%
FRONTAGE HOLDINGS CORP 1521 HK EQUITY HKD 4.0 6.5 BUY 1.0 29.3 22.0 2.1 1.6 55% 6%
United States
CHARLES RIVER LABORATORIES CRL US EQUITY USD 362.1 464.0 BUY 18.3 31.6 27.4 21.3 18.6 28% 11%
P/E EV/EBITDA
Source: FactSet, Jefferies estimates. Forward estimates for Divi's, Syngene, Gland, and Laurus are Jefferies estimates, for rest it is consensus
estimates. Priced on close of 4-Jan-22
Indian firms clock impressive ROCE
Indian and Chinese CRO companies trade in line with each other. While Chinese
companies have higher estimated earnings growth over the next three years, Indian
companies have better ROCE metrics. Indian companies have been conservative and,
barring Piramal, have grown in an organic fashion. We believe the higher multiples
assigned to Divi's and Gland reflect their ROCE profile, dominant market position in
respective categories, and robust growth outlook.
Pharma contract manufacturing is growing faster than Pharma, as it makes
economic sense for Pharma companies to outsource several components of R&D and
manufacturing to specialists. This provides a higher visibility to Pharma CRO/CDMO
growth over the next few years vs mainline Pharma companies. The other reasons
why Indian Pharma CRO/CDMOs such as Divi's, Gland, and Syngene trade at higher
multiples vs mainstream Pharma are better regulatory compliance records and higher
ROCEs.
4 January 2022
Please see important disclosure information on pages 65 - 71 of this report.
5
EQUITY RESEARCH
India | Pharmaceuticals
6. Executive Summary
Injectables is a high-growth delivery form, and its popularity is increasing
Oral solids were the largest category of delivery systems, accounting for 50% of the
global pharma market in CY14; the second-largest was injectables at 32% share. From
CY14 to CY19, the global injectables market clocked a 10% CAGR to reach a market
size of USD432bn and market share of 39%, catching up with oral solids' share of
45%. Injectables have several advantages over other traditional dosage forms, including
instant action, administration in a controlled manner, physician oversight, and bypass of
gastrointestinal tract absorption. Biologics can only be administered through injectable
route. Between CY14 and CY19, more than half of the drugs that were in shortage in
the US belonged to the injectables category. According to an USFDA study, the major
reason for the drug shortage was supply disruption due to manufacturing and product
quality issues.
Per IQVIA, North America has been the largest injectables market over the years and, in
2019, accounted for 55% or USD239Bn of the global injectables by value; Europe with a
market size of USD87bn stands second. Per IQVIA, the CY19 generic injectable market
was worth USD131bn. North America is not just the largest generic injectable market
but also the fastest-growing one. However, in North America, penetration of generics is
low vs other regions.
About the 80% of global injectables market is captured by five therapy areas
and injectables usage continues to increase with time. The key therapies are 1)
Antineoplastics and immunomodulators; 2) Alimentary tract and metabolic drugs; 3)
Systemic anti-infective; 4) Nervous system– and blood-related; 5) Musculoskeletal
system.
Injectables are the fastest-growing
delivery system, and 80% of the
injectable market is captured by 5
therapy areas
Exhibit 6 - Injectables account for 39% of total pharma market,
up from 32%
.
412 490
267
432
147
174
0
200
400
600
800
1000
1200
2014 2019
Global Pharmaceutical Market Delivery Format, CY14-19
Oral Solids Injectables Others
Source: IQVIA, Jefferies. MAT September 2014-2019. "Others" mean
drugs for lung administration, ophthalmic, topical, other systemic, nasal,
rectal, oral liquids, and oral topical uses
Exhibit 7 - Injectables have clocked best growth vs various other
delivery forms
.
3.4%
3.5%
10.1%
0.0% 2.0% 4.0% 6.0% 8.0% 10.0% 12.0%
Others
Oral solids
Injectables
Growth Rate by delivery format CY14-19
Source: IQVIA, Jefferies. MAT September 2014-2019.
4 January 2022
Please see important disclosure information on pages 65 - 71 of this report.
6
EQUITY RESEARCH
India | Pharmaceuticals
7. Exhibit 8 - North America, EU are the largest injectables markets
.
127
61 38 39 2 239 87
54 49 3
392
193 165
65 11
531
253
203
92
18
0
100
200
300
400
500
North
America
Europe RoW China India North
America
Europe RoW China India
Overall Market with Injectables Market, CY14-19 (USD bn)
Injectable Others
2014 20
Source: IQVIA, Jefferies. MAT September 2014-2019
Exhibit 9 - Cancer and immunity products are the largest therapy areas for injectables
.
81
40 40 26 25
10
44
155
72
53
37 31 17
66
0
30
60
90
120
150
180
Antineoplasti
c
+
Immunomod
ulators
Alimentary
Tract
+
Metabolic
Systemic
Anti-
infectives
Nervous
system
Blood
related
Musculoskele
tal
Others
Global Injectables Market: Therapeutic Areas Distribution, 2014 (USD bn)
2014 2019
Source: IQVIA, Jefferies. MAT September 2014
Per IQVIA, the largest injectables market, the US, is expected to clock 15% CAGR during
CY19-24 vs the CY14-19 CAGR of 13.6%. The generic US market CAGR during CY19-24
is expected to be 16.1%. The high growth is expected to be driven by the large value of
molecules that will lose exclusivity during the period. In 2013, the value of injectables
molecules that lost exclusivity during CY14-19 was USD32.8bn; in 2029, the value of
molecules that will lose exclusivity during CY19-24 is USD61.3bn.
Exhibit 10 - Global generic injectables market is USD131 bn
.
25
46
18
29
14
20
30
34
1
2
0
50
100
150
2014 2019
Global Generic Injectables Market: Geographic Distribution,
CY14-19 (USD bn)
North America Europe RoW China India
Source: IQVIA, Jefferies. MAT September 2014-2019
Exhibit 11 - Per IQVIA, US generic injectables is expected clock
16% CAGR during CY19-24
.
97
186
377
24
44
92
0
100
200
300
400
500
2014 2019 2024
United States Injectables Pharmaceutical Market
Innovators Generics
Source: IQVIA, Jefferies. 2024 is forecast for MAT September 2024,
based on MAT data until September 2019.
4 January 2022
Please see important disclosure information on pages 65 - 71 of this report.
7
EQUITY RESEARCH
India | Pharmaceuticals
8. Exhibit 12 - Injectables worth USD61.3bn losing exclusivity
during CY20-24...
.
10.1
47.4
3.8
0
10
20
30
40
50
2020-21 2022-23 2024
US: Value of LoE of Injectables Molecules in CY20-24 in 2019
Source: IQVIA, Jefferies. 2024 is forecast for MAT September 2024,
based on MAT data until September 2019. LoE - Loss of Exclusivity
Exhibit 13 - ...of which USD7.8bn is from small molecules
.
4.5
2.5
0.8
0.0
1.0
2.0
3.0
4.0
5.0
2020-21 2022-23 2024
US: Value of LoE of Small Molecule Injectables during CY20-
24 in 2019
Source: IQVIA, Jefferies. 2024 is forecast for MAT September 2024,
based on MAT data until September 2019.
Exhibit 14 - Ex-Biologics, CRO/CDMO market to grow at 10% CAGR
.
9.4 10.2 11.5 12.9 14.1 15.8 18.0 20.7 24.2 27.7 31.2 34.9 38.8 42.7 46.9
7.1 7.7 8.4 9.1 9.5 10.7 11.9 13.1 14.4 15.8 17.2 18.7 20.3 21.9 23.6
32.4 34.6 37.9 40.6 41.8 45.7
50.1
54.9
60.2
65.9
72.0
78.5
85.0
91.6
98.4
1.0 1.2
1.5 1.9 2.3
2.9
3.9
5.6
7.7
10.1
12.6
15.2
17.8
20.5
23.4
25.9 28.2
31.3
33.8 37.5
42.0
46.9
51.6
56.3
60.6
64.8
69.0
73.2
77.6
82.2
75.8
81.9
90.6
98.3
105.2
117.1
130.8
145.9
162.8
180.1
197.8
216.3
235.1
254.3
274.5
-25
25
75
125
175
225
275
2016 2017 2018 2019 2020 2021E 2022E 2023E 2024E 2025E 2026E 2027E 2028E 2029E 2030E
Global Pharmaceutical R&D Outsourcing Market Size (USD bn)
Discovery Preclinical Clinical CGT CMO/CDMO Small molecule CDO/CDMO
Source: Frost & Sullivan, Jefferies
4 January 2022
Please see important disclosure information on pages 65 - 71 of this report.
8
EQUITY RESEARCH
India | Pharmaceuticals
9. Generic ARV Market: Dolutegravir (DTG) regimens still have room to grow, generic
manufacturer such as Laurus at advantage
The new infection rate for HIV, the Virus that causes AIDS, has remained stubbornly
high for the past few years. New infections in CY20 were 1.5m, which is nearly 3x the
WHO target for CY20. The positivity rate at AIDS Healthcare Facilities in 2020 was
3.5%, the highest in the past five years. In 2018, WHO released new interim guidelines
recommending Dolutegravir-based regimens as the most preferred in both first line (1L;
most preferred drugs that are tried first during a treatment) and second-line treatment
(2L; drugs that are used in treatment when the most preferred treatment does not work).
This is because DTG-based regimens have proven to be both more clinically beneficial
and affordable over Nevirapine & Efavirenz. As of 2020, 67% of the adult population living
with HIV (PLHIV) was on Dolutegravir-based 1L treatments, and CHAI (Clinton Health
Access Initiative) estimates that by CY23 this will increase to 94%.
Dolutegravir-based regimens have
proven to be both more clinically
beneficial and affordable over Nevirapine
& Efavirenz
Exhibit 15 - ARV market for Generics accessible Low- and
Middle-Income countries (GA-LMIC) is USD1.9bn
.
1.6
1.7 1.7 1.7
1.9
0.0
0.5
1.0
1.5
2.0
2016 2017 2018 2019 2020
ARV market size for GA LMIC (USD bn)
Source: Clinton Health Access Initiative Report 2021, Jefferies.
Exhibit 16 - DTG-based regimen to gain further share in first line of treatment
.
13% 5% 2%
85%
66%
31%
14% 8%
6%
6% 6%
2%
29%
67%
86% 92% 94% 94% 94%
0%
20%
40%
60%
80%
100%
2018 2019 2020 2021E 2022E 2023E 2024E 2025E
1L Adult INSTI/NNRTI Use in GA LMICs, Growth and Share (Includes Use as FDC
and Singles)
NVP EFV DTG
Source: Clinton Health Access Initiative Report 2021, Jefferies
4 January 2022
Please see important disclosure information on pages 65 - 71 of this report.
9
EQUITY RESEARCH
India | Pharmaceuticals
10. Exhibit 17 - DTG-based regimen use is increasing for pediatric
treatments
.
4%
18%
25%
35%
53%
32%
33%
19%
43%
28%
10%
0%
20%
40%
60%
80%
100%
2018 2019 2020
Estimated Pediatric NNRTI/PI/INSTI Use in GA LMICs
DTG LPV/r EFV NVP
Source: Clinton Health Access Initiative Report 2021, Jefferies
Exhibit 18 - Dolutegravir is associated with higher life
expectancy, per CEPAC modelling study
.
39.4 39.0
33.1
0
10
20
30
40
50
DTG without VL
Testing
DTG with VL Testing No DTG
Impact of DTG and VL Testing on Child Life Expectancy in
CEPAC Modelling Study
Source: Clinton Health Access Initiative Report 2021, Jefferies. CEPAC -
Cost-Effectiveness of Preventing AIDS Complications
4 January 2022
Please see important disclosure information on pages 65 - 71 of this report.
10
EQUITY RESEARCH
India | Pharmaceuticals
11. Comparison of our CRO/CDMO coverage
Exhibit 19 - Gland Pharma scores high on growth, services
demand, and large-scale experience
.
0
1
2
3
4
5
Growth Outlook
Experience of
Scale
Range incl.
Biologics/High
Potency
Big Pharma
relationships
Demand Supply
gap
Gland Pharma
Source: Jefferies
Exhibit 20 - We rate Laurus Labs high on scale experience,
growth outlook
.
0
1
2
3
4
5
Growth Outlook
Experience of
Scale
Range incl.
Biologics/High
Potency
Big Pharma
relationships
Demand Supply
gap
Laurus Labs
Source: Jefferies
Exhibit 21 - Divi's Labs is strong on Big Pharma relationships
and large-scale experience
.
0
1
2
3
4
5
Growth Outlook
Experience of
Scale
Range incl.
Biologics/High
Potency
Big Pharma
relationships
Demand Supply
gap
Divi's Labs
Source: Jefferies
Exhibit 22 - Piramal Pharma has large range of product/service
offerings
.
0
1
2
3
4
5
Growth Outlook
Experience of
Scale
Range incl.
Biologics/High
Potency
Big Pharma
relationships
Demand Supply
gap
Piramal
Source: Jefferies
Exhibit 23 - Syngene has good Big Pharma relationships
.
0
1
2
3
4
5
Growth Outlook
Experience of
Scale
Range incl.
Biologics/High
Potency
Big Pharma
relationships
Demand Supply
gap
Syngene
Source: Jefferies
4 January 2022
Please see important disclosure information on pages 65 - 71 of this report.
11
EQUITY RESEARCH
India | Pharmaceuticals
12. Gland Pharma - One-of-a-kind pure-play injectable CDMO
Gland Pharma is a one-of-a-kind purely injectables contract manufacturer that operates
in the B2B space. Injectables acccount for 98% of its revenue while ophthalmic fetches
the remaining 2%. The company earns two-thirds of its revenue from the US region;
other key geographies include RoW (16%) and India (9%). As a highly specialized
manufacturer, Gland has reached economies of large scale and provides low-cost
manufacturing services to its clients. The company has five key business models: 1)
B2B IP-led Own filing; 2) B2B IP-led Partner Filing; 3) B2B Transfer Technology; 4) B2B
CMO; and 5) B2C. Gland Pharma has a flawless track record on compliance and has
been compliant with various developed market regulatory bodies.
Injectables account for 98% of revenue
for Gland Pharma; two-thirds of sales
came from US, India accounts for 9%
Gland has several levers that will play out in coming years and should provide long-term
high-growth visibility. In the US, they have commercialized products worth USD7.5bn,
and their pending ANDAs (including tentative approvals) are worth USD7.5bn. Gland has
shortlisted ~17 complex injectable products that they will target in the short term; 4 of
them will be filed this year. Gland has over 1,000 products registered in the RoW market,
but it wasn’t able to capitalize on this due to capacity constraints and its focus on US
markets. With the Pashamylaram facility that came online in 2016, Gland Pharma now
can commercialize their products in RoW markets. The company has aggressive plans
for the China market, as they plan to partner with their promoter, Fosun Pharma, and
rapidly scale up in the region. In mid-2021, Gland acquired a 10Kl biologics facility from
Vitane Biologics and is investing INR3bn in FY22 to add another 10Kl capacity. Gland
Pharma will be further expanding their biologics capacity in next few years to reach 60Kl,
and the division would provide growth in the long run.
Gland Pharma has pending ANDAs worth
USD7.5bn
Gland Pharma stock has jumped 114% since listing and past one-year returns stand at
66%, making it the among the best-performing stock in our pharma/CDMO coverage.
Gland Pharma’s IPO in Nov-20 was one of the heavyweights of 2020, with an issue size of
INR65bn, but it still started with a listing gain of 14%. We like Gland Pharma, a specialist
play that we believe is difficult to master and has entry barriers. The company has
several growth levers that should allow it to clock 25%+ revenue CAGR during FY21-24.
We value Gland Pharma at 36.5x FY24E EPS, in line with its historical multiple of 37x.
Our price target is INR4,566, and we initiate with a Buy rating.
Gland Pharma has several growth levers
that should allow it to clock 25%+
revenue CAGR during FY21-24
Exhibit 24 - Injectables account for 98% of Gland Pharma's
revenue
.
Injectables 98%
Ophthal 2%
Gland Revenue breakup
Source: Company data, Jefferies
Exhibit 25 - US accounts for 61% of Gland Pharma's direct
revenues, with ~8% from India exports
.
US
61%
RoW
16%
India
16%
EU, Canada, Others
7%
FY21 Revenue breakup (%)
Source: Company data, Jefferies
4 January 2022
Please see important disclosure information on pages 65 - 71 of this report.
12
EQUITY RESEARCH
India | Pharmaceuticals
13. Exhibit 26 - B2B space registers higher growth vs B2C
.
3.4%
13.2%
15.4%
0%
2%
4%
6%
8%
10%
12%
14%
16%
18%
B2C B2B Gland
Revenue Growth CY14-19
Source: IQVIA, Jefferies. MAT September 2014-19
Exhibit 27 - Gland Pharma Business Models
.
ANDA/Product
registeration ownership
Development by Gland IP ownership Marketing rights Royalty/Profits sharing
B2B IP Led Own filing Yes Yes Yes Yes Yes
Partner Filing No Yes Co-owned No Yes
B2B Technology Transfer No Yes No No Yes
B2B CMO No No No No No
B2C Yes Yes Yes Yes Not applicable
Source: Company data, Jefferies
Exhibit 28 - Margin robustness to continue, as Gland remains
margin conscious while expanding in RoW markets
.
5
7
10
13
16
21
26
33%
35%
36%
38%
37% 37%
37%
30%
31%
32%
33%
34%
35%
36%
37%
38%
0
5
10
15
20
25
30
FY18 FY19 FY20 FY21 FY22E FY23E FY24E
Total EBITDA (INRm) EBITDA Margin (%)
Source: Company data, Jefferies
Exhibit 29 - Gland Pharma share price performance
.
0
50
100
150
200
250
Nov-20
Dec-20
Jan-21
Feb-21
Mar-21
Apr-21
May-21
Jun-21
Jul-21
Aug-21
Sep-21
Oct-21
Nov-21
Dec-21
Gland Pharma vs Nifty Pharma Index share price comparison
(base = 100)
Gland Pharma Nifty Pharma
Source: FactSet, Jefferies
4 January 2022
Please see important disclosure information on pages 65 - 71 of this report.
13
EQUITY RESEARCH
India | Pharmaceuticals
14. Laurus Labs: ARV API giant, diversifying its operations
Laurus Labs has evolved over the years from an Antiretroviral API supplier to a
diversified pharma company. Currently, Anti-retro viral — i.e., ARV (drugs for HIV-AIDS)
— accounts for two-thirds of its revenue, and rest of the business is from non-ARV. The
revenue breakup is as follows: ARV API (38%), Formulations (35%), CDMO (11%), Onco
API (5%), and Other API (11%). Laurus is a global leader in the ARV business, with a ~12-
product API portfolio covering 1st and 2nd lines of treatment, and is the supplier for 80%
of players who bid on ARV tenders. Laurus Labs is in the process of diversifying away
from its ARV business, which it believes can still grow at single digits, and has started a
capex program of INR18bn during FY22-23 that should increase its gross block by 67%.
Laurus has a ~12-product API portfolio
covering 1st and 2nd lines of ARV
treatment and is the supplier for 80% of
players that bid on ARV tenders
Laurus is expanding its OSD capacities from 5bn (in FY21) to 10bn per year and is
focusing on those products where it has backward integration capabilities. It has new
contracts from a European partner for generic formulations, which provides growth
visibility. For the API division, future product pipeline includes DPP-IV inhibitors that
will go off-patent in coming years and sartans, where the company has developed an
impurity-free process. Laurus has a relatively small custom synthesis business that
has 50 ongoing projects and 4 commercial projects. Laurus is building two dedicated
manufacturing units that will be operational by FY24 and a 200k sq. ft. R&D facility that
will be up by FY23.
Laurus has new contracts from
a European partner for generic
formulations, which provides growth
visibility for the segment
Laurus Labs has delivered impressive 422% returns since its listing in Jan-17, and most
of the returns have come post May-20, as the company benefited from the Efavirenz
to Dolutegravir shift in Anti-retroviral (ARV) treatment, market share gains, and multi-
month dispensation drug packet. The stock has come off from its all-time high of
INR723 in Aug, as inventories drawn down led to a slight YoY decline in ARV business
in 2QFY22. The stock has traded at reasonable multiples in the past, with its historical
average just 20x one-year-forward due to its heavy reliance on the ARV busines. Laurus
is creating large capacities to expand its non-ARV business and is strategically targeting
where it can make a vertically integrated play to have cost competitiveness, while the
CDMO business will soon have dedicated facilities, ending any kind of IP conflicts. By
our estimates, Laurus should clock 17% revenue and EBITDA CAGR during FY21-24.
We value the stock at 21.5x FY24E EPS, with price target of INR628, and we rate the
company Buy.
By our estimates, Laurus should clock
17% revenue and EBITDA CAGR during
FY21-24
Exhibit 30 - Laurus has moved over the years from an ARV firm to API to a diversified
pharma company
.
Capabilities 2006-11 2011-16 2016-21
Description ARV API Company API Company Pharmaceutical Company
Team strength 883 2,266 4,808
No of Scientist at R&D 400+ 500+ 750+
Manufacturing units 1 (FDA Compliant) 2 (FDA Compliant) 8 (5 FDA)
Reactor volume (KL) 220 1,870 4,638
Formulations OSD billion - 2 5
DMFs 12 28 61
ANDAs - Total filed 27
- Para IV 2
- First to file 7
CDMO Project pipeline - <20 50
Patents – Filed 48 218 292
Granted - 25 150
USFDA approved manufacturing sites 1 2 5
Source: Company data, Jefferies
4 January 2022
Please see important disclosure information on pages 65 - 71 of this report.
14
EQUITY RESEARCH
India | Pharmaceuticals
15. Exhibit 31 - ARV segment accounts for ~2/3rd of Laurus sales
.
ARV API
38%
FDF
35%
CDMO
11%
Other API
11%
Onco API
5%
FY21 Revenue Breakup (%)
Source: Company data, Jefferies
Exhibit 32 - Upcoming products would largely be non-ARV in
US/EU
.
80% 20%
0% 20% 40% 60% 80% 100% 120%
Pending/UD(66)>
US/EU pipeline by Addressable Market
Non-ARV ARV
USD38 bn
Source: Company data, Jefferies. UD - Underdevelopment
Exhibit 33 - Laurus will incur ~INR16-18bn capex during FY22-23
.
Expansion Type Division Location Status & Capacity Operational Timelines
Brownfield Formulation Vizag Unit 2 - 4 billion units (New building) Completion by Mar 22
Brownfield Formulation Vizag Unit 2 - 1 billion units (De-bottlenecking) Completed
Brownfield API Vizag Unit 3, 4, and 6 (1,000KL) Ongoing
Greenfield API Vizag Unit 7, 8 Land acquired FY24/25
Greenfield Formulation Hyderabad Unit 9 Land acquired Phase 1 – FY24
Brownfield Custom Synthesis Vizag Unit 1 (LSPL) Completed
Greenfield Custom Synthesis Vizag Land acquired (Unit 2 & Unit 4 - LSPL) FY24
Greenfield Custom Synthesis Vizag Land acquired (Unit 3 LSPL) FY24/25
Greenfield R&D Center (Synthesis) Hyderabad Land acquired FY23
Source: Company data, Jefferies
Exhibit 34 - Laurus Labs share price performance
.
-100
100
300
500
700
Jan-17
May-17
Sep-17
Jan-18
May-18
Sep-18
Jan-19
May-19
Sep-19
Jan-20
May-20
Sep-20
Jan-21
May-21
Sep-21
Laurus Pharma vs Nifty Pharma Index share price
comparison (base = 100)
Laurus Labs Nifty Pharma
Source: Factset, Jefferies
4 January 2022
Please see important disclosure information on pages 65 - 71 of this report.
15
EQUITY RESEARCH
India | Pharmaceuticals
16. Injectables - The increasingly popular delivery form
The fast-growing injectables space
Oral solids are the largest category of delivery systems, accounting for 50% of the global
pharma market in CY14, with the second largest being injectables at 32% share. From
CY14 to CY19, the global injectables market clocked a 10% CAGR to reach a market size
of USD432bn with share of 39%, catching up with oral solids' share of 45%. Injectables
have several advantages over other traditional dosage forms:
• Instant action of the drug
• Preferred for patients who are unable to take other dosage forms such as oral
solids People who are comatose are administered drugs using this delivery
system
• Drugs can be administered to a specific location in a controlled manner
• Pen injection and auto-injectors have made administration of this delivery
format easy and convenient, which can be done at home
• Some drug formulations are less soluble in water and are difficult to be
absorbed by the gastrointestinal tract; thus, intravenous administration is the
only way forward for such molecules
From CY14 to CY19, global injectables
market clocked a 10% CAGR
Exhibit 35 - Injectables account for 39% of total pharma market,
up from 32%
.
412 490
267
432
147
174
0
200
400
600
800
1000
1200
2014 2019
Global Pharmaceutical Market Delivery Format, CY14-19
Oral Solids Injectables Others
Source: IQVIA, Jefferies. MAT September 2014-2019. "Others" means
drugs for lung administration, ophthalmic, topical, other systemic, nasal,
rectal, oral liquids, and oral topical uses
Exhibit 36 - Injectables have clocked best growth vs various
other delivery forms
.
3.4%
3.5%
10.1%
0.0% 2.0% 4.0% 6.0% 8.0% 10.0% 12.0%
Others
Oral solids
Injectables
Growth Rate by delivery format CY14-19
Source: IQVIA, Jefferies. MAT September 2014-2019.
Exhibit 37 - Injectables clocked healthy volume and price growth during CY14-19
.
Volume Growth (%) Price Growth (%)
Others -2.0% 5.6%
Injectables 6.3% 3.6%
Oral Solids 2.1% 1.4%
Global Pharmaceutical Market Delivery Format, CY14-19 CAGR
Source: IQVIA, Jefferies. MAT September 2014-2019.
Tough quality requirements pose entry barriers
Injectables have high entry barriers due to their inherent complex nature, high capital
investments, operational costs, and stricter compliance requirements. Because the
effect of injectables is high and instant in the body, the products are required to
be sterile and of very high quality, which makes it challenging to build and operate
such plants. Capital requirements for injectables plants are typically 1.3-1.5x higher
than for oral solids due to high-quality requirements and low margins of error. Due to
For the US market, 70% of the generic
injectable market has less than half the
number of manufacturers vs oral solids
4 January 2022
Please see important disclosure information on pages 65 - 71 of this report.
16
EQUITY RESEARCH
India | Pharmaceuticals
17. several complexities associated with injectables, for the US market, 70% of the generic
injectable market has less than half the number of manufacturers vs oral solids.
Between CY14 and CY19, more than half of the drugs that were in shortage in the US
belonged to the injectables category. According to an USFDA study, the major reasons
for the drug shortage were supply disruptions due to manufacturing and product-quality
issues.
Exhibit 38 - Quality issue is the biggest reason for drug
shortages
.
Quality Issues
62%
Unknown
18%
Increase in Demand
12%
Natural Disaster
5%
Product discontinuation
3%
Percentage of drugs in Shortage by Reason CY13-17
Source: IQVIA, Jefferies.
Exhibit 39 - Injectables manufacturing has been consolidated in recent years
.
Year Acquirer Target Deal Value in USDm
2019 Recipharm (Sweden) Nichepharm (India) 11
2019 Aurobindo (India) Spectrum Pharma (USA) 300
2018 Hikma (USA) Medlac (Vietnam) 17
2017 Baxter (USA) Claris (India) 625
2017 Fosun (China) Gland (India) 1,091
2016 Recipharm (Sweden) Nitin (India) 103
2015 Pfizer (USA) Hospira (USA) 17,000
2014 Pfizer (USA) Innopharma (Ireland) 360
2014 Hikma (USA) Bedford Labs (USA) 300
2013 Mylan (USA) Agila Specialties (India) 1,750
Source: IQVIA, Jefferies
North America and Europe are the largest markets
Per IQVIA, North America has been the largest injectables market over the years
and, in 2019, accounted for 55% of global injectables by value. Europe with a market
size of USD87bn was a distant second, and China was the third-largest market. The
India market was estimated by IQVIA at USD3bn, with RoW at USD54bn. Typically,
emerging markets clock higher growth for pharma market due to their smaller size,
increasing drug affordability and availability; however, the injectables North American
market registered the best growth among all the major geographies, underscoring the
increasing importance of injectables and their adoption. Among the RoW, Japan, Russia,
Korea, and Saudi Arabia were the largest markets, constituting about 68% of the market.
Per IQVIA, China had the highest generic penetration (by volume) for injectables at 89%
in 2019. North America has the lowest generic penetration, and several key generic
molecules declined in volume during CY14-19, including Hydromorphone, Ondansetron,
Morphine, Vancomycin, and Midazolam. Even though North America has the lowest
generic penetration, it forms 35% of the global generic injectables market, with China
26%, EU 22%, and RoW 15%.
Even though North America has lowest
generic penetration the it forms 35% of
global generic injectables market
4 January 2022
Please see important disclosure information on pages 65 - 71 of this report.
17
EQUITY RESEARCH
India | Pharmaceuticals
18. Exhibit 40 - North America, EU are the largest injectables markets
.
127
61 38 39 2 239 87
54 49 3
392
193 165
65 11
531
253
203
92
18
0
100
200
300
400
500
North
America
Europe RoW China India North
America
Europe RoW China India
Overall Market with Injectables Market, CY14-19 (USD bn)
Injectable Others
2014 20
Source: IQVIA, Jefferies. MAT September 2014-2019
Exhibit 41 - North America has lowest generic injectables
penetration
.
59% 66%
81% 91%
72%
57%
71%
85% 89%
76%
0%
20%
40%
60%
80%
100%
North
America
Europe RoW China India
Penetration of Generics in Injectables Form, 2014 and 2019
(% volume share)
2014 2019
Source: IQVIA, Jefferies. MAT September 2014-2019
Exhibit 42 - Global generic injectables market is USD131 bn
.
25
46
18
29
14
20
30
34
1
2
0
50
100
150
2014 2019
Global Generic Injectables Market: Geographic Distribution,
CY14-19 (USD bn)
North America Europe RoW China India
Source: IQVIA, Jefferies. MAT September 2014-2019
Exhibit 43 - North American generic market has grown fastest
among major regions
.
3.0%
6.4%
8.9%
9.8%
12.5%
0.0% 2.0% 4.0% 6.0% 8.0% 10.0% 12.0% 14.0%
China
RoW
India
Europe
North America
Global Generic Injectables Market, CY14-19 CAGR
Source: IQVIA, Jefferies. MAT September 2014-2019
Per IQVIA, the largest injectables market, the US, is expected to clock 15% CAGR during
CY19-24 vs the CY14-19 CAGR of 13.6%. The generic US market CAGR during CY19-24
is expected to be 16.1%. The high growth is expected to be driven by the large value of
molecules that will lose exclusivity during the period. The value of injectables molecules
in 2013 that lost exclusivity during CY14-19 was USD32.8bn while the value of molecules
in 2019 that will lose exclusivity during CY19-24 is USD61.3bn.
4 January 2022
Please see important disclosure information on pages 65 - 71 of this report.
18
EQUITY RESEARCH
India | Pharmaceuticals
19. Exhibit 44 - Per IQVIA, US generic injectables is expected clock
16% CAGR during CY19-24
.
97
186
377
24
44
92
0
100
200
300
400
500
2014 2019 2024
United States Injectables Pharmaceutical Market
Innovators Generics
Source: IQVIA, Jefferies. 2024 is forecast for MAT September 2024,
based on MAT data until September 2019.
Exhibit 45 - Injectables worth USD61.3bn losing exclusivity
during CY20-24...
.
10.1
47.4
3.8
0
10
20
30
40
50
2020-21 2022-23 2024
US: Value of LoE of Injectables Molecules in CY20-24 in 2019
Source: IQVIA, Jefferies. 2024 is forecast for MAT September 2024,
based on MAT data until September 2019. LoE - Loss of Exclusivity
Exhibit 46 - ...of which USD7.8bn is from small molecules
.
4.5
2.5
0.8
0.0
1.0
2.0
3.0
4.0
5.0
2020-21 2022-23 2024
US: Value of LoE of Small Molecule Injectables during CY20-
24 in 2019
Source: IQVIA, Jefferies. 2024 is forecast for MAT September 2024,
based on MAT data until September 2019.
Injectables delivery form highly popular among certain therapies
About 80% of global injectables market is captured by 5 therapy areas and injectables
usage continues to increase with time. The key therapies from injectables point of view
are as follows:
• Antineoplastics (cancer drugs) and immunomodulators (immune system–
related) constituted about 36% of the injectables market and 12% of the
generics market in 2019
• Alimentary tract and metabolic drugs (diabetic-related drugs) form 17% of
global injectable market 7% of the generic injectables; this class also includes
smaller domains such as intestinal disorder drugs, anti-flatulents, and anti-
emetics
• Systemic anti-infective constituted 12% of the global injectable market and 35%
in generics
• Nervous system– and blood-related therapies accounted for 16% of global
injectables and 6% of generics
• Musculoskeletal formed 4% each of total injectable market and generics market
80% of global injectables market is
captured by 5 therapy areas
4 January 2022
Please see important disclosure information on pages 65 - 71 of this report.
19
EQUITY RESEARCH
India | Pharmaceuticals
20. Exhibit 47 - Except China, all markets have registered healthy volume and price
increases in injectables
.
Volume Growth (%) Price Growth (%)
India 2.5% 6.3%
China 1.0% 2.0%
RoW 4.2% 2.1%
Europe 7.0% 2.7%
North America 7.0% 5.1%
Global Generic Injectables Market, CY14-19 CAGR
Source: IQVIA, Jefferies. MAT September 2014-2019
Exhibit 48 - Cancer and immunity products are the largest therapy areas for
injectables
.
81
40 40 26 25
10
44
155
72
53
37 31 17
66
0
30
60
90
120
150
180
Antineoplasti
c
+
Immunomod
ulators
Alimentary
Tract
+
Metabolic
Systemic
Anti-
infectives
Nervous
system
Blood
related
Musculoskele
tal
Others
Global Injectables Market: Therapeutic Areas Distribution, 2014 (USD bn)
2014 2019
Source: IQVIA, Jefferies. MAT September 2014
Exhibit 49 - Cancer, Immunity, and diabetic drugs saw the best injectables growth
during CY14-19
.
4.2%
5.8%
7.2%
8.6%
11.0%
12.5%
13.8%
0% 2% 4% 6% 8% 10% 12% 14% 16%
Blood related
Systemic Anti-infectives
Nervous system
Others
Musculoskeletal
Alimentary Tract + Metabolic
Antineoplastic + Immunomodulators
Global Injectables Market: Therapeutic Areas Distribution, CY14-19 CAGR
Source: IQVIA, Jefferies. MAT September 2014-19
4 January 2022
Please see important disclosure information on pages 65 - 71 of this report.
20
EQUITY RESEARCH
India | Pharmaceuticals
21. Exhibit 50 - While volume increase for various therapies has been encouraging, some
therapies saw price decline
.
Volume Growth (%) Price Growth (%)
Antineoplastic + Immunomodulators 12.2% 1.4%
Alimentary Tract + Metabolic 8.7% 3.5%
Systemic Anti-infectives 8.2% -2.2%
Nervous system 4.9% 2.2%
Blood related 5.2% -1.1%
Musculoskeletal 9.7% 1.2%
Global Injectables Market: Therapeutic Areas Distribution, CY14-19 CAGR
Source: IQVIA, Jefferies. MAT September 2014.
According to IQVIA, the generics market accounted for 30% of the total injectables
market by value in 2019. The generics injectable market size was estimated by IQVIA at
USD131bn, increasing at an 8% CAGR during CY14-19. The innovator injectables market
size was USD301bn and witnessed an 11% CAGR for CY14-19.
2019 generics injectable market size was
estimated by IQVIA at USD131bn
Exhibit 51 - NCEs have outpaced generics on injectables
.
8.0%
11.1%
0.0% 2.0% 4.0% 6.0% 8.0% 10.0% 12.0%
Generic
Innovator
Global Injectables Market: Innovator and Generic, CY14-19
(US bn)
Source: IQVIA, Jefferies. MAT September 2014-19
Exhibit 52 - NCEs injectables had both higher volume as well as price increase vs
generics
.
Volume Growth (%) Price Growth (%)
Innovator 7.0% 3.9%
Generic 4.8% 3.1%
Global Injectables Market: Innovator and Generic, CY14-19 (US bn)
Source: IQVIA, Jefferies. MAT September 2014-19
Injectables are administered through various delivery methods, but infusions, pre-filled
syringes, and vials accounted for 85% of the market in 2019. Infusions are the most
popular among the three, as they are a good alternative to oral medications and
are used extensively by hospitals. Pre-filled syringes (PFSs) saw 14.5% CAGR during
CY14-19, due to their advantages of convenience and affordability. Antineoplastics and
immunomodulators account for 50% of value for infusion and PFS systems. Nervous
system and anti-infectives contributed 20% for the two delivery formats.
Infusions, pre-filled syringes, and vials
accounted for 85% of the injectables
market in 2019
4 January 2022
Please see important disclosure information on pages 65 - 71 of this report.
21
EQUITY RESEARCH
India | Pharmaceuticals
22. Exhibit 53 - Infusions are the most popular injectables delivery
form
.
81
138
67
131
77
97
42
66
0
100
200
300
400
500
2014 2019
Global Injectables: Segmentation by Delivery Form CY14-19
(US bn)
Infusions Pre-filed Syringes Vials Others
Source: IQVIA, Jefferies. MAT September 2014-19
Exhibit 54 - PFS are clocking the best growth among various
injectable formats
.
4.6%
9.7%
11.1%
14.5%
0.0% 5.0% 10.0% 15.0% 20.0%
Vials
Others
Infusions
Pre-filed Syringes
Global Injectables: CAGR 2014-2019
Source: IQVIA, Jefferies. MAT September 2014-19
Exhibit 55 - Infusions saw some price decline, but volume growth was healthy
.
Volume Growth (%) Price Growth (%)
Infusions 13% -1%
Pre-filed Syringes 11% 3%
Vials 4% 1%
Source: IQVIA, Jefferies. MAT September 2014-19
Exhibit 56 - US generic injectables to more than double in 5
years
.
97 186 377
24
44
92
121
230
469
0
100
200
300
400
500
2014 2019 2024
United States Injectables Pharmaceutical Market, CY14-19
(US bn)
Innovators Generics Total
Source: IQVIA, Jefferies. MAT September 2014-19. 2024 is forecast for
MAT September 2024, based on MAT data until September 2019
Exhibit 57 - Many therapies saw mid- to high-teens growth in US
injectables space
.
2.9%
8.0%
8.1%
15.5%
16.4%
17.1%
0% 5% 10% 15% 20%
Blood related
Nervous system
Systemic Anti-infectives
Alimentary Tract + Metabolic
Antineo + Immuno*
Musculoskeletal
US Injectable Pharmaceutical CAGR CY14-2019
Source: IQVIA, Jefferies. MAT September 2014-19. Immuno =
Immunomodulators
Exhibit 58 - China Pharma market expected to grow at 5% CAGR
during 2019-24
.
65
92
116
0
20
40
60
80
100
120
140
2014 2019 2024
China Overall Pharma Market (USD bn)
Source: IQVIA, Jefferies. MAT September 2014-19. 2024 is forecast for
MAT September 2024, based on MAT data until September 2019
Exhibit 59 - Injectables to grow in line with the market
.
39
49
21
33
6
10
0
20
40
60
80
100
2014 2019
China Pharma Market (USD bn)
Injectables Oral Solids Others
Source: IQVIA, Jefferies. MAT September 2014-19. 2024 is forecast for
MAT September 2024, based on MAT data until September 2019
4 January 2022
Please see important disclosure information on pages 65 - 71 of this report.
22
EQUITY RESEARCH
India | Pharmaceuticals
23. Exhibit 60 - China NCEs to see faster injectable adoption vs
generics
.
30 34
9
15
0
10
20
30
40
50
60
2014 2019
China Injectable Pharma Market (USD bn)
Generics Innovator
Source: IQVIA, Jefferies. MAT September 2014-19. 2024 is forecast for
MAT September 2024, based on MAT data until September 2019
4 January 2022
Please see important disclosure information on pages 65 - 71 of this report.
23
EQUITY RESEARCH
India | Pharmaceuticals
24. ARV Market: Dolutegravir regimens are the future
Moving from 90-90-90 to 95-95-95
The year 2020 marked the end of UN’s 90-90-90 target period according to which the
world had to reach the following goals: 90% of people with HIV would have known their
status, 90% of people with HIV who know their status would be on ART (Anti-retroviral
therapy), and 90% of those who are on ART would be virally suppressed. By 2020, global
community reached 84-87-90 instead of 90-90-90, missing the target on two of the three
goals. Though the targets were missed, from 2001 to date, about 16.2m deaths have
been averted due to ART. The UN has now adopted a 95-95-95 target for 2025, and, if the
target is achieved, new infections would come down to just 370k from 1.5m currently.
The target appears tough to achieve, but a sustained effort would definitely help to
reduce the new infections.
Globally, there are 37.7m people living with HIV (PLHIV), and 95% of them are adults
while the other 5% are children. Of the adults with HIV, 27.5m were on treatment, and
among children 920k were on ART. By 2020, ART global coverage had reached 73%.
By 2020, global Anti-Retroviral treatment
coverage reached 73%
Exhibit 61 - Globally, 37.7m people are living with HIV (PLHIV)
.
36 1.7
20 22 24 26 28 30 32 34 36 38 40
People Living with HIV (mn)
Adults Children
Source: Clinton Health Access Initiative Report 2021, Jefferies
Exhibit 62 - Of 37.7m PLHIV, 27.5m are under Anti-retroviral therapy
.
26.6 0.9
20 21 22 23 24 25 26 27 28
People on Treatment (mn)
Adults Children
Source: Clinton Health Access Initiative Report 2021, Jefferies Report 2021, Jefferies
4 January 2022
Please see important disclosure information on pages 65 - 71 of this report.
24
EQUITY RESEARCH
India | Pharmaceuticals
25. Exhibit 63 - 73% of PLHIV are under ART
.
Global Treatment
coverage
73%
Global treatment coverage (2020)
Source: Clinton Health Access Initiative Report 2021, Jefferies
Exhibit 64 - Global community missed 2020's 90-90-90 target
.
84% 87% 90%
0%
20%
40%
60%
80%
100%
PLHIV with known
status
Known status on ART On ART are now
virally supressed
Global 90s Progress at the End of 2020
Source: Clinton Health Access Initiative Report 2021, Jefferies
Exhibit 65 - ARV market for GA LMIC is USD1.9bn
.
1.6
1.7 1.7 1.7
1.9
0.0
0.5
1.0
1.5
2.0
2016 2017 2018 2019 2020
ARV market size for GA LMIC (USD bn)
Source: Clinton Health Access Initiative Report 2021, Jefferies. GA LMIC
- Generic accessible low- and middle-income countries
Treatment costs have come down, allaying pandemic-caused fears
It was feared that lockdowns and supply-chain disruptions that started in 2020 would
increase HIV commodity prices; however, these fears have turned out to be incorrect.
Between 2019 and 2020, 1L adult treatment costs in generic-accessible (GA). Lower- and
middle-Income countries (LMIC), ex-South Africa, came down by USD4 per year due to a
drop in price of TLD and a shift from more expensive treatment. 2L costs also declined,
as both DTG-based and ATV/r gained market share over LPV/r in treatment. Paediatric
treatment costs rose due to patient switch to more expensive LPV/r regiments. But
paediatric treatment costs are set to decline with the new DTG 10mg tablet. CHAI
estimates that the GA-LMIC ARV market as of 2020 stood at USD1.9bn, and the majority
of the market belonged to the DTG-based drugs.
Treatment costs have come down due to
Dolutegravir-based treatment
4 January 2022
Please see important disclosure information on pages 65 - 71 of this report.
25
EQUITY RESEARCH
India | Pharmaceuticals
26. Exhibit 66 - 2020 new infections were ~3x the target, 2025
target difficult to achieve
.
1.8 1.8
1.7 1.7
1.5
0.37
0.0
0.5
1.0
1.5
2.0
2016 2017 2018 2019 2020 2025
Target
HIV New infections (Mn)
Source: Clinton Health Access Initiative Report 2021, Jefferies
Exhibit 67 - Adult treatment cost has declined due to DTG-based
regimens
.
73
227
152
70
232
149
66
227
204
0
50
100
150
200
250
1L Adults 2L Adults Peds (1L & 2L)
Weighted Avg. GA LMIC Regimen Prices (USD)
2019 2019 (Ex-RSA) 2020 (Ex-RSA)
Source: Clinton Health Access Initiative Report 2021, Jefferies
Lot of work still needs to be done
The new AIDS infection rate has remained stubbornly high for the past few years, and
2020’s new infections of 1.5m were almost 3x the target. The positivity rate at AIDS
Healthcare Facilities was 3.5% in 2020, the highest in the past five years. There were
more than 680k AIDS-related deaths in the past year, which was just a 6% decline from
2019. ART coverage has continuously increased in the past decade, but deaths have
been a cause of worry, where children have accounted for disproportionate share of
deaths. This calls for increased focused and regimen changes in the children group.
DTG-based regimen’s penetration has remained low for children vs adults. Increased
penetration of the DTG regimen in coming years should improve the numbers for
children, and the affordability of the medicine should drive higher adoption.
ART coverage has continuously
increased in the past decade, but
deaths have been a cause of worry,
where children have accounted for
disproportionate share of deaths
Exhibit 68 - AIDS positivity rate has crept up in recent years
.
2.8%
3.0% 3.0% 3.1%
3.5% 3.5%
0.0%
0.5%
1.0%
1.5%
2.0%
2.5%
3.0%
3.5%
4.0%
2016 2017 2018 2019 2020 Jan-May
21
AIDS Healthcare Facilities Positivity rate
Source: Clinton Health Access Initiative Report 2021, Jefferies
Exhibit 69 - Children have disproportionate share in deaths
associated with AIDS
.
95%
85%
5%
15%
0%
20%
40%
60%
80%
100%
PLHIV Deaths
PLHIV and AIDS-Related Deaths in 2020 by Age Group
Adults (15+) Children (0-14)
Source: Clinton Health Access Initiative Report 2021, Jefferies
4 January 2022
Please see important disclosure information on pages 65 - 71 of this report.
26
EQUITY RESEARCH
India | Pharmaceuticals
27. Exhibit 70 - ART coverage is continuously increasing
.
49%
55%
61%
64%
70%
75%
0%
10%
20%
30%
40%
50%
60%
70%
80%
2015 2016 2017 2018 2019 2020
GA LMIC Adult ART Coverage
Source: Clinton Health Access Initiative Report 2021, Jefferies
Treating right crucial in the fight
There were more than 2m adults initiated on ART in 2020, despite COVID-19. In GA-
LMIC, ART coverage touched 75%, up 500bps YoY. In 2018, WHO released new interim
guidelines recommending DTG-based regimens as the most preferred in both 1L and 2L
for all population. USFDA gave tentative approval to the first generic product in 2017,
and since then more than 350m 30-pack equivalent TLD (Tenofovir + Lamivudine +
Dolutegravir) have been procured. As of 2020, 67% of the adult population living with HIV
was on DTG-based 1L treatment, and CHAI (Clinton Health Access Initiative) estimates
that by 2023 this will increase to 94%. DTG-based regimens have proven to have higher
clinical benefits over Nevirapine and Efavirenz and are more cost-effective. Current
WHO guidelines recommend viral load (VL) testing prior to transitioning to DTG-based
regimen for 2L, but several nations are switching to DTG from protease inhibitors (PIs).
A 96-week NADIA study in three African nations found that DTG is non-inferior to DRV/r
(Darunavir/Ritonavir), suggesting a strong use case of DTG-based regimen even in 2L.
DRV/r, though, is thought more like a 3L, but its use in 2L has benefits over LPV/r
(Lopinavir/Ritonavir) in terms of higher efficacy, which reduces the number patients who
reach the hard-to-procure 3L products. Moreover, DRVs have the potential to be reused
in 3L, due to high genetic barrier resistance. Thus, the future for 2L seems to be DTG >
DRV > LPV. As of 2020, only 8% of the 1.2m adults on 2L used DTG, and, in our view, the
figure is likely to increase in the future.
The future for 2L Antiretroviral treatment
seems to be DTG > DRV > LPV
Exhibit 71 - DTG-based regimen to gain further share in first line of treatment
.
13% 5% 2%
85%
66%
31%
14% 8%
6%
6% 6%
2%
29%
67%
86% 92% 94% 94% 94%
0%
20%
40%
60%
80%
100%
2018 2019 2020 2021E 2022E 2023E 2024E 2025E
1L Adult INSTI/NNRTI Use in GA LMICs, Growth and Share (Includes Use as FDC
and Singles)
NVP EFV DTG
Source: Clinton Health Access Initiative Report 2021, Jefferies
4 January 2022
Please see important disclosure information on pages 65 - 71 of this report.
27
EQUITY RESEARCH
India | Pharmaceuticals
28. Exhibit 72 - By 2025, CHAI expects 23.5m adults on first-line treatment
.
14.5
16.4 17.1
18.6
20.3 21.2 22.1 22.5 23.1 23.5
11%
13%
4%
9% 9%
4% 4%
2%
3%
2%
0%
2%
4%
6%
8%
10%
12%
14%
0
5
10
15
20
25
2016 2017 2018 2019 2020 2021E 2022E 2023E 2024E 2025E
1L Adults on ART % YoY Growth
Source: Clinton Health Access Initiative Report 2021, Jefferies
Exhibit 73 - DTG penetration in second-line treatment is
increasing
.
94%
79%
47%
6%
21%
44%
8%
0%
20%
40%
60%
80%
100%
2012 2016 2020
Adult 2L PI/INSTI Market Share in GA LMIC
LPV/r ATV/r DTG
Source: Clinton Health Access Initiative Report 2021, Jefferies
ARV procurement tenders: Simple, fair, and equitable
In GA LMIC, HIV-associated drugs are procured through government tender programs or
WHO tenders. Funding for these drugs is through a mix of domestic and donations from
US President’s Emergency plan for AIDS Relief (PEPFAR), The Global Fund, UNICEF, and
UNDP. In a typical year, domestic funding accounts for ~55% of HIV-related resources,
while the rest is via international donations. The three largest buyers of ARV drugs in
the GA-LMIC region are PEPFAR, The GlobalFund, and Health Department, Republic of
South Africa. In ARV formulations, the tenders are not awarded 100% to the lowest
bidder and, thus, there is no winner-take-all scenario. The distribution is across the L1,
L2, L3, and L4, and certain volumes are assigned for new entrants as well. The maximum
amount a player can reach is 40%. The system has been designed in such a way that
drug procurement is cheap and avoids oligopoly but, at the same time, gives a fair share
of the market to various players. Major firms in the generic ARV market in LMIC are
Laurus Labs, Cipla, Aurobindo, Hetero, and Mylan.
4 January 2022
Please see important disclosure information on pages 65 - 71 of this report.
28
EQUITY RESEARCH
India | Pharmaceuticals
29. Exhibit 74 - Major Players in generic ARV market
.
Firm FY21 ARV revenue (USDm)
Laurus 428
Cipla 255
Aurobindo 248
Strides 52
Mylan* ~1000
Source: Company data, Jefferies. Mylan data is for CY20. Revenue
includes both formulations and API.
Multi-Month Dispensations are the way forward
Due to the Covid pandemic and associated lockdown and disruption, there was a
need to adopt new models to continue ART for HIV patients. To counter the drug
procurement issue, Multi-Month Dispensation (MMD) was adopted. Updated WHO
guidelines recommend that everyone with HIV and on ART should be shifted to refills
of 90/180 count packs. In Malawi and Zambia, INTERVAL trial results showed that ARV
180-count packs resulted in better retention and lower costs than 90-count refills. In
2020, 78% of the procurement by ARV Procurement Working Group was for 90-count
refills. Due to this change, ARV drug providers such as Laurus saw higher uptick of
products in 2020, while in 2021 there was a slowdown as global inventories of 30-count
packs were being used up completely to move to 90-/180-count packs.
Updated WHO guidelines recommend
that everyone with HIV and on ART
should be shifted to refills of 90/180
count packs
Exhibit 75 - Multi-month dispensation results in lower treatment
costs
.
87
132
86
134
85
128
0
50
100
150
Malawai Zambia
Provider Cost Per Patient in INTERVAL Trial
SOC 3MD 6MD
Source: Clinton Health Access Initiative Report 2021, Jefferies
Exhibit 76 - 90-count pack is now the dominant packet size
.
100%
44%
21%
56%
78%
1% 1%
0%
20%
40%
60%
80%
100%
2018 2019 2020
APWG ARV Procurement Working Group
30 Pack 90 Pack 180 Pack
Source: Clinton Health Access Initiative Report 2021, Jefferies
4 January 2022
Please see important disclosure information on pages 65 - 71 of this report.
29
EQUITY RESEARCH
India | Pharmaceuticals
30. Exhibit 77 - DTG-based regimen is increasing for pediatric
treatments
.
4%
18%
25%
35%
53%
32%
33%
19%
43%
28%
10%
0%
20%
40%
60%
80%
100%
2018 2019 2020
Estimated Pediatric NNRTI/PI/INSTI Use in GA LMICs
DTG LPV/r EFV NVP
Source: Clinton Health Access Initiative Report 2021, Jefferies
Exhibit 78 - Dolutegravir is associated with higher life
expectancy, per CEPAC modelling study
.
39.4 39.0
33.1
0
10
20
30
40
50
DTG without VL
Testing
DTG with VL Testing No DTG
Impact of DTG and VL Testing on Child Life Expectancy in
CEPAC Modelling Study
Source: Clinton Health Access Initiative Report 2021, Jefferies. CEPAC -
Cost-Effectiveness of Preventing AIDS Complications
Exhibit 79 - Several firms are WHO pre-qualified for TLD
(Tenofovir Disoproxil, Lamivudine, Dolutegravir)
.
Tentative US FDA WHO PQ
Aurobindo Cipla
Celltrion Hetero
Hetero Laurus
Laurus Macleods
Macleods Mylan
Mylan Strides
Sun Pharma
US FDA TLD Approvals/WHO prequalification
Source: Clinton Health Access Initiative Report 2021, Jefferies
4 January 2022
Please see important disclosure information on pages 65 - 71 of this report.
30
EQUITY RESEARCH
India | Pharmaceuticals
31. Exhibit 80 - ARV benchmark price comparison list
.
Adult Products Pack Size Global Fund PPM Price (Mar-
21)
GHSC-PSM E-Catalog
Price(Sep-21)
RSA Weighted Average
Tender Price 2019-22
ABC/3TC (600/300 mg) 30 tablets 8.78 8.90 7.60
ATV/r (300/100 mg) 30 tablets 13.45 13.47
AZT/3TC (300/150 mg) 60 tablets 5.55 6.05 4.85
DTG (50 mg) 30 tablets 2.60 2.48 2.38
DTG (50 mg) 90 tablets 8.08
EFV (600 mg) 30 tablets 2.50 2.32
LPV/r (200/50 mg) 120 tablets 18.65 18.65 11.69
NVP (200 mg) 60 tablets 1.85
RTV (100 mg) heat-stable 60 tablets 7.00 7.00 3.25
TDF (300 mg) 30 tablets 2.40 2.40 2.07
TDF/3TC (300/300 mg) 30 tablets 3.40 3.20
TDF/FTC (300/200 mg) 30 tablets 4.35 4.65 3.08
TDF/3TC/DTG (300/300/50 mg) No Carton 30 tablets 5.15 4.82
TDF/3TC/DTG (300/300/50 mg) No Carton 90 tablets 15.25 15.25
TDF/3TC/DTG (300/300/50 mg) No Carton 180 tablets 30.50 30.29
TDF/3TC/EFV (300/300/400 mg) No Carton 30 tablets 5.25
TDF/3TC/EFV (300/300/400 mg) No Carton 90 tablets 16.60 15.85
TDF/3TC/EFV (300/300/600 mg) No Carton 30 tablets 5.65
TDF/FTC/EFV (300/200/600 mg) No Carton 30 tablets 6.10 5.11
Pediatric Products
Optimal Formulary
ABC/3TC (120/60 mg) disp. scored 30 tablets $3.10 $3.10
ABC/3TC (120/60 mg) disp. scored 60 tablets $6.05
AZT (50/5 mg/ml) oral solution 240 mL bottle
AZT/3TC (60/30 mg) disp. scored 60 tablets $1.90 $1.80
DTG (10 mg) disp. scored 90 tablets $4.50 $4.50
LPV/r (100/25 mg) heat-stable 60 tablets $6.50 $6.50 $3.71
LPV/r (40/10 mg) oral granules 120 satchets $17.25 $18.25
NVP (50/5 mg/ml) oral solution (with syringe) 100 mL bottle $2.00 $2.00 $0.73
Limited-Use List
3TC (50/5 mg/ml) oral solution 240 mL $3.02 $1.06
DRV (75 mg) 480 tablets $54.00 $43.35
DRV (150 mg) 240 tablets $37.86
LPV/r (40/10 mg) oral pellets 120 capsules $17.25 $16.45
NVP (50 mg) disp. scored 60 tablets $1.45 $1.45
RAL (100 mg) granules 60 sachets $57.00
RTV (25 mg) heat-stable 30 tablets $3.25
The table below provides per pack or bottle prices (US $) for key adult and pediatric ARVs. Prices are Ex-Works (EXW).
Source: Clinton Health Access Initiative Report 2021, Jefferies
1) Global Fund Pooled Procurement Mechanism Reference Pricing: ARVs, Mar. 22, 2021.
2) Global Health Supply Chain – Procurement and Supply Management (GHSC-PSM) E-Catalog: ARVs, September 2021.
3) Republic of South Africa 2019-2022 Tender, weighted-average price across awarded suppliers, 1 USD = 14.35 ZAR exchange rate used per
US Treasury Dept. as of Dec 31, 2018 effective at tender adjudication; Supplementary Tender Feb 2020, weighted-average price across awarded
suppliers, 1 USD = 15.57 ZAR exchange rate used per US Treasury Dept. as of Dec 31, 2019; Ex-Works prices have been calculated by removing
15% VAT and 5% in shipping; prices subject to forex-based adjustments; some pack sizes differ slightly from those listed above, see tender for full
details.
4 January 2022
Please see important disclosure information on pages 65 - 71 of this report.
31
EQUITY RESEARCH
India | Pharmaceuticals
32. Exhibit 81 - 2021 Optimal Formulary Use list
.
Drug Dosage Form Strength Rationale for Use Pack Size
DTG Tablet (dispersible, scored) 10 mg For first-line or second-line ART for infants and children
who are > 4 weeks of age and weighing 3 to <20 kg
90-count pack
ABC + 3TC Tablet (dispersible, scored) 120 mg/60 mg For preferred first-line or second-line ART for infants
and children weighing 3-25 kg
30- and 60-count packs
AZT2 Oral Solution 50 mg/5 mL For postnatal prophylaxis and neonatal treatment only 240 mL bottle
NVP Oral Solution 50 mg/5 mL For postnatal prophylaxis and neonatal treatment only 100 mL bottle
LPV/r Tablet (heat stable) 100 mg/25 mg For alternative first-line or second-line ART for children
weighing >10 kg and who are able to swallow tablets
whole
60-count pack
LPV/r Oral granules 40 mg/10 mg For alternative first-line or second-line ART for children
weighing <10 kg and who are unable to swallow 100
mg/25 mg tablets whole
120-count pack
AZT + 3TC Tablet (dispersible, scored) 60 mg/30 mg For second-line ART for infants and children weighing 3-
25 kg
60-count pack
Source: Clinton Health Access Initiative Report 2021, Jefferies
Exhibit 82 - 2021 Limited Use list
.
Drug Dosage Form Strength Rationale for Use Pack Size
NVP Tablet (dispersible, scored) 50 mg Only for postnatal prophylaxis when NVP oral solution is
not availabl
60-count pack
3TC Oral Solution 50 mg/5 mL Only for treating neonates 240-mL bottle
RAL Granules for suspension 100 mg Only for treating neonates 60-count pack
LPV/r Oral pellets 40 mg/10 mg For specific circumstances in which DTG 10 mg
dispersible, scored tablets or LPV/r oral granules are not
available or clinically indicated
120-count pack
DRV Tablet 75 mg, 150 mg For third-line ART regimens for children
3 years and older
480- and 240-count packs
RTV Tablet 25 mg For superboosting of LPV/r during TB treatment and
required for use when administering DRV
60-count pack
Source: Clinton Health Access Initiative Report 2021, Jefferies
4 January 2022
Please see important disclosure information on pages 65 - 71 of this report.
32
EQUITY RESEARCH
India | Pharmaceuticals
33. CDMO opportunity - Large space with high growth
potential
Sizing the market opportunity
Of the USD205bn R&D spend in 2020, over USD65bn was outsourced to CROs. On the
manufacturing end, USD58bn worth manufacturing (small molecule, CGT, and biologics)
was transferred to CDMOs. For CROs, clinical management is the biggest piece of the
pie, accounting for 64% of the USD65bn opportunity. The next-largest business pie is
presented by small-molecule CDMO/CMO, which is currently worth USD38bn. Among
all the business segments in Cell and Gene Therapy, CDMO is expected to grow at
the fastest pace of 26% CAGR during 2020-30. Discovery services/Preclinical studies/
Clinical trials/Small Molecule CDMO markets are expected to grow at 13%/10%/9%/8%.
CDMO (Contract Development &
Manufacturing Organization) - Provides
mass manufacturing and process
development capabilitiesCRO (Contract
Research Organization) - Helps
innovators in research to develop novel
molecules
Exhibit 83 - Ex-Biologics, CRO/CDMO market to grow at 10% CAGR
.
9.4 10.2 11.5 12.9 14.1 15.8 18.0 20.7 24.2 27.7 31.2 34.9 38.8 42.7 46.9
7.1 7.7 8.4 9.1 9.5 10.7 11.9 13.1 14.4 15.8 17.2 18.7 20.3 21.9 23.6
32.4 34.6 37.9 40.6 41.8 45.7
50.1
54.9
60.2
65.9
72.0
78.5
85.0
91.6
98.4
1.0 1.2
1.5 1.9 2.3
2.9
3.9
5.6
7.7
10.1
12.6
15.2
17.8
20.5
23.4
25.9 28.2
31.3
33.8 37.5
42.0
46.9
51.6
56.3
60.6
64.8
69.0
73.2
77.6
82.2
75.8
81.9
90.6
98.3
105.2
117.1
130.8
145.9
162.8
180.1
197.8
216.3
235.1
254.3
274.5
-25
25
75
125
175
225
275
2016 2017 2018 2019 2020 2021E 2022E 2023E 2024E 2025E 2026E 2027E 2028E 2029E 2030E
Global Pharmaceutical R&D Outsourcing Market Size (USD bn)
Discovery Preclinical Clinical CGT CMO/CDMO Small molecule CDO/CDMO
Source: Frost & Sullivan, Jefferies
Exhibit 84 - Cell and Gene therapy (CGT) to clock fastest growth on low base, all other
segments to clock double-digit growth over next five years
.
10%
7% 7%
22%
10% 9%
15%
11% 10%
35%
10% 11%
11%
8% 8%
18%
6%
9%
0%
10%
20%
30%
40%
Discovery Preclinical Clinical CGT CDMO Small Molecule Total
Growth CAGR (%)
2016-20 2020-25E 2025-30E
Source: Frost & Sullivan, Jefferies
4 January 2022
Please see important disclosure information on pages 65 - 71 of this report.
33
EQUITY RESEARCH
India | Pharmaceuticals
34. Biologics – an area yet to reach its full potential
Biologic drugs have picked up steam in the last decade and are seeing high interest
from all the key pharma stakeholders – Big Pharma, innovators, private equity players.
Biologics are large molecules derived from organic sources/living organisms and use
antibodies, antibody drug conjugates ADC, mRNA, sugars, protein, DNA, cells, and
tissues for drug development. Developing these large molecules is typically more
complex than developing small-molecule drugs and requires specialized providers. In
the US, 25-30% of new drugs approved are biologics, and among the top 100 blockbuster
drugs globally (by sales), 42 have biologic origins while 58 are chemical drugs. These
42 biologics drugs represented 49% of the total revenues of the top 100 drugs. Global
biotech funding hit an all-time high in 2020 and, increasingly, even small and medium
pharma firms backed by investors are foraying in biologics. Biosimilars are the generic
version of biologics, but unlike most generics, biosimilars need to conduct clinical trials.
Due to the trial requirement, biosimilars R&D is more expensive than chemical origin
generics.
In the US, 25-30% of new drugs approved
are biologics, and among the top 100
blockbuster drugs globally (by sales), 42
have biologic origins
Exhibit 85 - Global Biotech funding reached record levels in recent quarters
.
Source: Pitchbook, Jefferies
Exhibit 86 - USFDA molecule approval has increased, and a consistently high number
of biologics are getting the nod
.
12
7
12
17
10
13
33
15
34
42
38 40
0
10
20
30
40
50
2015 2016 2017 2018 2019 2020
Number of FDA NME & Original BLA Approvals
BLA NME
Source: Frost & Sullivan, Jefferies
The higher R&D efforts on biologics and better approval rate are clearly reflected in
global pharma sales, where the share of biologics drugs has increased from 19% in
2016 to 23% in 2020 and is expected to hit 31% by 2025. Biologics should continue
to be the driver of the global pharma market, with sales (biologics) reaching a CAGR
of 12% during 2020-25, while small-molecule drug sales should grow at a mere 3.4%
CAGR. The growing popularity of biologics R&D with the innovators is a result of the
declining approval rates and profitability of chemical therapies. Another key advantage
for biologics is their targeted effects in the body, thereby overcoming some constraints
Key advantage for biologics is their
targeted effects in the body, thereby
overcoming some constraints of small-
molecule therapies
4 January 2022
Please see important disclosure information on pages 65 - 71 of this report.
34
EQUITY RESEARCH
India | Pharmaceuticals
35. of small-molecule therapies. The success of biologics in areas such as oncology has
invigorated biologic drug development. Biologics is still evolving with new-age tech,
such as cell and gene therapy and CAR-T cell therapy, and has yet to show their full
potential.
Exhibit 87 - Biologics share in pharma market expected to rise from 23% to 31% by
2025, riding on 12% CAGR
.
933 969 1,006 1,038 1,001 1,057 1,098 1,132 1,159 1,181
220 240 261 286 298 337 379 425 476 530
1,153 1,208 1,267 1,324 1,299
1,393 1,477 1,556 1,635 1,711
0
500
1,000
1,500
2,000
2016 2017 2018 2019 2020 2021E 2022E 2023E 2024E 2025E
Global Pharma Market (USD bn)
Chemical drugs Biologics
Source: Frost & Sullivan, Jefferies
Global R&D spending is being increasingly directed toward biologics given their success
in various therapy areas as well as emerging potential. Per our estimate, about 23%
of global R&D went into biologics in 2020, which is expected to increase further going
forward. The global CDMO market has also benefited with the rise of biologics, and the
business from biologics doubled from USD9bn in 2016 to USD18bn in 2020. The traction
in biologics is expected to continue, and the CDMO biologics market is estimated to
clock 21% CAGR in the next 5 years. The biologics business is likely to help double the
current CDMO global market by 2025. Small-molecule CDMOs are also forecast to show
healthy business growth of 10% in the coming 5 years.
The traction in biologics is expected
to continue, and the CDMO biologics
market is estimated to clock 21% CAGR
in the next 5 years
Exhibit 88 - Biologics now account for 23% of global R&D spend
.
122 127 132 138 143 158 172 184
27 30 33 36 39
46
52
58
150 157 165 174 182
205
224
242
0
50
100
150
200
250
2015 2016 2017 2018 2019 2020 2021E 2022E
Global R&D spending (USD bn)
Chemical Drug Biologics
Source: Frost & Sullivan, Jefferies
4 January 2022
Please see important disclosure information on pages 65 - 71 of this report.
35
EQUITY RESEARCH
India | Pharmaceuticals
36. Exhibit 89 - Biologics CDMO market expected to see significant CAGR of 21% in the
next 5 years
.
26 28 31 34 38 42 47 52 56 61
9 11 13 15 18 22
26
32
39
46
35 39 45 49 56
64
73
84
95
107
0
50
100
150
2016 2017 2018 2019 2020 2021E 2022E 2023E 2024E 2025E
Breakdown of Global CDMO Market
Chemical drugs Biologics
Source: Frost & Sullivan, Jefferies
CRO/CDMO - High growth & fragmented sector
There has been a definitive trend of outsourcing pharma work to CRO/CDMOs. In 2020,
42% of Pharma R&D/Manufacturing was outsourced, up sharply from 35% in 2016. The
share of outsourced work is expected to continue growing in the future. This bodes
well for outsourcing companies. CDMO or third-party manufacturing and development
firms are concentrated in the EU area for historical reasons. Indian companies operating
in the pharma outsourcing space, such as Divi's and Syngene, have a strong CDMO
component. The Indian generics industry has given rise to a pharma manufacturing
and development ecosystem that should position Indian CDMOs at an advantage going
forward. As European CDMOs deploy incremental capital into biological manufacturing,
Indian companies are well positioned to tap into small-molecule CDMO business.
CROs have shown their value to pharma companies in shortening time to development.
Equally important, CROs/CDMOs are developing areas of skill/expertise that even
Big Pharma companies are finding difficult to retain in-house. Small-molecule
manufacturing is one such capability. As global pharma companies have increasingly
focused on biologics R&D, they have divested/closed small-molecule manufacturing.
European CDMOs are aligning themselves with the emerging requirements of Big
Pharma; therefore, few new small-molecule manufacturing is coming up, largely in Asia.
Divi's and Syngene and certain other privately held players, such as GVK Bio and Anthem
Bio in India, expect to benefit from the move of small-molecule CDMO capabilities to
India.
In 2020, 42% of Pharma R&D/
Manufacturing was outsourced, up from
sharply 35% in 2016
Within the biologics CRO/CDMO space, certain large players have emerged globally.
These players have gained further traction in the past two years, due to Covid vaccine
contracts and record years of fund-raising for Emerging Pharma and Biotech. Many of
these players, such as Wuxi Biotech, Catalent, and Lonza, have committed to increased
capex in biologics capacity. Indian CDMO/CRO, except for Syngene and Gland Pharma,
have typically shied away from biologics manufacturing due to lack of technical know-
how, requirement of large upfront capex, and absence of a local biologics market.
Syngene has invested USD50mn in biologics manufacturing, partly driven by the benefit
of parentage of Biocon, which started as an industrial enzymes company and is a leading
biosimilars manufacturer today. Gland Pharma acquired biologics capacity (10Kl) with
its acquisition of Vitane Biologics and is incurring INR3bn in capex to expand by another
10Kl.
Indian CDMO/CRO barring Syngene,
Gland Pharma have typically shied away
from biologics manufacturing due to lack
of technical know-how, requirement of
large upfront capex as well as absence of
a local biologics market
The number of ongoing clinical trials tripled during 2016-2020. The increase has been
across the board, from Phase 1 to Phase 4. Covid has provided a further boost to
drug R&D, with several vaccine and medicine candidates being tested for treatment
4 January 2022
Please see important disclosure information on pages 65 - 71 of this report.
36
EQUITY RESEARCH
India | Pharmaceuticals
37. of Covid-19. The US still accounts for more than half the global clinical CRO market,
as regulators typically prefer the major part of human studies to be conducted in the
local population. China is emerging as an important hub, with total clinical CRO revenue
more than tripling during 2015-2020. The Indian clinical CRO market is relatively small
because the local market is primarily a generics market. Further, Indian regulations
forbid Phase 1 "first in world" studies if the drug is not developed in India. The recent
launch of locally developed Covid vaccines, namely Covaxin by Bharat Biotech and
Zycov-D by Cadila, could spur the clinical trial landscape in India.
"Preclinical Research" is an umbrella term for a variety of studies conducted before
human or clinical studies kick in for a drug candidate. The objective of these studies
is to filter out 1-2 potential drug candidates from thousands of starting molecules.
This selection is on the basis of multiple studies to determine preliminary efficacy
and safety, among other factors. There are several specialized service providers for
various components of preclinical studies. Indian preclinical CROs started by offering
small-scale chemistry services, given adequate availability of chemistry skills in India.
However, they have gradually added other offerings to provide a more wholesome
preclinical bouquet. Chinese CROs have evolved in similar manner but have also used
M&A to offer preclinical services in Western geographies closer to the clients. Chinese
CROs also benefit greatly from a large local innovative R&D market.
The Indian clinical CRO market is
relatively small because the local market
is primarily a generics market
Exhibit 90 - Only 1% of CDMOs generate annual revenue above
USD500m...
.
USD <12m
35%
USD 13-24m
31%
USD 25-49m
15%
USD 50-99m 10%
USD 100-249m 5%
USD 250-499m 3% USD > 500m 1%
No of CDMO % by revenue
Source: PharmSource Trend Report 2020, Jefferies
Exhibit 91 - ...but they account for 31% of market share
.
USD > 500m
31%
USD 250-
499m
17%
USD 100-
249m
15%
USD 50-99m
13%
USD 13-24m
10%
USD 25-49m
10%
USD <12m 4%
Market Share by revenue
Source: PharmSource Trend Report 2020, Jefferies
Exhibit 92 - 52% of CDMOs are located in EU, 22% in North
America
.
Regional:Europe
52%
Regional:North America
22%
Global
21%
Regional:Japan 3% Regional:RoW 2%
Geographical footprint of CDMOs
Source: PharmSource Trend Report 2020, Jefferies
Exhibit 93 - Global biologics CRO/CDMO market by revenue.
.
Lonza
7% BI Bio 7%
Wuxi Biologics 5%
Catalent 5%
Samsung Biologics 3%
AGC Biologics 2%
Thermo Fisher
2%
Others
69%
Global biologics CRO market (2019)
Source: Frost & Sullivan. BI - Boehringer Ingelheim
4 January 2022
Please see important disclosure information on pages 65 - 71 of this report.
37
EQUITY RESEARCH
India | Pharmaceuticals
38. Gland Pharma
Gland Pharma is an injectables-focused B2B player that derives two-thirds of its
revenue from the US market. The company is promoted by Fosun Pharma, a China-
based player with a large global presence. The company’s revenue sources include not
just sales of products but also profit share and licensing fees. Gland has achieved
economies of scale in the injectables space and operates as a low-cost injectables
formulation manufacturer. Globally, the company has 1,501 products registered across
60 countries. We estimate Gland's US growth to come from volume growth and new
product launches, RoW markets will benefit from Pashamylaram capacities, while China
expansion will occur using Fosun's network. We expect Gland revenue/EBITDA/EPS
CAGRs at 27%/26%/26%. We value Gland Pharma at 36.5x FY24E EPS, with price target
of INR4,556. We rate Gland Pharma, our Top Pick in the sector, Buy.
Resilient business model: Gland Pharma is a B2B player that has built its expertise
over several decades in the difficult-to-master injectables space. This razor-sharp focus
on injectables has allowed it to be a highly cost-competitive manufacturer in the
injectables space. The company has a pristine track record on USFDA audits to date,
and maintaining such compliance for injectables facilities is in itself a differentiator. As
a B2B player, Gland does not face the pricing pressure that other Indian generic firms
do and has reasonable capabilities to pass on cost pressure, if it were to emerge.
As a B2B player, Gland does not face
the pricing pressure that other Indian
generics firms do, and can pass on cost
pressure
Triple-engine growth story: Gland Pharma generates ~67-68% of its revenue from
the US, where it has commercialized products worth USD7.5bn. As an injectables
specialist and a contract manufacturer, it benefits from economies of scale. Indeed,
manufacturing costs have come down to the extent that many firms discontinue
manufacturing in-house and outsource it to Gland Pharma because of the lower costs.
Even its legacy products clock high-teens growth, while it has a strong pipeline of new
launches that could add high-single-digit growth for the company. The largest products
in the US are Enoxaparin and Mycafungin. Gland has pending ANDAs and tentative
approvals for products worth USD7.5bn. From the vast array of complex injectables,
Gland has narrowed the number down to 17 products, of which 4 will be filed this year.
Another major growth driver for Gland is the RoW market, where it has registered several
products in various countries but could not launch due to capacities being filled for
US. With Pashamylaram, Gland has enough capacity to foray deeper in various markets
across the globe. It can leverage its relationship with its promoter, Fosun, to penetrate
in Mexico, as Fosun has a large network presence there. Gland Pharma expects RoW
market revenue contribution to reach 30-40% in the next 3-4 years, and the region is
currently growing at the fastest pace for the company.
Large US ANDA pipeline supplies to
RoW from Pashamylaram, and complex
injectables should drive growth for Gland
Pharma
China & the Fosun Connect: Many Indian pharma firms have tried to enter China but
have not been able to make a major mark, even though this is the second-largest market
in the world after the US. Gland Pharma aims to derive 10% of sales from China (part
of its RoW strategy) in coming years, and we believe its promoter, Fosun, could play
a critical role. Regulatory requirements in China are complex and different from those
in the US. The entire process takes about 12-14 months. Fosun has a wide network in
China, with deep understanding of the market. Gland has filed for 7 products in China
and expects to receive 1-2 product approvals in the next couple of quarters.
Apart from the China penetration, Fosun has played a role in Gland’s EU sales by levering
Fosun’s reach in the region. Although Gland has 3 API facilities and 24 ANDAs being
supported by in-house APIs, Gland does procure some APIs from Fosun at very attractive
costs.
Gland pharma aims to derive 10% of sales
from China in coming years, and Fosun
could play a key role
4 January 2022
Please see important disclosure information on pages 65 - 71 of this report.
38
EQUITY RESEARCH
India | Pharmaceuticals
39. Biosimilar to support medium- and long-term growth: Gland’s current biosimilar
capacity is 10kl, and the company has incurred most of the INR3bn capex to expand
it by another 10kl and plans to take it to 60kl. The current capacity is for vaccine and
is likely to be used for RDIF developed Sputnik-V/Sputnik light (single dose of Sputnik-
V) COVID vaccine until next year. Post Sputnik, Gland will begin with drug substance.
It has already started the groundwork for the biosimilars business and has begun the
business development exercise. Biosimilars manufacturing is a natural extension for
Gland; in next 2-3 years, it will likely obtain the developed market's regulatory approvals
and have enough capacities in place. This, in turn, should begin a new growth engine for
the company, which should continue in the long term.
Biosimilars are a medium- to long-term
growth story for the company
Valuation: We believe that Gland Pharma’s growth prospects remain quite strong on a
healthy pipeline of products in the US, which will increasingly benefit from its complex
injectables filings. We expect the RoW market to clock 52% growth on new geography
expansion and deeper penetration of various markets without margin impacts. In our
view, Gland is likely to scale up its China business very rapidly with the help of Fosun’s
large network. We do not factor any upside from Biologics, which we believe will play
out meaningfully from FY24 onward. We value the stock at 36.5x FY24E EPS and initiate
on the stock with a Buy rating.
We value the stock at 36.5x FY24E EPS
and initiate with a Buy rating
Exhibit 94 - US accounts for 61% of Gland Pharma's direct
revenues...
.
US
61%
RoW
16%
India
16%
EU, Canada, Others
7%
FY21 Revenue breakup (%)
Source: Company data, Jefferies
Exhibit 95 - ...another ~8% of US revenue comes via exports
from India division
.
Domestic
53%
Exports
47%
2QFY22 India revenue
Source: Clinton Health Access Initiative Report 2021, Jefferies
Large Product Offerings
The injectables specialist: Gland Pharma operates in the B2B injectables space with
capabilities for both API and formulations. The US accounts for more than two-
thirds of sales while other key geographies are EU, Canada (7%), India (9%), and RoW
(16%). As a specialist injectable manufacturer, the company offers products such as
sterile injectables, oncology, and ophthalmic, and it focuses on complex injectables,
NCE-1s, and various drug delivery systems, including liquid vials, lyophilized vials,
pre-filled syringes, ampoules, bags, and drops. The company is now foraying into
complex peptides, long-acting injectables, suspensions and hormonal products, pens,
and cartridges. By FY21, Gland Pharma was selling its products across 60+ countries
and had 1,501 total product registrations. It has registered 389 products in developed
markets of US, EU, Canada, and Australia, with 69 in India and 1,043 in RoW.
Gland pharma sells its products across
60+ countries and has 1,501 total
product registrations
The US has a strong pipeline, and high growth could sustain for several years: The
company not only operates in the injectables space CDMO but also develops their own IP
and ANDA filings. Cumulatively, Gland along with its partners have filed for 291 ANDAs,
of which 244 are approved (including tentative approvals) and 47 are pending approval.
The total market size of already approved products is USD7.5bn, and the market size of
pipeline products (pending ANDA and tentative approvals) is USD7.5bn, which provides
Market size of US pipeline products
(pending ANDA and tentative approval) is
USD7.5bn
4 January 2022
Please see important disclosure information on pages 65 - 71 of this report.
39
EQUITY RESEARCH
India | Pharmaceuticals
40. multiyear high-growth visibility to the company. As of March-21, 204 ANDAs were for
sterile injectables, 53 for oncology, and ~27 for ophthalmics. 114 ANDAs were owned
by Gland, 84 were approved, and 30 are pending approvals.
Exhibit 96 - 60% ANDAs are partner-owned, 40% Gland-owned
.
84
30
114
150
20
170
0
50
100
150
200
250
300
Approved Pending Total
ANDAs (as of FY21)
Owned Partner Owned
Source: Company data, Jefferies
Exhibit 97 - Sterile injectables contribute ~72% ANDAs
.
204 53 27
0 50 100 150 200 250 300
ANDAs (as of FY21)
Sterile Injectables Oncology Ophthalmics
Source: Company data, Jefferies
Exhibit 98 - Gland has ~1,500 product registrations globally
.
1,043
389
69
0
200
400
600
800
1,000
1,200
RoW US, Canada, EU, Oz India
Product Registerations (as of FY21)
Source: Company data, Jefferies
B2B operations with robust business model
Business Model: Gland Pharma operates via 5 major business models: 1) B2B IP-led
own filing; 2) B2B IP-led partner filing; 3) B2B CMO; 4) B2B Technology Transfer; 5)
B2C. Gland earns 90% of its revenue from sales of products while 10% is from sales of
services. Of the 90% product sales revenue, 80% is from transfer price and ~10% from
profit share from marketing partners.
B2B IP-led own filing: This model accounts for 24% of the business. In this model, Gland
Pharma's team identifies and develops products that are then licensed to marketing
partners (B2C firms) for commercialization. Gland Pharma files for dossiers/Para IV,
and the company has the ownership of the development, IP, and marketing rights. Gland
Pharma can license these on exclusive or non-exclusive basis, but most of them are
non-exclusive. Gland Pharma earns license fees, profit share, and transfer price on these
types of contracts but is responsible for paying the filing fees.
B2B IP-led own filing business model
accounts for 24% of sales
B2B IP-led partner filing: Gland Pharma earns 53% of its revenue from B2B IP-led partner
filing model, where Gland is co-owner of IP while filing is done by a partner. In this
model, the partner is responsible for dossier/Para IV filing, and Gland is co-owner of
development and IP rights. The partner (B2C) is the owner of the dossier and marketing
rights. Gland Pharma earns transfer price and profit share from such contracts.
Gland Pharma earns 53% of its revenue
from B2B IP-led partner filing model
4 January 2022
Please see important disclosure information on pages 65 - 71 of this report.
40
EQUITY RESEARCH
India | Pharmaceuticals
41. Contracts for both B2B partner-filed and Gland-filed products are long term, generally
for a period of 5-10 years. Apart from licensing fees, Gland receives milestone payments
from its front-end marketing firms. These models are adopted in the US, Europe, Canada,
Australia, India, Asia, Middle East, and Africa. Key partners are Athenex Pharma for IP-
led own filing and Sagent Inc. and Apotex for IP led partner filing.
B2B Technology Transfer: 17% of revenue comes from this stream of business. Under
this model, Gland Pharma does not deploy its R&D resources, and the product is
developed by the partner. Gland Pharma acquires the technology for manufacturing,
testing, and packaging from its partner. Gland engages in method transfer and
validation, execution of scale-up, stability studies, and helping the client/partner with
dossier compilation. Here the partner firm owns the IP and marketing rights, while Gland
has manufacturing rights during the term of the technology transfer agreement. Gland
Pharma earns transfer price and a small share of profits in this model. Key geographies
for this model include US, EU, Canada, Australia, and India.
B2B Technology Transfer accounts for
17% of sale
B2B CMO: This business model accounts for only 2% of the total sales. Under
this business line, Gland Pharma provides fill and finish services for sterilized
injectables to pharma firms for already approved products. Gland Pharma receives fixed
manufacturing and packaging payments per unit manufactured. The client owns the IP,
marketing rights, and ownership of the dossier. Even raw materials are procured by the
pharma firms. This model allows Gland to utilize their spare capacity and generate some
sales from it. This model is used only for product sales in India.
B2C: The B2C model adds ~4% of total revenues. This model is adopted in India,
where Gland Pharma has a salesforce of over 200 (as of FY21) and a wide distribution
network wih approximately 2,000 corporate hospitals, nursing homes, and government
facilities. Major products for this model are Hep 5, Hep 25, Cutenox, and Synject. Most
of the products are owned and manufactured by Gland Pharma, making this a complete
standalone play.
B2B CMO and B2C add 2%/4% of revenue
Exhibit 99 - Gland Pharma Business Models
.
ANDA/Product
registeration ownership
Development by us IP ownership Marketing rights Royalty/Profits sharing
B2B IP Led Own filing Yes Yes Yes Yes Yes
Partner Filing No Yes Co-owned No Yes
B2B Technology Transfer No Yes No No Yes
B2B CMO No No No No No
B2C Yes Yes Yes Yes Not applicable
Source: Company data, Jefferies
Exhibit 100 - B2B space registers higher growth vs B2C
.
3.4%
13.2%
15.4%
0%
2%
4%
6%
8%
10%
12%
14%
16%
18%
B2C B2B Gland
Revenue Growth CY14-19
Source: IQVIA, Jefferies. MAT September 2014-19
Exhibit 101 - Gross margins for B2B and B2C were comparable
in 2014, Gland has higher due to economies of scale
.
58.0%
41.3% 39.9%
0%
10%
20%
30%
40%
50%
60%
70%
Gland B2C B2B
Gross Margin 2014 (%)
Source: IQVIA, Jefferies. MAT September 2014-19
4 January 2022
Please see important disclosure information on pages 65 - 71 of this report.
41
EQUITY RESEARCH
India | Pharmaceuticals
42. Exhibit 102 - Gross margins for B2B segment crossed B2C by
2019
.
58.1%
42.3% 40.1%
0%
10%
20%
30%
40%
50%
60%
70%
Gland B2B B2C
Gross Margin 2019 (%)
Source: IQVIA, Jefferies. MAT September 2014-19
4 January 2022
Please see important disclosure information on pages 65 - 71 of this report.
42
EQUITY RESEARCH
India | Pharmaceuticals
43. New Infrastructure provides long-term growth visibility
Ramping Up on Biologics: Gland Pharma has 8 manufacturing facilities, 4 for
formulations and four for API, and the plants are in Hyderabad (4 of 8) and Vizag. The
facilities include two sterile injectables plants, one biosimilars drug substance plant,
one dedicated Penems facility, one oncology facility, and three other API facilities. The
biosimilars/biologics plant was acquired from Vitane Biologics, which had capacity
of 10kl. The plant used to handle 6 mammalian products; it had no major regulatory
approval but was a GMP-compliant facility. Gland Pharma intends to expand its
biologics capacity from 10kl currently to 60kl in coming years. They have already
earmarked INR3bn capex for the expansion by 10Kl, and most of it has been incurred.
Of the INR3bn, INR2.6bn will be spent on drug substance while rest will be for biologics
formulation. The current biologics capabilities are for vaccines only.
Gland pharma intends to expand its
biologics capacity from 10kl currently to
60kl in coming years
Gland Pharma was keen to enter the biosimilars/biologics space because many of the
injectables belong to the category, and it made sense for the company to venture into the
domain. However, the plan was to enter a few years down the line, which was preponed
on account of the Spuntik opportunity that emerged. Historically, the company has
handled biosimilars fill finish tasks, and one of their current top 5 products (Enoxaparin)
is a biosimilar. The company handled 8m units of the product last year and is likely to
go far higher in FY22 and FY23. Gland intends to stick to its forte of manufacturing
for biosimilars/biologics and does not want to enter product development. Gland will
maintain its strategy of B2B CDMO for biosimilars/biologics. Its biosimilars strategy
follows that of many formulation companies where they first target the RoW geography,
then the EU, and finally the US.
One of the current top 5 products
for Gland Pharma (Enoxaparin) is a
biosimilar
Pashamylaram facility to drive RoW growth; capacities no contrain for Gland: Gland’s
sterile injectables flagship facility is located in Dundigal, Hyderabad, which received
USFDA approval in 2003. Another sterile injectables facility is at Pashamylaram,
Hyderabad, which began domestic sales in Sep-15 and US sales in Sep-16. All the
company's non-biologics sites are approved by all the major regulatory bodies. Dundigal
is responsible for 50% of Gland Pharma’s US and Canada revenue. The site is the
oldest among all the facilities and has always remained spot on from a compliance
perspective. Dundigal operates at ~80% of capacity utilization currently.
Dundigal facility is responsible for 50% of
Gland' US & Canada revenue
The Pashamylaram facility has played a crucial role in expanding Gland's RoW market
sales. Gland Pharma originally begun their journey in the RoW and utilized funds to
invest for US markets. Overtime, the US business was built, and more resources were
directed toward it, eventually making RoW markets a miniscule proportion of business.
Capacities were always occupied by the US business, which led to capacity constraint
to venture into RoW markets. Since commencement of the Pashamylaram facility,
RoW growth has kicked off and is the fastest-growing market for the company, partly
helped by a low base. Gland Pharma targets to significantly scale its RoW business and
expects RoW to contribute 30-40% of total revenue in 3-4 years vs a FY21 contribution
of 16%. It expects to derive ~10% total revenue from China and the rest from other RoW
markets. Gland has ~1,000 product registrations in RoW, making it ready to go for these
geographies. Its focus on the US and capacity constraints resulted in no-show of these
products in various countries.
At Pashamylaram facility, RoW growth
has kicked off and is the fastest-growing
market for Gland Pharma
Pashamylaram facility has 10 suites, of which only 5 are partly utilized while one is for
Sputnik. Each suite has two lines of manufacturing. The operational 5 suites are not at
peak capacity utilization, leaving a lot of room for spare capacity. Every suit requires
FDA approval, and currently 5 suites that are operational have USFDA approval. The
suites can easily obtain USFDA approval with just CB30, and documents are sufficient
without a physical inspection.
Pashamylaram facility has 10 suites,of
which only 5 are partly utilized
4 January 2022
Please see important disclosure information on pages 65 - 71 of this report.
43
EQUITY RESEARCH
India | Pharmaceuticals