Go long on Page Industries, Q4FY15 net sales up 34.24% y/y
•
1 like•202 views

Page Industries is recommended for target of 16130 for the mid- to long-term

Recommended
Recommended
More Related Content
What's hot
What's hot (19)
Similar to Go long on Page Industries, Q4FY15 net sales up 34.24% y/y
Similar to Go long on Page Industries, Q4FY15 net sales up 34.24% y/y (20)
More from IndiaNotes.com
More from IndiaNotes.com (20)
Recently uploaded
Recently uploaded (20)
Go long on Page Industries, Q4FY15 net sales up 34.24% y/y
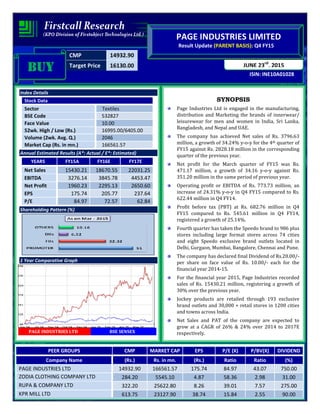
- 1. CMP 14932.90 Target Price 16130.00 ISIN: INE10A01028 JUNE 23rd , 2015 PAGE INDUSTRIES LIMITED Result Update (PARENT BASIS): Q4 FY15 BUYBUYBUYBUY Index Details Stock Data Sector Textiles BSE Code 532827 Face Value 10.00 52wk. High / Low (Rs.) 16995.00/6405.00 Volume (2wk. Avg. Q.) 2046 Market Cap (Rs. in mn.) 166561.57 Annual Estimated Results (A*: Actual / E*: Estimated) YEARS FY15A FY16E FY17E Net Sales 15430.21 18670.55 22031.25 EBITDA 3276.14 3845.78 4453.47 Net Profit 1960.23 2295.13 2650.60 EPS 175.74 205.77 237.64 P/E 84.97 72.57 62.84 Shareholding Pattern (%) 1 Year Comparative Graph PAGE INDUSTRIES LTD BSE SENSEX SYNOPSIS Page Industries Ltd is engaged in the manufacturing, distribution and Marketing the brands of innerwear/ leisurewear for men and women in India, Sri Lanka, Bangladesh, and Nepal and UAE. The company has achieved Net sales of Rs. 3796.63 million, a growth of 34.24% y-o-y for the 4th quarter of FY15 against Rs. 2828.18 million in the corresponding quarter of the previous year. Net profit for the March quarter of FY15 was Rs. 471.17 million, a growth of 34.16 y-o-y against Rs. 351.20 million in the same period of previous year. Operating profit or EBITDA of Rs. 773.73 million, an increase of 24.31% y-o-y in Q4 FY15 compared to Rs. 622.44 million in Q4 FY14. Profit before tax (PBT) at Rs. 682.76 million in Q4 FY15 compared to Rs. 545.61 million in Q4 FY14, registered a growth of 25.14%. Fourth quarter has taken the Speedo brand to 986 plus stores including large format stores across 74 cities and eight Speedo exclusive brand outlets located in Delhi, Gurgaon, Mumbai, Bangalore, Chennai and Pune. The company has declared final Dividend of Rs.20.00/- per share on face value of Rs. 10.00/- each for the financial year 2014-15. For the financial year 2015, Page Industries recorded sales of Rs. 15430.21 million, registering a growth of 30% over the previous year. Jockey products are retailed through 193 exclusive brand outlets and 30,000 + retail stores in 1200 cities and towns across India. Net Sales and PAT of the company are expected to grow at a CAGR of 26% & 24% over 2014 to 2017E respectively. PEER GROUPS CMP MARKET CAP EPS P/E (X) P/BV(X) DIVIDEND Company Name (Rs.) Rs. in mn. (Rs.) Ratio Ratio (%) PAGE INDUSTRIES LTD 14932.90 166561.57 175.74 84.97 43.07 750.00 ZODIA CLOTHING COMPANY LTD 284.20 5545.10 4.87 58.36 2.98 31.00 RUPA & COMPANY LTD 322.20 25622.80 8.26 39.01 7.57 275.00 KPR MILL LTD 613.75 23127.90 38.74 15.84 2.55 90.00
- 2. Analysis & Recommendation- ‘BUY’ For the 4th quarter of financial year 2015, Page Industries Ltd posted a growth of 33.32% in total income (including other income) to Rs. 3803.37 million from Rs. 2852.74 million in Corresponding period of previous year. EBITDA of Rs. 773.73 million, an increase of 24.31% y-o-y in Q4 FY15 compared to Rs. 622.44 million in Q4 FY14.The net profit for the March quarter of FY15 was Rs. 471.17 million, a growth of 34.16% y-o-y against Rs. 351.20 million in the same period of previous year. The fourth quarter has taken the Speedo brand to 986 plus stores including large format stores across 74 cities and eight Speedo exclusive brand outlets located in Delhi, Gurgaon, Mumbai, Bangalore, Chennai and Pune. For the end of FY15, the company registered a growth of 30% in Net sales to Rs. 15430.21 million from Rs. 11876.01 million for the end of FY14. Net profit grew by 27% to Rs. 1960.23 million for the end of FY15 from Rs. 1537.85 million for the end of FY14. The company’s brand stores now cover 128 stores in high streets and 48 stores in the busiest shopping malls across Metros, Tier One, Tier Two and Tier Three cities. The fourth quarter has taken the Speedo brand to 986 plus stores including large format stores across 74 cities and eight Speedo exclusive brand outlets located in Delhi, Gurgaon, Bangalore, Chennai and Pune. The Company expect growth in the innerwear market to be driven by broad based consumer trends in the form of rising discretionary spend, growing number of mid-high income house hold and rising urbanization. We expect that the company surplus scenario is likely to continue for the next three years, will keep its growth story. Thus we expect the company to post a CAGR of 26% & 24% in its top-line and bottom-line respectively. Hence, we recommend ‘BUY’ for ‘PAGE INDUSTRIES LIMITED’ with a target price of Rs. 16130.00 on the stock.
- 3. QUARTERLY HIGHLIGHTS (PARENT BASIS) Results updates- Q4 FY15, Page Industries Ltd. a leading manufacturer of innerwear, leisurewear, sportswear and swimwear for men and women in India, reported its financial results for the quarter ending on 31st March, 2015. The company has achieved Net sales of Rs. 3796.63 million, a growth of 34.24% y-o-y for the 4th quarter of FY15 against Rs. 2828.18 million in the corresponding quarter of the previous year. Net profit for the March quarter of FY15 was Rs. 471.17 million, a growth of 34.16 y-o-y against Rs. 351.20 million in the same period of previous year. Operating profit or EBITDA of Rs. 773.73 million, an increase of 24.31% y-o-y in Q4 FY15 compared to Rs. 622.44 million in Q4 FY14. The Company has reported an EPS of Rs. 42.24 for the 4th quarter as against an EPS of Rs. 31.49 in the corresponding quarter of the previous year. Break up of Expenditure During the quarter, total Expenditure rose by 36 per cent mainly on account of increased cost of materials consumed by 15%, Sub contract expenses by 26%, Employee benefits Expenses 36% and other expenses by 51% are the primary attribute for the growth of expenditure when compare to corresponding quarter of previous year. Total expenditure in Q4 FY15 stood to Rs. 3075.87 million as against Rs. 2260.43 million in Q4 FY14. Rs. In million Mar-15 Mar-14 % Change Net Sales 3796.63 2828.18 34.24 PAT 471.17 351.20 34.16 EPS 42.24 31.49 34.16 EBITDA 773.73 622.44 24.31 Break up of Expenditure (Rs. In million) Q4 FY15 Q4 FY14 Cost of Material Consumed 1562.33 1364.43 Sub contract expenses 300.47 239.02 Purchase of Stock in Trade 36.48 60.08 Employee Benefit Expenses 659.20 485.48 Depreciation & Amortization Expense 46.23 40.31 Other expenses 633.37 418.70
- 4. COMPANY PROFILE Page Industries was set up in 1994 with the key objective of bringing the world renowned brand 'Jockey' to India. Its promoters, Genomal family, had then been associated with Jockey International Inc. for 44 years as their sole licensee in the Philippines. It became a public company in March 2007.The company is located in Bangalore, India are the exclusive licensees of Jockey International Inc. (USA) for manufacture and distribution of the Jockey brand innerwear/ leisurewear for men and women in India, Sri Lanka, Bangladesh, and Nepal and UAE. In the early 1990s, when globalization was just unfolding in India, innerwear was a low involvement category for consumers. There was no organized international innerwear brand retailed in India. Page Industries Ltd identified this need and introduced a wide range of quality products for men and women employing modern global marketing and distribution methods. The company commenced operations in the year 1995 with the manufacturing, distribution and marketing of Jockey products. As of the end 2011, the company employs over 13,000 people with manufacturing operations spread over eight plants in Bangalore totaling 7,35,000 square feet of space. It commands wide spread pan India distribution encompassing over 18,000 retail outlets in 1,100 cities and towns and has revolutionized the innerwear market by launching exclusive Jockey outlets across India numbering 65 as of March 2011. In August 2008, Page Industries' promoter’s Genomal family and Jockey International USA celebrated their golden anniversary of association and both groups renewed their commitment to an even more exciting next 50 years. Page Industries has entered into the new licensing agreement with Jockey International Inc. up to December 31, 2030. In 2010, the Company bagged the “International Licensee of the Decade” award for achieving record growth year after year, offering world class products and maintaining global quality standards across all operations. In current year, Jockey products are retailed through 193 exclusive brand outlets and 30,000 + retail stores in 1200 cities and towns across India. Products • Men's Innerwear • Women's Innerwear • Sport and Leisure • Thermals • Kid’s innerwear
- 5. FINANCIAL HIGHLIGHT (PARENT BASIS) (A*- Actual, E* -Estimations & Rs. In Millions) Balance Sheet as at March31, 2014 -2017E FY14A FY15A FY16E FY17E I. EQUITY AND LIABILITIES: A. Shareholders’ Funds a) Share Capital 111.54 111.54 111.54 111.54 b) Reserves and Surplus 2778.48 3756.08 4958.03 6247.11 Sub-Total-Net worth 2890.02 3867.62 5069.57 6358.65 B. Non-Current Liabilities: a) Long-term borrowings 333.14 345.37 354.35 361.44 b) Deferred Tax Liabilities [Net] 94.83 114.21 131.34 144.48 c) Other Long Term Liabilities 465.99 556.13 631.21 700.64 d) Long Term Provisions 194.96 229.61 258.54 284.39 Sub-Total-Long term liabilities 1088.92 1245.32 1375.44 1490.95 C. Current Liabilities: a) Short-term borrowings 1088.99 998.62 938.70 886.70 b) Trade Payables 585.93 820.96 968.73 1084.98 c) Other Current Liabilities 973.82 1027.79 1064.79 1096.73 d) Short Term Provisions 228.45 274.30 315.45 345.73 Sub-Total-Current Liabilities 2877.19 3121.67 3287.67 3414.14 TOTAL-EQUITY AND LIABILITIES (A+B+C) 6856.13 8234.61 9732.68 11263.74 II. ASSETS: D. Non-Current Assets: a) Fixed Assets 1764.25 2173.71 2586.71 3041.98 b) other non-current assets 43.71 26.69 28.02 30.10 c) Long Term Loans and Advances 456.36 456.06 468.37 489.90 Sub-Total-Non-Current Assets 2264.32 2656.46 3083.10 3561.98 E. Current Assets: a) Current Investments 0.00 0.00 0.00 0.00 b) Inventories 3625.57 4434.51 5282.78 6079.05 c) Trade Receivables 726.79 884.32 1061.18 1262.81 d) Cash and Bank Balances 34.62 44.18 55.23 67.93 e) Short Term Loans and Advances 184.18 153.10 162.29 170.40 f) Other Current Assets 20.65 62.04 88.10 121.57 Sub-Total-Current Assets 4591.81 5578.15 6649.58 7701.76 TOTAL-ASSETS (D+E) 6856.13 8234.61 9732.68 11263.74
- 6. Annual Profit & Loss Statement for the period of 2014 to 2017E Value(Rs.in.mn) FY14A FY15A FY16E FY17E Description 12m 12m 12m 12m Net Sales 11876.01 15430.21 18670.55 22031.25 Other Income 65.72 86.11 93.00 102.30 Total Income 11941.73 15516.32 18763.55 22133.55 Expenditure -9364.11 -12240.18 -14917.77 -17680.08 Operating Profit 2577.62 3276.14 3845.78 4453.47 Interest -103.51 -166.62 -196.61 -226.10 Gross profit 2474.11 3109.52 3649.17 4227.37 Depreciation -139.29 -176.43 -208.19 -241.50 Profit Before Tax 2334.82 2933.09 3440.98 3985.87 Tax -796.97 -972.86 -1145.85 -1335.27 Net Profit 1537.85 1960.23 2295.13 2650.60 Equity capital 111.54 111.54 111.54 111.54 Reserves 2778.48 3756.08 4958.03 6247.11 Face value 10.00 10.00 10.00 10.00 EPS 137.87 175.74 205.77 237.64 Quarterly Profit & Loss Statement for the period of 30 SEPT, 2014 to 30 JUNE, 2015E Value(Rs.in.mn) 30-Sep-14 31-Dec-14 31-Mar-15 30-Jun-15E Description 3m 3m 3m 3m Net sales 3965.39 3829.74 3796.63 4669.85 Other income 66.63 1.80 6.74 7.41 Total Income 4032.02 3831.54 3803.37 4677.27 Expenditure -3219.66 -3051.48 -3029.64 -3684.52 Operating profit 812.36 780.06 773.73 992.75 Interest -33.49 -39.29 -44.74 -46.26 Gross profit 778.87 740.77 728.99 946.49 Depreciation -33.88 -45.09 -46.23 -51.78 Profit Before Tax 744.99 695.68 682.76 894.71 Tax -245.97 -248.58 -211.59 -296.15 Net Profit 499.02 447.10 471.17 598.56 Equity capital 111.54 111.54 111.54 111.54 Face value 10.00 10.00 10.00 10.00 EPS 44.74 40.08 42.24 53.66
- 7. Ratio Analysis Particulars FY14A FY15A FY16E FY176E EPS (Rs.) 137.87 175.74 205.77 237.64 EBITDA Margin (%) 21.70% 21.23% 20.60% 20.21% PBT Margin (%) 19.66% 19.01% 18.43% 18.09% PAT Margin (%) 12.95% 12.70% 12.29% 12.03% P/E Ratio (x) 108.31 84.97 72.57 62.84 ROE (%) 53.21% 50.68% 45.27% 41.68% ROCE (%) 63.01% 66.25% 63.72% 61.72% Debt Equity Ratio 0.49 0.35 0.26 0.20 EV/EBITDA (x) 65.16 51.24 43.63 37.67 Book Value (Rs.) 259.10 346.75 454.51 570.08 P/BV 57.63 43.07 32.86 26.19 Charts
- 8. OUTLOOK AND CONCLUSION At the current market price of Rs. 14932.90, the stock P/E ratio is at 72.57 x FY16E and 62.84 x FY17E respectively. Earning per share (EPS) of the company for the earnings for FY16E and FY17E is seen at Rs.205.77 and Rs.237.64 respectively. Net Sales and PAT of the company are expected to grow at a CAGR of 26% & 24% over 2014 to 2017E respectively. On the basis of EV/EBITDA, the stock trades at 43.63 x for FY16E and 37.67 x for FY17E. Price to Book Value of the stock is expected to be at 32.86 x and 26.19 x respectively for FY16E and FY17E. We recommend ‘BUY’ in this particular scrip with a target price of Rs.16130.00 for Medium to Long term investment.
- 9. INDUSTRY OVERVIEW India is the world's second-largest producer of textiles and garments. India’s textiles sector is one of the mainstays of the national economy. It is also one of the largest contributing sectors of India’s exports contributing 11 per cent to the country’s total exports basket. The textiles industry is labour intensive and is one of the largest employers. The industry realised export earnings worth US$ 41.57 billion in 2013-14. The textile industry has two broad segments, namely handloom, handicrafts, sericulture, power looms in the unorganised sector and spinning, apparel, garmenting, made ups in the organised sector. The Indian textiles industry is extremely varied, with a hand-spun and handwoven sector at one end of the spectrum, and the capital intensive sophisticated mill sector at the other. The decentralised power looms/ hosiery and knitting sector form the largest and knitting sector form the largest section of the Textiles Sector. The close linkage of the Industry to agriculture and the ancient culture, the traditions of the country make the Indian textiles sector unique in comparison to the textiles industry of other countries. This also provides the industry with the capacity to produce a variety of products suitable to the different market segments, both within and outside the country. The Indian textiles industry, currently estimated at around US $108 billion, is expected to reach US $ 141 billion by 2021. The industry is the second largest employer after agriculture, providing direct employment to over 45 million and 60 million people indirectly. The Indian Textile Industry contributes approximately 5 per cent to GDP, and 14 per cent to overall Index of Industrial Production (IIP). The Indian textile industry has the potential to grow five-fold over the next ten years to touch US$ 500 billion mark on the back of growing demand for polyester fabric, according to a study by Wazir Advisors and PCI Xylenes and Polyester. The US$ 500 billion market figure consists of domestic sales of US$ 315 billion and exports of US$ 185 billion. The current industry size comprises domestic market of US$ 68 billion and exports of US$ 40 billion, according to Managing Director, Wazir Advisors. Outlook The future for the Indian textile industry looks promising, buoyed by both strong domestic consumption as well as export demand. With consumerism and disposable income on the rise, the retail sector has experienced a rapid growth in the past decade with the entry of several international players like Marks & Spencer, Guess and Next into the Indian market. The organised apparel segment is expected to grow at a compound annual growth rate (CAGR) of more than 13 per cent over a 10-year period.
- 10. Disclaimer: This document is prepared by our research analysts and it does not constitute an offer or solicitation for the purchase or sale of any financial instrument or as an official confirmation of any transaction. The information contained herein is from publicly available data or other sources believed to be reliable but we do not represent that it is accurate or complete and it should not be relied on as such. Firstcall Research or any of its affiliates shall not be in any way responsible for any loss or damage that may arise to any person from any inadvertent error in the information contained in this report. Firstcall Research and/ or its affiliates and/or employees will not be liable for the recipients’ investment decision based on this document.
- 11. Firstcall India Equity Research: Email – info@firstobjectindia.com C.V.S.L.Kameswari Pharma & Diversified U. Janaki Rao Capital Goods B. Anil Kumar Auto, IT & FMCG M. Vinayak Rao Diversified G. Amarender Diversified Firstcall Research Provides Industry Research on all the Sectors and Equity Research on Major Companies forming part of Listed and Unlisted Segments For Further Details Contact: Tel.: 022-2527 2510/2527 6077 / 25276089 Telefax: 022-25276089 040-20000235 /20000233 E-mail: info@firstobjectindia.com www.firstcallresearch.com