Coal India - Update
•
0 likes•330 views

India's coal ministry has pushed Coal India to reduce its E-auction sales. The ministry has asked Coal India to reduce E-auction shipments by 33mn tonnes in FY15. The idea behind such a move is to increase availability for domestic power producers.

Recommended
Recommended
More Related Content
What's hot
What's hot (20)
Similar to Coal India - Update
Similar to Coal India - Update (20)
More from IndiaNotes.com
More from IndiaNotes.com (20)
Recently uploaded
Recently uploaded (20)
Coal India - Update
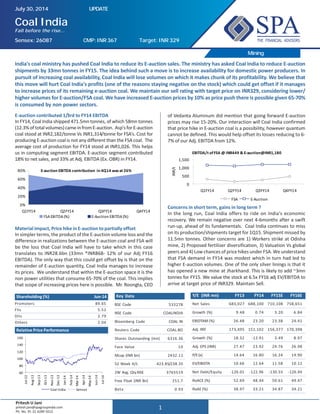
- 1. 1 Coal India Fall before the rise... Mining E-auction contributed 1/3rd to FY14 EBITDA In FY14, Coal India shipped 471.5mn tonnes, of which 58mn tonnes (12.3%oftotalvolumes)cameinfromE-auction. Asp'sforE-auction coal stood at INR2,182/tonne Vs INR1,314/tonne for FSA’s. Cost for producing E-auction coal is not any different than the FSA coal. The average cost of production for FY14 stood at INR1,026. This helps us in computing segment EBITDA. E-auction segment contributed 18% to net sales, and 33% at Adj. EBITDA (Ex. OBR) in FY14. E-auction EBITDA contribution in 4Q14 was at 26% 0% 20% 40% 60% 80% Q1FY14 Q2FY14 Q3FY14 Q4FY14 FSA EBITDA (%) E-Auction EBITDA (%) Material impact, Price hike in E-auction to partially offset In simpler terms, the product of the E-auction volume loss and the difference in realizations between the E-auction coal and FSA will be the loss that Coal India will have to take which in this case translates to INR28.6bn (33mn *INR868- 12% of our Adj FY16 EBITDA). The only way that this could get offset by is that on the remainder of E-auction quantity, Coal India manages to increase its prices. We understand that within the E-auction space it is the non power utilities that consume 65-70% of the coal. This implies that scope of increasing prices here is possible. Mr. Roongta, CEO July 30, 2014 UPDATE Shareholding (%) Jun-14 Promoters 89.65 FIIs 5.52 DIIs 2.79 Others 2.04 Relative Price Performance Key Data BSE Code 533278 NSE Code COALINDIA Bloomberg Code COAL IN Reuters Code COAL.BO Shares Outstanding (mn) 6316.36 Face Value 10 Mcap (INR bn) 2432.11 52 Week H/L 423.85/238.35 2W Avg. Qty.NSE 3765519 Free Float (INR Bn) 251.7 Beta 0.93 Y/E (INR mn) FY13 FY14 FY15E FY16E Net Sales 683,027 688,100 710,108 758,651 Growth (%) 9.48 0.74 3.20 6.84 EBIDTAM (%) 26.48 23.20 23.38 24.41 Adj. PAT 173,495 151,102 156,377 170,398 Growth (%) 18.32 -12.91 3.49 8.97 Adj. EPS (INR) 27.47 23.92 24.76 26.98 P/E(x) 14.64 16.80 16.24 14.90 EV/EBIDTA 10.66 12.64 11.58 10.12 Net Debt/Equity -126.01 -122.96 -130.53 -126.94 RoACE (%) 52.69 48.44 50.61 49.47 RoAE (%) 38.97 33.21 34.87 34.21 India's coal ministry has pushed Coal India to reduce its E-auction sales. The ministry has asked Coal India to reduce E-auction shipments by 33mn tonnes in FY15. The idea behind such a move is to increase availability for domestic power producers. In pursuit of increasing coal availability, Coal India will lose volumes on which it makes chunk of its profitability. We believe that this move will hurt Coal India's profits (one of the reasons staying negative on the stock) which could get offset if it manages to increase prices of its remaining e-auction coal. We maintain our sell rating with target price on INR329, considering lower/ higher volumes for E-auction/FSA coal. We have increased E-auction prices by 10% as price push there is possible given 65-70% is consumed by non power sectors. Pritesh U Jani pritesh.jani@spagroupindia.com Ph. No. 91 22 4289 5612 of Vedanta Aluminum did mention that going forward E-auction prices may rise 15-20%. Our interaction will Coal India confirmed that price hike in E-auction coal is a possibility, however quantum cannot be defined. This would help offset its losses reducing to 6- 7% of our Adj. EBITDA from 12%. EBITDA/t of FSA @ INR449 & E-auction@INR1,180 0 500 1,000 1,500 Q1FY14 Q2FY14 Q3FY14 Q4FY14 INR/t FSA E-Auction Concerns in short term, gains in long term ? In the long run, Coal India offers to ride on India's economic recovery. We remain negative over next 4-6months after a swift run-up, ahead of its fundamentals. Coal India continues to miss on its production/shipments target for 1Q15. Shipment missed by 11.5mn tonnes. Other concerns are 1) Workers strike at Odisha mine, 2) Proposed fertilizer diversification, 3) Valuation Vs global peers and 4) Low chances of price hikes under FSA. We understand that FSA demand in FY14 was modest which in turn had led to higher E-auction volumes. One of the only silver linings is that it has opened a new mine at Jharkhand. This is likely to add ~3mn tonnes for FY15. We value the stock at 6.5x FY16 adj EV/EBITDA to arrive at target price of INR329. Maintain Sell. 60 80 100 120 140 160 Jul-13 Aug-13 Sep-13 Oct-13 Nov-13 Dec-13 Jan-14 Feb-14 Mar-14 Apr-14 May-14 Jun-14 Jul-14 Coal India Sensex Sensex: 26087 CMP:INR367 Target: INR 329
- 2. 2 Mining (INR) FY13 FY14 FY15E FY16E Shipments mn tonnes 465 472 490 506 Asp's/t Raw coal 1,284 1,314 1,364 1,414 E-Auction 2,544 2,182 2,400 2,450 Beneficiated 3,006 2,123 2,173 2,223 Blended Asp/t 1,468 1,459 1,450 1,498 Staff costs/t 587 589 587 614 As % of Sales 40.0% 40.4% 40.5% 41.0% Total cost/t 1079.6 1120.6 1110.6 1132.4 EBITDA/t 389 339 339 366 Coal India Sensitivity - Overall Volumes A 10% change in overall volumes, leads to 19/14% change in EBITDA/PAT and 12% in Target price. We have currently assumed 506mn tonnes as Coal India's shipments for FY16 Overall Shipments FY16 Shipments (mn tonnes) INR mn 456 506 557 Revenue 682,871 758,651 834,620 EBITDA 148,995 185,204 222,033 PAT 146,500 170,398 194,705 EPS (INR) 23.19 26.98 30.83 Target Price 288 329 370 Coal India - Sensitivity to E-auction Volumes As of now, we have assumed that Coal India will divert 33mn tonnes (base case) in FY15/16. A 10mn tonne improvement in diversion increases EBITDA/Target price by 3.1%/1.9%. FY16 Shipments diversion(mn tonnes) E-auction Shipments (13) (23) (33) Revenue 778,389 768,520 758,651 EBITDA 196,968 191,086 185,204 PAT 178,162 174,280 170,398 EPS 28.21 27.59 26.98 Target Price 341 335 329 We have cut E-auction volumes by 33mn tonnes and added under FSA sales. Post this, we have built in higher prices by 10% Vs FY14 for the remainder quantity of E-auction coal. Subsequently, have kept FSA prices same, although risks of softening may emerge as demand to absorb incremental volumes may not emerge. (INR) FY13 FY14 FY15E FY16E Shipments mn tonnes 465 472 490 506 Asp's/t Raw coal 1,284 1,314 1,364 1,414 E-Auction 2,544 2,182 2,232 2,282 Beneficiated 3,006 2,123 2,173 2,223 Blended Asp/t 1,468 1,459 1,499 1,551 Staff costs/t 587 589 607 636 As % of Sales 40.0% 40.4% 40.5% 41.0% Total cost/t 1079.6 1120.6 1126.9 1153.9 EBITDA/t 389 339 372 397 Key Assumptions (Previous) Peer comparision - Coal India trading at 15% premium to overall Mcap (USD bn) EV/EBITDA PE ROE FY 16/CY 15 FY 16/CY 15 FY 16/CY 15 Arch Coal Inc 0.62 9.3 - -13.4 Peabody Energy Corp 4.19 7.5 43.9 4.0 SXCoal & Electricity Power 3.05 5.9 9.2 6.5 Yanzhou Coal Mining Co 5.22 7.6 10.8 4.9 Alliance Resource 3.72 5.1 10.0 46.1 BHP Billiton 188.87 6.5 13.0 15.8 Anglo American 38.47 5.2 9.8 9.8 Alpha Natural Resources 0.76 5.7 - -14.3 Bumi Resources 0.86 13.0 - - Coal India 38.65 8.2 12.2 36.6 China Shenhua Energy 51.16 4.5 8.2 12.9 Average 7.1 14.6 10.9 Source: Bloomberg, SPAResearch INR mn FY16E EBITDA 185,204 OBR 35,447 Adj. EBITDA 220,651 EV/EBITDA on 2016 Adj EBITDA (X) 6.5 EV 1,434,231 Avg . Net Debt (640,792) Target Market Cap 2,075,022 No of Shares 6316.36 Target price (INR) 329 Valuation Key Assumptions (Revised)
- 3. 3 Consolidated Summary Financials Income Statement Year End March (INR mn) FY13 FY14 FY15E FY16E Net Sales 683,027 688,100 710,108 758,651 Growth in Sales (%) 9.48 0.74 3.20 6.84 Employees Cost 273,208 277,694 287,594 311,047 Other Expenses 26,332 26,919 28,265 29,678 Total Expenditure 502,191 528,469 544,074 573,447 EBIDTA (without OI) 180,836 159,632 166,034 185,204 % Growth 15.67 -11.73 4.01 11.55 EBITDA Margin % 26.48 23.20 23.38 24.41 Depreciation/Amortization 18,130 19,964 20,550 21,500 EBIT 162,707 139,668 145,484 163,704 EBIT Margin % 23.82 20.30 20.49 21.58 Interest Expense 452 580 550 525 Other Income 87,467 89,694 92,000 95,000 Exceptionals 69 14 0 0 EBT 249,791 228,795 236,934 258,179 Tax Expenses 76,227 77,679 80,558 87,781 PAT 173,564 151,116 156,377 170,398 Minority Interest 0 0 0 0 APAT 173,564 151,116 156,377 170,398 % Growth 17.64 -12.93 3.48 8.97 APAT Margin % 25.41 21.96 22.02 22.46 Balance Sheet Year End March (INR mn) FY13 FY14 FY15E FY16E Sources of funds Share capital 63,164 63,164 63,164 63,164 Reserves & Surplus 421,556 360,881 408,419 460,220 Total Networth 484,720 424,045 471,583 523,384 Minorities interests 636 636 636 636 Total Debt 10,778 1,715 8,715 9,715 Other Long term Liabilites 8,822 15,572 15,572 15,572 Total Liabilities 504,956 441,967 496,506 549,307 Application of funds Net Block 169,617 191,002 185,452 180,952 Capital Work-in-Progress 0 0 650 1,500 Investments 23,950 37,749 37,749 37,749 Total Current Assets 886,841 793,955 887,428 946,130 Total Current Liabilities 575,452 580,739 614,774 617,024 Net Current Assets 311,389 213,216 272,655 329,106 Total Assets 504,956 441,967 496,506 549,307 Cash Flow Year End March (INR mn) FY13 FY14 FY15E FY16E Pre-tax profit 249,791 228,795 236,934 258,179 Depreciation 9,718 19,964 20,550 21,500 Chg in working capital -17,061 6,458 8,000 -8,343 Total tax paid -76,227 -77,679 -80,558 -87,781 Other operating activities 0.0 0.0 0.0 0.0 Cash flow from operations (a) 166,220 177,539 184,926 183,555 Capital expenditure -15,898 -41,349 -15,650 -17,850 Chg in investments -4,136 -13,800 0 0 Other investing activities 9,306 491 0 0 Cash flow from investing (b) -10,728 -54,658 -15,650 -17,850 Free cash flow (a+b) 155,493 122,881 169,276 165,705 Equity raised/(repaid) 0.0 0.0 0.0 0.0 Chg in minorities 100.0 0.0 0.0 0.0 Debt raised/(repaid) -2,275.6 -9,063.3 7,000.0 1,000.0 Dividend (incl. tax) -112,985 -212,282 -75,061 -116,914 Other financing activities 0.0 0.0 0.0 0.0 Cash flow from financing (c) -115,161 -221,346 -68,061 -115,914 Net chg in cash (a+b+c) 40,332 -98,464 101,216 49,791 Opening Cash 582,028 622,360 523,895 625,111 Closing Cash 622,360 523,895 625,111 674,902 Key Ratios Year End March FY13 FY14 FY15E FY16E Per Share Data (INR) Adj. EPS 27.47 23.92 24.76 26.98 Growth (%) 18.32 -12.91 3.49 8.97 CEPS 30.34 27.08 28.01 30.38 DPS 14.01 28.97 14.85 16.19 BVPS 76.84 67.24 74.76 82.96 Return Ratios (%) RoACE 52.69 48.44 50.61 49.47 RoANW 38.97 33.21 34.87 34.21 Liquidity Ratios Net Debt/Equity -126.01 -122.96 -130.53 -126.94 Interest Coverage Ratio 553.85 395.45 431.79 492.77 Current Ratio 1.42 1.54 1.37 1.44 Efficiency Ratios Asset Turnover Ratio 0.64 0.65 0.67 0.67 Inventory Days 30 30 27 27 Debtor Days 56 44 40 40 Creditor days 6 6 6 6 Valuation Ratios P/E(x) 14.64 16.80 16.24 14.90 P/BV (x) 5.23 5.98 5.38 4.85 P/CEPS (x) 13.25 14.84 14.35 13.23 Dividend Yield (%) 3.5% 7.2% 3.7% 4.0% EV/Net Sales (x) 2.8 2.9 2.7 2.5 EV/EBIDTA(x) 10.7 12.6 11.6 10.1 Mining
- 4. 4 Mining Disclaimer: This report is for the personal information of the authorized recipient and does not construe to be any investment, legal or taxation advice to you. SPA Securities Limited (hereinafter referred as SPA) is not soliciting any action based upon it. This report is not for public distribution and has been furnished to you solely for your information and should not be reproduced or redistributed to any other person in any form. This document is provided for assistance only and is not intended to be and must not alone be taken as the basis for an investment decision. The intent of this document is not in recommendary nature. The views expressed are those of analyst and the Company may or may not subscribe to all the views expressed therein The report is based upon information that we consider reliable, but we do not represent that it is accurate or complete, and it should not be relied upon such. SPA or any of its affiliates or employees shall not be in any way responsible for any loss or damage that may arise to any person from any inadvertent error in the information contained in this report. Neither the Firm, not its directors, employees, agents or representatives shall be liable for any damages whether direct or indirect, incidental, special or consequential including lost revenue or lost profits that may arise from or in connection with the use of the information. SPA or any of its affiliates or employees do not provide, at any time, any express or implied warranty of any kind, regarding any matter pertaining to this report, including without limitation the implied warranties of merchantability, fitness for a particular purpose, and non-infringement. The recipients of this report should rely on their own investigations. SPA and/or its affiliates and/or employees may have interests/ positions, financial or otherwise in the securities mentioned in this report. SPA has incorporated a Disclosure of Interest Statement in this document. This should, however, not be treated as endorsement of the views expressed in the report. Disclosure of Interest Statement 1. Analyst ownership of the stock - No 2. Group/Directors ownership of the stock - No 3. Broking relationship with company covered - No This information is subject to change without any prior notice. SPA reserves the right to make modifications and alternations to this statement as may be required from time to time. Nevertheless, SPA is committed to providing independent and transparent recommendations to its clients, and would be happy to provide information in response to specific client queries. SPA Securities Ltd SEBI Reg. Nos. NSE Cash INB231178238 NSE Future & Option INF231173238 NSE Currency Derivatives INE231178238 BSE Cash INB011178234 BSE Currency Derivatives INE011178234 MCX-SX Cash INB261178231 MCX-SX Future & Option INF261178231 MCX-SX Currency Derivatives INE261178238 USE Currency Derivatives INE271178234 Mutual Fund ARN 77388 OTCEI INB200891838 PMS INP000003179 CDSL DP IN-DP-CDSL-485-2008 NSDL DP IN-DP-NSDL-316-2009 SPACAPITALSERVICES LIMITED Investment Advisory Services, AMFI Reg. No. ARN-0007 SPACAPITALADVISORS LIMITED SEBI registered Category-1 Merchant Bankers SEBI Regn. No. INM000010825 SPACOMTRADE PRIVATE LIMITED Member of NCDEX & MCX. NCDEX TMID-00729, NCDEX FMC No.NCDEX/TCM/CORP/0714 SPAINSURANCEBROKINGSERVICESLTD Direct Broker for Life and General Insurance Broking IRDA Lic. Code No. DB053/03 For More Information Visit Us At : www.spasecurities.com Sharad Avasthi Dy Head - Equity Research sharad.avasthi@spagroupindia.com Tel.: +91-33-4011 4800 Ext.832 SPA Securities Ltd: Mittal Court, A-Wing, 10th Floor, Nariman Point, Mumbai - 400 021, Tel. No. : +91-022-4289 5600, Fax: +91 (22) 2657 3708/9