Magna Electrocastings' PAT foreseen rising by CAGR of 8% over 2014 to 2017E, Buy
•
0 likes•185 views

At the current market price of Rs. 124.80, the stock P/E ratio is at 9.51 x FY16E and 7.92 x FY17E respectively.

Recommended
Recommended
More Related Content
What's hot
What's hot (19)
Similar to Magna Electrocastings' PAT foreseen rising by CAGR of 8% over 2014 to 2017E, Buy
Similar to Magna Electrocastings' PAT foreseen rising by CAGR of 8% over 2014 to 2017E, Buy (20)
More from IndiaNotes.com
More from IndiaNotes.com (20)
Recently uploaded
Recently uploaded (20)
Magna Electrocastings' PAT foreseen rising by CAGR of 8% over 2014 to 2017E, Buy
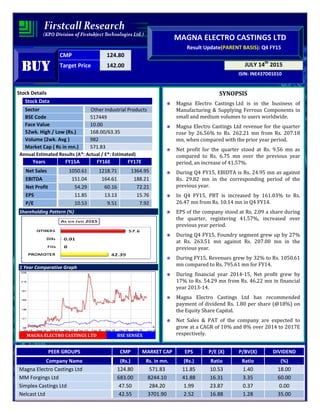
- 1. CMP 124.80 Target Price 142.00 ISIN: INE437D01010 JULY 14th 2015 MAGNA ELECTRO CASTINGS LTD Result Update(PARENT BASIS): Q4 FY15 BUYBUYBUYBUY Stock Details Stock Data Sector Other Industrial Products BSE Code 517449 Face Value 10.00 52wk. High / Low (Rs.) 168.00/63.35 Volume (2wk. Avg ) 982 Market Cap ( Rs in mn.) 571.83 Annual Estimated Results (A*: Actual / E*: Estimated) Years FY15A FY16E FY17E Net Sales 1050.61 1218.71 1364.95 EBITDA 151.04 164.61 188.21 Net Profit 54.29 60.16 72.21 EPS 11.85 13.13 15.76 P/E 10.53 9.51 7.92 Shareholding Pattern (%) 1 Year Comparative Graph MAGNA ELECTRO CASTINGS LTD BSE SENSEX SYNOPSIS Magna Electro Castings Ltd is in the business of Manufacturing & Supplying Ferrous Components in small and medium volumes to users worldwide. Magna Electro Castings Ltd revenue for the quarter rose by 26.56% to Rs. 262.21 mn from Rs. 207.18 mn, when compared with the prior year period. Net profit for the quarter stood at Rs. 9.56 mn as compared to Rs. 6.75 mn over the previous year period, an increase of 41.57%. During Q4 FY15, EBIDTA is Rs. 24.95 mn as against Rs. 29.82 mn in the corresponding period of the previous year. In Q4 FY15, PBT is increased by 161.03% to Rs. 26.47 mn from Rs. 10.14 mn in Q4 FY14. EPS of the company stood at Rs. 2.09 a share during the quarter, registering 41.57%, increased over previous year period. During Q4 FY15, Foundry segment grew up by 27% at Rs. 263.51 mn against Rs. 207.00 mn in the previous year. During FY15, Revenues grew by 32% to Rs. 1050.61 mn compared to Rs. 795.61 mn for FY14. During financial year 2014-15, Net profit grew by 17% to Rs. 54.29 mn from Rs. 46.22 mn in financial year 2013-14. Magna Electro Castings Ltd has recommended payment of dividend Rs. 1.80 per share (@18%) on the Equity Share Capital. Net Sales & PAT of the company are expected to grow at a CAGR of 10% and 8% over 2014 to 2017E respectively. PEER GROUPS CMP MARKET CAP EPS P/E (X) P/BV(X) DIVIDEND Company Name (Rs.) Rs. in mn. (Rs.) Ratio Ratio (%) Magna Electro Castings Ltd 124.80 571.83 11.85 10.53 1.40 18.00 MM Forgings Ltd 683.00 8244.10 41.88 16.31 3.35 60.00 Simplex Castings Ltd 47.50 284.20 1.99 23.87 0.37 0.00 Nelcast Ltd 42.55 3701.90 2.52 16.88 1.28 35.00
- 2. QUARTERLY HIGHLIGHTS (PARENT BASIS) Results updates- Q4 FY15, Months Mar-15 Mar-14 % Change Net Sales 262.21 207.18 26.56% PAT 9.56 6.75 41.57% EPS 2.09 1.47 41.57% EBITDA 24.95 29.82 -16.34% Magna Electro Castings Ltd revenue for the quarter rose by 26.56% to Rs. 262.21 million from Rs. 207.18 million, when compared with the prior year period. Net profit for the quarter stood at Rs. 9.56 million as compared to Rs. 6.75 million over the previous year period, an increase of 41.57%. Reported earnings per share of the company stood at Rs. 2.09 a share during the quarter, registering 41.57%, increased over previous year period. Profit before interest, depreciation and tax is Rs. 24.95 millions as against Rs. 29.82 millions in the corresponding period of the previous year. Break up of Expenditure Particulars Rs. Million Q4 FY15 Q4 FY14 % Change Cost of Material Consumed 92.15 78.83 17% Employee Benefit Expenses 22.57 15.17 49% Other Expenditure 108.18 94.87 14%
- 3. Segment Revenue Company Profile Magna Electro Castings was incorporated in 1993 as a Public Company. Magna is in the Business of Manufacturing and Supplying Ferrous Components in small and medium volumes to users worldwide. The company operates through two segments, Foundry and Wind Energy. Magna specializes in the manufacture of Ductile Iron and Gray Iron casting in the weight range of 300 grams to a maximum of 2000 Kilograms. Magna also adds value by heat treatment, surface treatments and machining so that the products are ready to assemble. Magna also produces fully machined components, utilizing its in-house CNC machine shop and other facilities as well. Magna has extensive experience in the supply of safety requirement components in the casting and fully machined forms. The components meet stringent requirements in terms of Radiographic Quality and Metallurgical Control. Magna has established warehousing in the USA, this facility along with bi-weekly container shipments, allows catering to low volume requirements. Also the company’s warehousing capability enables to supply products just in time, to customers in the United States of America.
- 4. Financial Highlight (PARENT BASIS) (A*- Actual, E* -Estimations & Rs. In Million) Balance Sheet as at March 31, 2014 -2017E FY14A FY15A FY16E FY17E EQUITY AND LIABILITIES: Shareholders’ Funds: Share Capital 45.82 45.82 45.82 45.82 Reserves and Surplus 319.02 363.38 423.54 495.75 A. Sub Total - Net worth 364.84 409.20 469.36 541.57 Non-Current Liabilities: 1) Long-term borrowings 52.69 29.39 26.45 24.33 2) Deferred Tax Liabilities [Net] 43.18 51.97 59.25 65.76 B. Sub Total - Non-Current Liabilities 95.87 81.36 85.70 90.10 Current Liabilities: 1) Short-term borrowings 107.60 147.18 167.79 187.92 2) Trade Payables 121.60 136.49 147.41 157.73 3) Other Current Liabilities 39.79 34.10 35.81 37.24 4) Short Term Provisions 20.67 16.82 17.83 18.72 C. Sub Total-Current Liabilities 289.66 334.59 368.83 401.61 Total Liabilities (A+B+C) 750.37 825.15 923.88 1033.27 Non-Current Assets 1) Fixed Assets 407.15 409.38 433.94 455.64 2) Long Term Loans and Advances 13.98 16.43 18.40 20.24 D. Sub Total - Non-Current Assets 421.13 425.81 452.34 475.88 Current Assets: 1) Short-term borrowings 71.66 67.21 73.93 79.85 2) Trade Payables 198.72 249.46 295.59 357.72 3) Other Current Liabilities 8.60 13.46 16.69 19.53 4) Short Term Provisions 45.31 65.69 81.46 96.12 5) Short-term borrowings 4.95 3.52 3.87 4.18 E. Sub Total-Current Assets 329.24 399.34 471.54 557.39 Total Assets (D+E) 750.37 825.15 923.88 1033.27
- 5. Annual Profit & Loss Statement for the period of 2014 to 2017E Value(Rs.in.mn) FY14A FY15A FY16E FY17E Description 12m 12m 12m 12m Net Sales 795.61 1050.61 1218.71 1364.95 Other Income 7.69 4.51 4.96 5.31 Total Income 803.30 1055.12 1223.67 1370.26 Expenditure -650.83 -904.08 -1059.06 -1182.05 Operating Profit 152.47 151.04 164.61 188.21 Interest -25.80 -23.18 -25.27 -27.03 Gross profit 126.67 127.86 139.35 161.18 Depreciation -69.56 -44.16 -46.37 -50.08 Profit Before Tax 57.11 83.70 92.98 111.10 Tax -10.89 -29.41 -32.82 -38.88 Net Profit 46.22 54.29 60.16 72.21 Equity capital 45.82 45.82 45.82 45.82 Reserves 319.02 363.38 423.54 495.75 Face value 10.00 10.00 10.00 10.00 EPS 10.09 11.85 13.13 15.76 Quarterly Profit & Loss Statement for the period of 30th Sep, 2014 to 30th June, 2015E Value(Rs.in.mn) 30-Sep-14 31-Dec-14 31-Mar-15 30-Jun-15E Description 3m 3m 3m 3m Net Sales 310.88 249.52 262.21 291.05 Other income 1.09 1.12 1.30 1.37 Total Income 311.97 250.64 263.51 292.41 Expenditure -258.15 -216.16 -238.56 -252.92 Operating profit 53.82 34.48 24.95 39.49 Interest -5.53 -5.60 -6.82 -7.71 Gross profit 48.29 28.88 18.13 31.79 Depreciation -17.50 -17.50 8.34 -12.95 Profit Before Tax 30.79 11.38 26.47 18.84 Tax -7.50 -2.50 -16.91 -5.84 Net Profit 23.29 8.88 9.56 13.00 Equity capital 45.82 45.82 45.82 45.82 Face value 10.00 10.00 10.00 10.00 EPS 5.08 1.94 2.09 2.84
- 6. Ratio Analysis Particulars FY14A FY15A FY16E FY17E EPS (Rs.) 10.09 11.85 13.13 15.76 EBITDA Margin (%) 19.16% 14.38% 13.51% 13.79% PBT Margin (%) 7.18% 7.97% 7.63% 8.14% PAT Margin (%) 5.81% 5.17% 4.94% 5.29% P/E Ratio (x) 12.37 10.53 9.51 7.92 ROE (%) 12.67% 13.27% 12.82% 13.33% ROCE (%) 42.28% 33.32% 31.79% 31.61% Debt Equity Ratio 0.44 0.43 0.41 0.39 EV/EBITDA (x) 4.75 4.87 4.55 4.06 Book Value (Rs.) 79.62 89.31 102.43 118.20 P/BV 1.57 1.40 1.22 1.06 Charts
- 7. Outlook and Conclusion At the current market price of Rs. 124.80, the stock P/E ratio is at 9.51 x FY16E and 7.92 x FY17E respectively. Earning per share (EPS) of the company for the earnings for FY16E and FY17E is seen at Rs. 13.13 and Rs. 15.76 respectively. Net Sales and PAT of the company are expected to grow at a CAGR of 10% and 8% over 2014 to 2017E respectively. On the basis of EV/EBITDA, the stock trades at 4.55 x for FY16E and 4.06 x for FY17E. Price to Book Value of the stock is expected to be at 1.22 x and 1.06 x for FY16E and FY17E respectively. We recommend ‘BUY’ in this particular scrip with a target price of Rs. 142.00 for Medium to Long term investment. Industry Overview The Indian foundry industry is well established, with about 4500 units, out of which about 80% of the units are in the small scale sector and the balance in the medium and large scale sectors, catering to international standards. The Indian foundry industry is the world's third largest producer of castings, next only to China and USA. The vital role being played by the industry can be gauged by the fact that it is poised to become a USD 19.2 billion industry by the year 2016 and offering employment opportunities to about 1 million. Opportunities and Threats The demand for castings is increasing the world over, though at the moment with the major economies going through a recessionary period, the growth is not as expected. However the situation is expected to show improvement in the coming quarters, both in the domestic and international markets. With the Government's commitment to improve the infrastructural facilities, especially in key sectors like power, the demand for castings is expected to go up. The threat of more players entering the market should also be monitored so that the Company does not lose out to competitors. Outlook The general recessionary trend, both in the international as well as the domestic markets, continued to affect most of the industries, especially auto, pump and valves, which were the most affected. There seems to be a marginal improvement during the last year and it is hoped that the market will pick up momentum gradually during the current financial year.
- 8. Disclaimer: This document is prepared by our research analysts and it does not constitute an offer or solicitation for the purchase or sale of any financial instrument or as an official confirmation of any transaction. The information contained herein is from publicly available data or other sources believed to be reliable but we do not represent that it is accurate or complete and it should not be relied on as such. Firstcall Research or any of its affiliates shall not be in any way responsible for any loss or damage that may arise to any person from any inadvertent error in the information contained in this report. Firstcall Research and/ or its affiliates and/or employees will not be liable for the recipients’ investment decision based on this document.
- 9. Firstcall India Equity Research: Email – info@firstobjectindia.com C.V.S.L.Kameswari Pharma & Diversified U. Janaki Rao Capital Goods B. Anil Kumar Auto, IT & FMCG M. Vinayak Rao Diversified G. Amarender Diversified Firstcall Research Provides Industry Research on all the Sectors and Equity Research on Major Companies forming part of Listed and Unlisted Segments For Further Details Contact: Tel.: 022-2527 2510/2527 6077 / 25276089 Telefax: 022-25276089 040-20000235 /20000233 E-mail: info@firstobjectindia.com www.firstcallresearch.com