1. See important disclosures at the end of this report Powered by EFA
TM
Platform 1
Company Update, 6 November 2015
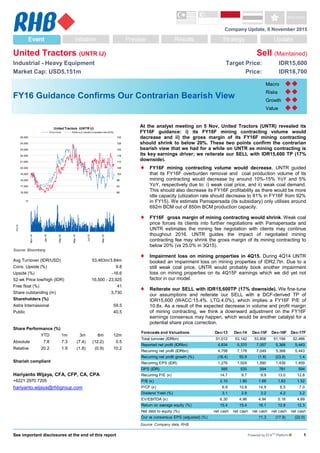
United Tractors (UNTR IJ) Sell (Maintained)
Industrial - Heavy Equipment Target Price: IDR15,600
Market Cap: USD5,151m Price: IDR18,700
FY16 Guidance Confirms Our Contrarian Bearish View
Macro
2
.
0
0
Risks
2
.
0
0
Growth
2
.
0
0
Value
2
.
0
0
83
88
93
98
103
108
113
118
123
128
133
15,000
16,000
17,000
18,000
19,000
20,000
21,000
22,000
23,000
24,000
25,000
United Tractors (UNTR IJ)
Price Close Relative to Jakarta Composite Index(RHS)
2
4
6
8
10
12
Nov-14
Jan-15
Mar-15
May-15
Jul-15
Sep-15
Volm
Source: Bloomberg
Avg Turnover (IDR/USD) 53,463m/3.84m
Cons. Upside (%) 9.8
Upside (%) -16.6
52-wk Price low/high (IDR) 16,500 - 23,925
Free float (%) 41
Share outstanding (m) 3,730
Shareholders (%)
Astra Internasional 59.5
Public 40.5
Share Performance (%)
YTD 1m 3m 6m 12m
Absolute 7.8 7.3 (7.4) (12.2) 0.5
Relative 20.2 1.9 (1.8) (0.9) 10.2
Shariah compliant
Hariyanto Wijaya, CFA, CFP, CA, CPA
+6221 2970 7205
hariyanto.wijaya@rhbgroup.com
Forecasts and Valuations Dec-13 Dec-14 Dec-15F Dec-16F Dec-17F
Total turnover (IDRbn) 51,012 53,142 53,806 51,194 52,466
Reported net profit (IDRbn) 4,834 5,370 7,057 5,368 5,443
Recurring net profit (IDRbn) 4,758 7,178 7,049 5,368 5,443
Recurring net profit growth (%) (16.4) 50.9 (1.8) (23.8) 1.4
Recurring EPS (IDR) 1,276 1,924 1,890 1,439 1,459
DPS (IDR) 585 535 594 781 594
Recurring P/E (x) 14.7 9.7 9.9 13.0 12.8
P/B (x) 2.10 1.90 1.68 1.63 1.52
P/CF (x) 6.9 10.8 14.9 6.5 7.0
Dividend Yield (%) 3.1 2.9 3.2 4.2 3.2
EV/EBITDA (x) 6.30 4.96 4.94 5.18 4.69
Return on average equity (%) 15.4 15.4 18.1 12.8 12.3
Net debt to equity (%) net cash net cash net cash net cash net cash
Our vs consensus EPS (adjusted) (%) 11.3 (17.9) (22.0)
Source: Company data, RHB
At the analyst meeting on 5 Nov, United Tractors (UNTR) revealed its
FY16F guidance: i) its FY16F mining contracting volume would
decrease and ii) the gross margin of its FY16F mining contracting
should shrink to below 20%. These two points confirm the contrarian
bearish view that we had for a while on UNTR as mining contracting is
its key earnings driver; we reiterate our SELL with IDR15,600 TP (17%
downside).
FY16F mining contracting volume would decrease. UNTR guided
that its FY16F overburden removal and coal production volume of its
mining contracting would decrease by around 10%-15% YoY and 5%
YoY, respectively due to: i) weak coal price, and ii) weak coal demand.
This should also decrease its FY16F profitability as there would be more
idle capacity (utiization rate should decrease to 81% in FY16F from 92%
in FY15). We estimate Pamapersada (its subsidiary) only utilises around
692m BCM out of 850m BCM production capacity.
FY16F gross margin of mining contracting would shrink. Weak coal
price forces its clients into further negotiations with Pamapersada and
UNTR estimates the mining fee negotation with clients may continue
thoughout 2016. UNTR guides the impact of negotiated mining
contracting fee may shrink the gross margin of its mining contracting to
below 20% (vs 25.0% in 3Q15).
Impairment loss on mining properties in 4Q15. During 4Q14 UNTR
booked an impairment loss on mining properties of IDR2.7tn. Due to a
still weak coal price, UNTR would probably book another impairment
loss on mining properties on its 4Q15F earnings which we did yet not
factor in our model.
Reiterate our SELL with IDR15,600TP (17% downside). We fine-tune
our assumptions and reiterate our SELL with a DCF-derived TP of
IDR15,600 (WACC:15.4%. LTG:4.0%), which implies a FY16F P/E of
10.8x. As a result of the expected decrease in volume and profit margin
of mining contracting, we think a downward adjustment on the FY16F
earnings consensus may happen, which would be another catalyst for a
potential share price correction.
2. United Tractors (UNTR IJ)
6 November 2015
See important disclosures at the end of this report 2
United Tractors At a Glance
Figure 1: United Tractor’s revenue breakdown (FY15F). Figure 2: United Tractor’s gross profit breakdown (FY15F)
Title:
Source:
Please fill in the values above to have them entered in your r
Construction
machinery
28%
Mining
contracting
59%
Coal Mining
10% Acset
3%
Construction
machinery
31%
Mining
contracting
62% Coal Mining
4%
Acset
3%
Source: RHB Source: RHB
Figure 3: Komatsu’s monthly data points to weaker sales Figure 4: Mining contracting - overburden removal volume
should weaken in 4Q15
Title:
Source:
Please fill in the values above to have them entered in your r
0
100
200
300
400
500
600
Jan-13
Feb-13
Mar-13
Apr-13
May-13
Jun-13
Jul-13
Aug-13
Sep-13
Oct-13
Nov-13
Dec-13
Jan-14
Feb-14
Mar-14
Apr-14
May-14
Jun-14
Jul-14
Aug-14
Sep-14
Oct-14
Nov-14
Dec-14
Jan-15
Feb-15
Mar-15
Apr-15
May-15
Jun-15
Jul-15
Aug-15
Sep-15
(Units)
Mining Forestry Construction Agro
-20%
-10%
0%
10%
20%
0
20
40
60
80
Jan-15
Feb-15
Mar-15
Apr-15
May-15
Jun-15
Jul-15
Aug-15
Sep-15
Overburden removal (m BCM) (LHS) yoy growth (RHS)
Source: Company data Source: Company data, RHB
Figure 5: Mining contracting - coal production volume should
weaken in 4Q15 as indicated by September’s volume
Figure 6: United Tractor’s gross margins trend
(after elimination)
Title:
Source:
Please fill in the values above to have them entered in your re
-20.0%
-10.0%
0.0%
10.0%
20.0%
0
2
4
6
8
10
12
Jan-15
Feb-15
Mar-15
Apr-15
May-15
Jun-15
Jul-15
Aug-15
Sep-15
Coal Production (m tonnes) (LHS) yoy growth (RHS)
15.0%
18.0%
21.0%
24.0%
27.0%
30.0%
FY11 FY12 FY13 FY14 FY15F FY16F FY17F
Construction machinery Mining contracting
Consolidated gross margin
Source: Company data, RHB Source: Company data, RHB
5. United Tractors (UNTR IJ)
6 November 2015
See important disclosures at the end of this report 5
Financial Exhibits
Profit & Loss (IDRbn) Dec-13 Dec-14 Dec-15F Dec-16F Dec-17F
Total turnover 51,012 53,142 53,806 51,194 52,466
Cost of sales (41,495) (41,072) (41,671) (40,789) (41,895)
Gross profit 9,517 12,070 12,135 10,405 10,570
Gen & admin expenses (1,995) (2,555) (2,659) (2,525) (2,620)
Selling expenses (781) (649) (646) (563) (577)
Operating profit 6,741 8,866 8,831 7,317 7,373
Operating EBITDA 10,877 12,784 12,950 11,832 12,279
Depreciation of fixed assets (4,136) (3,918) (4,119) (4,515) (4,906)
Operating EBIT 6,741 8,866 8,831 7,317 7,373
Net income from investments 79 70 75 93 93
Interest income 270 432 402 414 519
Interest expense (287) (277) (257) (257) (257)
Exchange gains (319) 5 727 (28) -
Exceptional income - net 109 207 94 - -
Other non-recurring income (5) (2,682) (83) - -
Pre-tax profit 6,588 6,622 9,789 7,539 7,727
Taxation (1,789) (1,782) (2,717) (2,123) (2,203)
Minority interests 35 530 (15) (48) (80)
Profit after tax & minorities 4,834 5,370 7,057 5,368 5,443
Reported net profit 4,834 5,370 7,057 5,368 5,443
Recurring net profit 4,758 7,178 7,049 5,368 5,443
Source: Company data, RHB
Cash flow (IDRbn) Dec-13 Dec-14 Dec-15F Dec-16F Dec-17F
Operating profit 6,741 8,866 8,831 7,317 7,373
Depreciation & amortisation 4,136 3,918 4,119 4,515 4,906
Change in working capital 2,486 (1,543) (5,721) 918 (343)
Other operating cash flow (1,501) (3,163) 12 (32) (65)
Operating cash flow 11,863 8,078 7,241 12,718 11,870
Interest received 270 432 402 414 519
Interest paid (287) (277) (257) (257) (257)
Tax paid (1,789) (1,782) (2,717) (2,123) (2,203)
Cash flow from operations 10,057 6,452 4,669 10,752 9,928
Capex 8,764 (1,736) (3,600) (3,500) (3,500)
Other investing cash flow (12,477) 1,942 381 (775) (854)
Cash flow from investing activities (3,713) 206 (3,219) (4,275) (4,354)
Dividends paid (2,154) (2,012) (2,217) (2,913) (2,216)
Increase in debt (2,076) (1,904) 1 (0) 0
Other financing cash flow 1,068 (985) 335 (928) 466
Cash flow from financing activities (3,161) (4,901) (1,881) (3,841) (1,751)
Cash at beginning of period 3,995 7,936 10,060 10,356 12,964
Total cash generated 3,183 1,757 (431) 2,636 3,824
Forex effects (319) 5 727 (28) -
Implied cash at end of period 6,858 9,698 10,356 12,964 16,788
Source: Company data, RHB
6. United Tractors (UNTR IJ)
6 November 2015
See important disclosures at the end of this report 6
Financial Exhibits
Balance Sheet (IDRbn) Dec-13 Dec-14 Dec-15F Dec-16F Dec-17F
Total cash and equivalents 7,936 10,060 10,356 12,964 16,788
Inventories 6,176 7,770 6,202 6,071 6,236
Accounts receivable 11,815 13,113 12,462 11,857 12,152
Other current assets 1,887 2,637 1,598 1,262 1,314
Total current assets 27,814 33,580 30,618 32,154 36,489
Total investments 670 1,606 770 823 877
Tangible fixed assets 14,574 13,625 13,106 12,091 10,685
Intangible assets 228 364 245 223 243
Total other assets 14,076 11,117 11,751 12,572 13,430
Total non-current assets 29,548 26,712 25,872 25,709 25,235
Total assets 57,362 60,292 56,489 57,863 61,724
Short-term debt 1,641 1,279 1,279 1,279 1,279
Accounts payable 10,582 11,965 3,996 3,911 4,017
Other current liabilities 2,338 3,054 2,044 1,975 2,037
Total current liabilities 14,561 16,298 7,319 7,165 7,333
Total long-term debt 3,289 2,109 2,109 2,109 2,109
Other liabilities 3,864 3,308 3,629 3,941 4,325
Total non-current liabilities 7,153 5,417 5,738 6,050 6,434
Total liabilities 21,713 21,715 13,057 13,215 13,767
Share capital 933 933 933 933 933
Retained earnings reserve 21,063 24,420 29,261 31,716 34,943
Other reserves 11,224 11,307 11,307 10,020 10,021
Shareholders' equity 33,220 36,660 41,501 42,669 45,897
Minority interests 2,429 1,917 1,932 1,979 2,060
Other equity - - - (0) -
Total equity 35,649 38,577 43,432 44,648 47,956
Total liabilities & equity 57,362 60,292 56,489 57,863 61,724
Source: Company data, RHB
Key Ratios (IDR) Dec-13 Dec-14 Dec-15F Dec-16F Dec-17F
Revenue growth (%) (8.8) 4.2 1.2 (4.9) 2.5
Operating profit growth (%) (10.9) 31.5 (0.4) (17.1) 0.8
Net profit growth (%) (16.4) 11.1 31.4 (23.9) 1.4
EPS growth (%) (18.2) 11.1 31.4 (23.9) 1.4
BVPS growth (%) 12.1 10.4 13.2 2.8 7.6
Operating margin (%) 13.2 16.7 16.4 14.3 14.1
Net profit margin (%) 9.5 10.1 13.1 10.5 10.4
Return on average assets (%) 9.0 9.1 12.1 9.4 9.1
Return on average equity (%) 15.4 15.4 18.1 12.8 12.3
Net debt to equity (%) (8.4) (17.3) (16.0) (21.4) (27.9)
DPS 585 535 594 781 594
Recurrent cash flow per share 2,696 1,730 1,252 2,883 2,662
Source: Company data, RHB
7. United Tractors (UNTR IJ)
6 November 2015
See important disclosures at the end of this report 7
SWOT Analysis
Good corporate governance practices
Delivering good quality services, which allows it to
maintain its position as the market leader in heavy
equipment and mining contracting
Competitive advantage in selling to the Astra group
Indonesian
Government’s
programme to
gradually
reduce coal
production
Sizable
exposure to the
coal industry,
which has a
bleak price
outlook
Sizable net
cash position,
which could be
used for
inorganic
growth by
acquiring
companies
Opportunity to
enter the coal-
fired power
plant market,
which could
bring synergy
with its own
coal mining and
coal mining
contractor
businesses
Its heavy equipment business has sizable exposure
to the coal sector
Production and delivery cost of its owned coal
business is higher than the selling price
-30%
-21%
-13%
-4%
5%
14%
23%
31%
40%
0.0
2.0
4.0
6.0
8.0
10.0
12.0
14.0
16.0
Jan-13
Jan-14
Jan-15
Jan-16
Jan-17
P/E (x) vs EPS growth
P/E(x) (lhs) EPSgrowth (rhs)
0%
5%
10%
15%
20%
25%
0.0
0.5
1.0
1.5
2.0
2.5
Jan-13
Jan-14
Jan-15
Jan-16
Jan-17
P/BV (x) vs ROAE
P/B (x) (lhs) Return on average equity (rhs)
Source: Company data, RHB Source: Company data, RHB
Company Profile
United Tractors (UNTR) is the mining and construction arm of Astra International (ASII). The principal activities of UNTR and its
subsidiaries include sales and rental of heavy equipment and related after sales services; coal mining and mining contracting;
engineering, planning, assembling and manufacturing components of machinery, tools, parts and heavy equipment; vessel construction
and vessel related repair services; and vessel charter and shipping services; and construction contractor. The main product of its
heavy equipment is Komatsu. Pama Persada engages in mining contracting business. Acset Indonusa (ACST) is a construction
company, which focuses on developing commercial, residential and industrial buildings.
8. United Tractors (UNTR IJ)
6 November 2015
See important disclosures at the end of this report 8
Recommendation Chart
13,000
18,000
23,000
28,000
33,000
38,000
Nov-10 Feb-12 May-13 Aug-14
Price Close
na
25,478
25,800
30,200
30,900
33,300
19,700
19,700
18,000
15,600
Recommendations & Target Price
Buy Neutral Sell Trading
Buy
Take Profit Not Rated
Source: RHB, Bloomberg
Date Recommendation Target Price Price
2015-10-30 Sell 15,600 18,100
2015-07-27 Sell 15,600 18,100
2013-07-31 Neutral 18,000 16,800
2013-05-20 Neutral 19,700 16,950
2013-02-28 Neutral 19,700 19,300
2012-10-31 Sell 19,700 21,100
2012-03-16 Buy 33,300 29,400
2012-02-27 Buy 33,300 27,350
2012-01-25 Buy 33,300 28,100
2011-10-31 Buy 30,900 24,600
Source : RHB, Bloomberg
9. 9
RHB Guide to Investment Ratings
Buy: Share price may exceed 10% over the next 12 months
Trading Buy: Share price may exceed 15% over the next 3 months, however longer-term outlook remains uncertain
Neutral: Share price may fall within the range of +/- 10% over the next 12 months
Take Profit: Target price has been attained. Look to accumulate at lower levels
Sell: Share price may fall by more than 10% over the next 12 months
Not Rated: Stock is not within regular research coverage
Investment Research Disclaimers
RHB has issued this report for information purposes only. This report is intended for circulation amongst RHB and its affiliates’ clients generally or such
persons as may be deemed eligible by RHB to receive this report and does not have regard to the specific investment objectives, financial situation and
the particular needs of any specific person who may receive this report. This report is not intended, and should not under any circumstances be construed
as, an offer or a solicitation of an offer to buy or sell the securities referred to herein or any related financial instruments.
This report may further consist of, whether in whole or in part, summaries, research, compilations, extracts or analysis that has been prepared by RHB’s
strategic, joint venture and/or business partners. No representation or warranty (express or implied) is given as to the accuracy or completeness of such
information and accordingly investors should make their own informed decisions before relying on the same.
This report is not directed to, or intended for distribution to or use by, any person or entity who is a citizen or resident of or located in any locality, state,
country or other jurisdiction where such distribution, publication, availability or use would be contrary to the applicable laws or regulations. By accepting
this report, the recipient hereof (i) represents and warrants that it is lawfully able to receive this document under the laws and regulations of the jurisdiction
in which it is located or other applicable laws and (ii) acknowledges and agrees to be bound by the limitations contained herein. Any failure to comply with
these limitations may constitute a violation of applicable laws.
All the information contained herein is based upon publicly available information and has been obtained from sources that RHB believes to be reliable and
correct at the time of issue of this report. However, such sources have not been independently verified by RHB and/or its affiliates and this report does not
purport to contain all information that a prospective investor may require. The opinions expressed herein are RHB’s present opinions only and are subject
to change without prior notice. RHB is not under any obligation to update or keep current the information and opinions expressed herein or to provide the
recipient with access to any additional information. Consequently, RHB does not guarantee, represent or warrant, expressly or impliedly, as to the
adequacy, accuracy, reliability, fairness or completeness of the information and opinion contained in this report. Neither RHB (including its officers,
directors, associates, connected parties, and/or employees) nor does any of its agents accept any liability for any direct, indirect or consequential losses,
loss of profits and/or damages that may arise from the use or reliance of this research report and/or further communications given in relation to this report.
Any such responsibility or liability is hereby expressly disclaimed.
Whilst every effort is made to ensure that statement of facts made in this report are accurate, all estimates, projections, forecasts, expressions of opinion
and other subjective judgments contained in this report are based on assumptions considered to be reasonable and must not be construed as a
representation that the matters referred to therein will occur. Different assumptions by RHB or any other source may yield substantially different results
and recommendations contained on one type of research product may differ from recommendations contained in other types of research. The
performance of currencies may affect the value of, or income from, the securities or any other financial instruments referenced in this report. Holders of
depositary receipts backed by the securities discussed in this report assume currency risk. Past performance is not a guide to future performance. Income
from investments may fluctuate. The price or value of the investments to which this report relates, either directly or indirectly, may fall or rise against the
interest of investors.
This report does not purport to be comprehensive or to contain all the information that a prospective investor may need in order to make an investment
decision. The recipient of this report is making its own independent assessment and decisions regarding any securities or financial instruments referenced
herein. Any investment discussed or recommended in this report may be unsuitable for an investor depending on the investor’s specific investment
objectives and financial position. The material in this report is general information intended for recipients who understand the risks of investing in financial
instruments. This report does not take into account whether an investment or course of action and any associated risks are suitable for the recipient. Any
recommendations contained in this report must therefore not be relied upon as investment advice based on the recipient's personal circumstances.
Investors should make their own independent evaluation of the information contained herein, consider their own investment objective, financial situation
and particular needs and seek their own financial, business, legal, tax and other advice regarding the appropriateness of investing in any securities or the
investment strategies discussed or recommended in this report.
This report may contain forward-looking statements which are often but not always identified by the use of words such as “believe”, “estimate”, “intend”
and “expect” and statements that an event or result “may”, “will” or “might” occur or be achieved and other similar expressions. Such forward-looking
statements are based on assumptions made and information currently available to RHB and are subject to known and unknown risks, uncertainties and
other factors which may cause the actual results, performance or achievement to be materially different from any future results, performance or
achievement, expressed or implied by such forward-looking statements. Caution should be taken with respect to such statements and recipients of this
report should not place undue reliance on any such forward-looking statements. RHB expressly disclaims any obligation to update or revise any forward-
looking statements, whether as a result of new information, future events or circumstances after the date of this publication or to reflect the occurrence of
unanticipated events.
10. 10
The use of any website to access this report electronically is done at the recipient’s own risk, and it is the recipient’s sole responsibility to take precautions
to ensure that it is free from viruses or other items of a destructive nature. This report may also provide the addresses of, or contain hyperlinks to,
websites. RHB takes no responsibility for the content contained therein. Such addresses or hyperlinks (including addresses or hyperlinks to RHB own
website material) are provided solely for the recipient’s convenience. The information and the content of the linked site do not in any way form part of this
report. Accessing such website or following such link through the report or RHB website shall be at the recipient’s own risk.
This report may contain information obtained from third parties. Third party content providers do not guarantee the accuracy, completeness, timeliness or
availability of any information and are not responsible for any errors or omissions (negligent or otherwise), regardless of the cause, or for the results
obtained from the use of such content. Third party content providers give no express or implied warranties, including, but not limited to, any warranties of
merchantability or fitness for a particular purpose or use. Third party content providers shall not be liable for any direct, indirect, incidental, exemplary,
compensatory, punitive, special or consequential damages, costs, expenses, legal fees, or losses (including lost income or profits and opportunity costs) in
connection with any use of their content.
The research analysts responsible for the production of this report hereby certifies that the views expressed herein accurately and exclusively reflect his or
her personal views and opinions about any and all of the issuers or securities analysed in this report and were prepared independently and autonomously.
The research analysts that authored this report are precluded by RHB in all circumstances from trading in the securities or other financial instruments
referenced in the report, or from having an interest in the company(ies) that they cover.
RHB and/or its affiliates and/or their directors, officers, associates, connected parties and/or employees, may have, or have had, interests in the securities
or qualified holdings, in subject company(ies) mentioned in this report or any securities related thereto and may from time to time add to or dispose of, or
may be materially interested in, any such securities. Further, RHB and/or its affiliates may have, or have had, business relationships with the subject
company(ies) mentioned in this report and may from time to time seek to provide investment banking or other services to the subject company(ies)
referred to in this research report. As a result, investors should be aware that a conflict of interest may exist.
The contents of this report is strictly confidential and may not be copied, reproduced, published, distributed, transmitted or passed, in whole or in part, to
any other person without the prior express written consent of RHB and/or its affiliates. This report has been delivered to RHB and its affiliates’ clients for
information purposes only and upon the express understanding that such parties will use it only for the purposes set forth above. By electing to view or
accepting a copy of this report, the recipients have agreed that they will not print, copy, videotape, record, hyperlink, download, or otherwise attempt to
reproduce or re-transmit (in any form including hard copy or electronic distribution format) the contents of this report. RHB and/or its affiliates accepts no
liability whatsoever for the actions of third parties in this respect.
The contents of this report are subject to copyright. Please refer to Restrictions on Distribution below for information regarding the distributors of this
report. Recipients must not reproduce or disseminate any content or findings of this report without the express permission of RHB and the distributors.
The securities mentioned in this publication may not be eligible for sale in some states or countries or certain categories of investors. The recipient of this
report should have regard to the laws of the recipient’s place of domicile when contemplating transactions in the securities or other financial instruments
referred to herein. The securities discussed in this report may not have been registered in such jurisdiction. Without prejudice to the foregoing, the
recipient is to note that additional disclaimers, warnings or qualifications may apply based on geographical location of the person or entity receiving this
report.
RESTRICTIONS ON DISTRIBUTION
Malaysia
This report is issued and distributed in Malaysia by RHB Research Institute Sdn Bhd. The views and opinions in this report are our own as of the date
hereof and is subject to change. If the Financial Services and Markets Act of the United Kingdom or the rules of the Financial Conduct Authority apply to a
recipient, our obligations owed to such recipient therein are unaffected. RHB Research Institute Sdn Bhd has no obligation to update its opinion or the
information in this report.
Thailand
This report is issued and distributed in the Kingdom of Thailand by RHB Securities (Thailand) PCL, a licensed securities company that is authorised by the
Ministry of Finance, regulated by the Securities and Exchange Commission of Thailand and is a member of the Stock Exchange of Thailand. The Thai
Institute of Directors Association has disclosed the Corporate Governance Report of Thai Listed Companies made pursuant to the policy of the Securities
and Exchange Commission of Thailand. RHB Securities (Thailand) PCL does not endorse, confirm nor certify the result of the Corporate Governance
Report of Thai Listed Companies.
Indonesia
This report is issued and distributed in Indonesia by PT RHB Securities Indonesia. This research does not constitute an offering document and it should
not be construed as an offer of securities in Indonesia. Any securities offered or sold, directly or indirectly, in Indonesia or to any Indonesian citizen or
corporation (wherever located) or to any Indonesian resident in a manner which constitutes a public offering under Indonesian laws and regulations must
comply with the prevailing Indonesian laws and regulations.
11. 11
Singapore
This report is issued and distributed in Singapore by RHB Research Institute Singapore Pte Ltd and it may only be distributed in Singapore to accredited
investors, expert investors and institutional investors as defined in the Financial Advisers Regulations and the Securities and Futures Act (Chapter 289), as
amended from time to time. By virtue of distribution to these categories of investors, RHB Research Institute Singapore Pte Ltd and its representatives are
not required to comply with Section 36 of the Financial Advisers Act (Chapter 110) (Section 36 relates to disclosure of RHB Research Institute Singapore
Pte Ltd ’s interest and/or its representative's interest in securities). Recipients of this report in Singapore may contact RHB Research Institute Singapore
Pte Ltd in respect of any matter arising from or in connection with the report.
Hong Kong
This report is issued and distributed in Hong Kong by RHB Securities Hong Kong Limited (興業僑豐證券有限公司) (CE No.: ADU220) (“RHBSHK”)
which is licensed in Hong Kong by the Securities and Futures Commission for Type 1 (dealing in securities) and Type 4 (advising on securities) regulated
activities. Any investors wishing to purchase or otherwise deal in the securities covered in this report should contact RHB Securities Hong Kong Limited.
United States
This report was prepared by RHB and is being distributed solely and directly to “major” U.S. institutional investors as defined under, and pursuant to, the
requirements of Rule 15a-6 under the U.S. Securities and Exchange Act of 1934, as amended (the “Exchange Act”). RHB is not registered as a broker-
dealer in the United States and does not offer brokerage services to U.S. persons. Any order for the purchase or sale of the securities discussed herein
that are listed on Bursa Malaysia Securities Berhad must be placed with and through Auerbach Grayson (“AG”). Any order for the purchase or sale of all
other securities discussed herein must be placed with and through such other registered U.S. broker-dealer as appointed by RHB from time to time as
required by the Exchange Act Rule 15a-6.
This report is confidential and not intended for distribution to, or use by, persons other than the recipient and its employees, agents and advisors, as
applicable.
Additionally, where research is distributed via Electronic Service Provider, the analysts whose names appear in this report are not registered or qualified
as research analysts in the United States and are not associated persons of Auerbach Grayson AG or such other registered U.S. broker-dealer as
appointed by RHB from time to time and therefore may not be subject to any applicable restrictions under Financial Industry Regulatory Authority
(“FINRA”) rules on communications with a subject company, public appearances and personal trading.
Investing in any non-U.S. securities or related financial instruments discussed in this research report may present certain risks. The securities of non-U.S.
issuers may not be registered with, or be subject to the regulations of, the U.S. Securities and Exchange Commission. Information on non-U.S. securities
or related financial instruments may be limited. Foreign companies may not be subject to audit and reporting standards and regulatory requirements
comparable to those in the United States.
The financial instruments discussed in this report may not be suitable for all investors.
Transactions in foreign markets may be subject to regulations that differ from or offer less protection than those in the United States.
OWNERSHIP AND MATERIAL CONFLICTS OF INTEREST
Malaysia
RHB does not have qualified shareholding (1% or more) in the subject company (ies) covered in this report except for:
a) -
RHB and/or its subsidiaries are not liquidity providers or market makers for the subject company (ies) covered in this report except for:
a) -
RHB and/or its subsidiaries have not participated as a syndicate member in share offerings and/or bond issues in securities covered in this report in the
last 12 months except for:
a) -
RHB has not provided investment banking services to the company/companies covered in this report in the last 12 months except for:
a) -
Thailand
RHB Securities (Thailand) PCL and/or its directors, officers, associates, connected parties and/or employees, may have, or have had, interests and/or
commitments in the securities in subject company(ies) mentioned in this report or any securities related thereto. Further, RHB Securities (Thailand) PCL
may have, or have had, business relationships with the subject company(ies) mentioned in this report. As a result, investors should exercise their own
judgment carefully before making any investment decisions.
Indonesia
PT RHB Securities Indonesia is not affiliated with the subject company(ies) covered in this report both directly or indirectly as per the definitions of
12. 12
affiliation above.
Pursuant to the Capital Market Law (Law Number 8 Year 1995) and the supporting regulations thereof, what constitutes as affiliated parties are as follows:
1. Familial relationship due to marriage or blood up to the second degree, both horizontally or vertically;
2. Affiliation between parties to the employees, Directors or Commissioners of the parties concerned;
3. Affiliation between 2 companies whereby one or more member of the Board of Directors or the Commissioners are the same;
4. Affiliation between the Company and the parties, both directly or indirectly, controlling or being controlled by the Company;
5. Affiliation between 2 companies which are controlled, directly or indirectly, by the same party; or
6. Affiliation between the Company and the main Shareholders.
PT RHB Securities Indonesia is not an insider as defined in the Capital Market Law and the information contained in this report is not considered as insider
information prohibited by law.
Insider means:
a. a commissioner, director or employee of an Issuer or Public Company;
b. a substantial shareholder of an Issuer or Public Company;
c. an individual, who because of his position or profession, or because of a business relationship with an Issuer or Public Company, has access to
inside information; and
d. an individual who within the last six months was a Person defined in letters a, b or c, above.
Singapore
RHB Research Institute Singapore Pte Ltd and/or its subsidiaries and/or associated companies do not make a market in any securities covered in this
report, except for:
(a) -
The staff of RHB Research Institute Singapore Pte Ltd and its subsidiaries and/or its associated companies do not serve on any board or trustee positions
of any issuer whose securities are covered in this report, except for:
(a) -
RHB Research Institute Singapore Pte Ltd and/or its subsidiaries and/or its associated companies do not have and have not within the last 12 months had
any corporate finance advisory relationship with the issuer of the securities covered in this report or any other relationship (including a shareholding of 1%
or more in the securities covered in this report) that may create a potential conflict of interest, except for:
(a) -
Hong Kong
RHBSHK or any of its group companies may have financial interests in in relation to an issuer or a new listing applicant (as the case may be) the securities
in respect of which are reviewed in the report, and such interests aggregate to an amount equal to or more than (a) 1% of the subject company’s market
capitalization (in the case of an issuer as defined under paragraph 16 of the Code of Conduct for Persons Licensed by or Registered with the Securities
and Futures Commission (the “Code of Conduct”); and/or (b) an amount equal to or more than 1% of the subject company’s issued share capital, or issued
units, as applicable (in the case of a new listing applicant as defined in the Code of Conduct). Further, the analysts named in this report or their associates
may have financial interests in relation to an issuer or a new listing applicant (as the case may be) in the securities which are reviewed in the report.
RHBSHK or any of its group companies may make a market in the securities covered by this report.
RHBSHK or any of its group companies may have analysts or their associates, individual(s) employed by or associated with RHBSHK or any of its group
companies serving as an officer of the company or any of the companies covered by this report.
RHBSHK or any of its group companies may have received compensation or a mandate for investment banking services to the company or any of the
companies covered by this report within the past 12 months.
Note: The reference to “group companies” above refers to a group company of RHBSHK that carries on a business in Hong Kong in (a) investment
banking; (b) proprietary trading or market making; or (c) agency broking, in relation to securities listed or traded on The Stock Exchange of Hong Kong
Limited.
13. 13
Kuala Lumpur Hong Kong Singapore
RHB Research Institute Sdn Bhd
Level 11, Tower One, RHB Centre
Jalan Tun Razak
Kuala Lumpur
Malaysia
Tel : +(60) 3 9280 2185
Fax : +(60) 3 9284 8693
RHB Securities Hong Kong Ltd.
12
th
Floor
World-Wide House
19 Des Voeux Road
Central, Hong Kong
Tel : +(852) 2525 1118
Fax : +(852) 2810 0908
RHB Research Institute Singapore
Pte Ltd (formerly known as DMG & Partners Research
Pte Ltd)
10 Collyer Quay
#09-08 Ocean Financial Centre
Singapore 049315
Tel : +(65) 6533 1818
Fax : +(65) 6532 6211
Jakarta Shanghai Bangkok
PT RHB Securities Indonesia
Wisma Mulia, 20th Floor
Jl. Jenderal Gatot Subroto No. 42
Jakarta 12710, Indonesia
Tel : +(6221) 2783 0888
Fax : +(6221) 2783 0777
RHB (China) Investment Advisory Co. Ltd.
Suite 4005, CITIC Square
1168 Nanjing West Road
Shanghai 20041
China
Tel : +(8621) 6288 9611
Fax : +(8621) 6288 9633
RHB Securities (Thailand) PCL
10th Floor, Sathorn Square Office Tower
98, North Sathorn Road, Silom
Bangrak, Bangkok 10500
Thailand
Tel: +(66) 2 862 9999
Fax : +(66) 2 862 9799