
Recommended
Recommended
More Related Content
What's hot
What's hot (19)
Similar to Assessing the Readiness to Adopt E-Learning among Industrial Training Institute Students in Tamil Nadu
Similar to Assessing the Readiness to Adopt E-Learning among Industrial Training Institute Students in Tamil Nadu (20)
More from IOSRJBM
More from IOSRJBM (20)
Recently uploaded
Recently uploaded (20)
Assessing the Readiness to Adopt E-Learning among Industrial Training Institute Students in Tamil Nadu
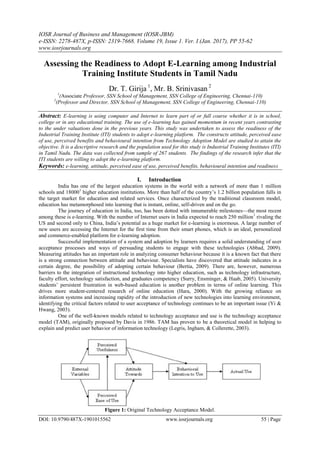
- 1. IOSR Journal of Business and Management (IOSR-JBM) e-ISSN: 2278-487X, p-ISSN: 2319-7668. Volume 19, Issue 1. Ver. I (Jan. 2017), PP 55-62 www.iosrjournals.org DOI: 10.9790/487X-1901015562 www.iosrjournals.org 55 | Page Assessing the Readiness to Adopt E-Learning among Industrial Training Institute Students in Tamil Nadu Dr. T. Girija 1 , Mr. B. Srinivasan 2 1 (Associate Professor, SSN School of Management, SSN College of Engineering, Chennai-110) 2 (Professor and Director, SSN School of Management, SSN College of Engineering, Chennai-110) Abstract: E-learning is using computer and Internet to learn part of or full course whether it is in school, college or in any educational training. The use of e-learning has gained momentum in recent years contrasting to the under valuations done in the previous years. This study was undertaken to assess the readiness of the Industrial Training Institute (ITI) students to adopt e-learning platform. The constructs attitude, perceived ease of use, perceived benefits and behavioural intention from Technology Adoption Model are studied to attain the objective. It is a descriptive research and the population used for this study is Industrial Training Institutes (ITI) in Tamil Nadu. The data was collected from sample of 267 students. The findings of the research infer that the ITI students are willing to adopt the e-learning platform. Keywords: e-learning, attitude, perceived ease of use, perceived benefits, behavioural intention and readiness I. Introduction India has one of the largest education systems in the world with a network of more than 1 million schools and 180001 higher education institutions. More than half of the country’s 1.2 billion population falls in the target market for education and related services. Once characterized by the traditional classroom model, education has metamorphosed into learning that is instant, online, self-driven and on the go. The journey of education in India, too, has been dotted with innumerable milestones—the most recent among these is e-learning. With the number of Internet users in India expected to reach 250 million1 rivaling the US and second only to China, India’s potential as a huge market for e-learning is enormous. A large number of new users are accessing the Internet for the first time from their smart phones, which is an ideal, personalized and commerce-enabled platform for e-learning adoption. Successful implementation of a system and adoption by learners requires a solid understanding of user acceptance processes and ways of persuading students to engage with these technologies (Abbad, 2009). Measuring attitudes has an important role in analyzing consumer behaviour because it is a known fact that there is a strong connection between attitude and behaviour. Specialists have discovered that attitude indicates in a certain degree, the possibility of adopting certain behaviour (Bertia, 2009). There are, however, numerous barriers to the integration of instructional technology into higher education, such as technology infrastructure, faculty effort, technology satisfaction, and graduates competency (Surry, Ensminger, & Haab, 2005). University students’ persistent frustration in web-based education is another problem in terms of online learning. This drives more student-centered research of online education (Hara, 2000). With the growing reliance on information systems and increasing rapidity of the introduction of new technologies into learning environment, identifying the critical factors related to user acceptance of technology continues to be an important issue (Yi & Hwang, 2003). One of the well-known models related to technology acceptance and use is the technology acceptance model (TAM), originally proposed by Davis in 1986. TAM has proven to be a theoretical model in helping to explain and predict user behavior of information technology (Legris, Ingham, & Collerette, 2003). Figure 1: Original Technology Acceptance Model.
- 2. Assessing The Readiness To Adopt E-Learning Among Industrial Training Institute Students… DOI: 10.9790/487X-1901015562 www.iosrjournals.org 56 | Page Within TAM, perceived usefulness is defined as the degree to which a user believes that using the system will enhance his/her performance. Perceived ease of use is defined as the degree to which the user believes that using the system will be free from effort. Both perceived usefulness and perceived ease of use are modeled as having a significant impact on a user's attitude toward using the system (A). Behavioural intentions to use (BI) are modeled as a function of attitude toward using the system and perceived usefulness. Behavioural intentions to use then determine actual use. Research has shown that BI is the strongest predictor of actual use (Davis et al., 1989, Taylor and Todd, 1995). This study includes all the major aspects to understand the mentality and the readiness of the students towards the e-learning platform. To measure the readiness which is a qualitative element, Technology acceptance model is used. So the whole study is structured based around this model. II. Objectives 2.1. To measure the perception of benefits of the e- learning among Industrial Training Institute (ITI) students. 2.2 To measure perceived ease of use of the e-learning platform among ITI students. 2.3. To measure the overall attitude of the ITI students towards e-learning. 2.4. To ascertain if there is any relationship that exists among Perceived Benefits, Perceived Ease of Use, Perceived Self efficacy, Behavioural intention to use and Overall Attitude among ITI students. 2.5. To understand the influence of Socio economic and Demographic factors on the attitude towards e-learning in students III. Statement Of Problem The minimal educational qualification for ITI students is passing eighth standard. As e- learning is considered, it is a new technology in their academic environment. So it becomes essential to study the readiness of the students towards e- learning. So it becomes essential to evaluate the major constructs of TAM namely the perceived benefits, perceived ease of use, behavioural intention to use and attitude towards e- learning among ITI students. This will help in understanding the readiness of the ITI students towards the e-learning platform. IV. Literature Review Mehra and Omidian (2011), conducted a study to examine students attitude toward e-learning at Panjab university in India. Data was collected through a survey of 400 post graduate students. The results showed that 76.0% Students were significantly positive towards e-learning. It was about 82% of students perceived e- learning usefulness. About 57% of students intended to adopt e-learning. Further, enter regression analyses revealed a statistically – significant model for perceived usefulness of e-learning and intention to adopt e- learning as the best predictors of student’s attitude towards e- learning. Egbe Adewole-Odeshi (2014), in their study concluded that the students have a positive attitude towards e-learning because they perceive that it is easy to use and it is useful especially for their course work. Another interesting finding is that if there is easy accessibility to e-learning system then there would be a more favorable attitude towards its usage. Suresh Prabhu, P. Ramesh, R.(2013) conducted study among B.Ed., students studying in Tiruchengode of Tamil Nadu, India, that founded to have a highly favourable attitude towards e-learning which in turn gives a very high level of achievement for students. It has employed many demographic variables to find the difference in attitude of the students who are coming from different backgrounds and has given an observation that attitude of urban students is more positive than the students coming from the rural areas. Rhema and Miliszewska (2014), in their article presents findings on the experiences and perceptions of technology-supported learning gathered from engineering students at two Libyan universities. This study gives an interesting finding that the physical separation between the learner and the instructor tends to create a feeling of isolation on the part of the learner leading to negative attitudes. V. Research Gap Review of literature reveals that studies have been carried out on e-learning among university students, M.Ed Students and B.Ed students. Most of the studies used the TAM to study readiness towards e- learning. The studies are conducted to students with a minimum basic qualification of under graduation. As ITI students are considered their minimal education qualification is eighth standard. So this study “Assessing the readiness to adopt e-learning among ITI students in Tamil Nadu” is conducted to fill the gap that exist in earlier research and to understand the readiness of ITI students towards e- learning.
- 3. Assessing The Readiness To Adopt E-Learning Among Industrial Training Institute Students… DOI: 10.9790/487X-1901015562 www.iosrjournals.org 57 | Page VI. Methodology 6.1. Research Design Descriptive research design is used as it describes the characteristics of a population being studies. 6.2. Population and Sample The population that was taken for study is ITI students of Tamil Nadu. Four government and two private ITIs are taken for study. The sample taken for the study is 267 students. The technique used for selecting the sample is convenient sampling. 6.3. Source of data The study has used primary data. For collecting primary data structured questionnaire was framed with TAM constructs as base. This questionnaire was pilot tested and necessary corrections have been implemented. 6.4. Statistical tools Statistical tools namely correlation, chi square and percentage analysis are applied in relevant places to prove to obtain the objective. 6.5. Reliability The reliability test was done on a sample of 60 students, considering 10 students from each of ITI. Reliability co-efficient was calculated using the Cronbach’s alpha formula for each factor of outlet. Reliability is obtained and the same is given in following table Table: 1 Cronbach’s alpha, reliability test for various constructs S.No Scale Cronbach’s alpha No. of survey items 1 Computer knowledge 0.896 14 2 Attitude 0.803 7 3 Perceived Ease Of Use 0.710 4 4 Perceived Benefits 0.862 11 5 Behavioural Intention to Use 0.629 4 6 Perceived Self-Efficacy 0.842 7 A questionnaire was employed to measure different, underlying construct. The construct measured in the questionnaire were computer knowledge, attitude, perceived ease of use, perceived benefits, behavioural intention to use and perceived self-efficacy. Each construct consist of 14, 7, 4, 11, 4 and 7 questions respectively. The scale had a high level of internal consistency, as determined by a Cronbach’s alpha of 0.896, 0.803, 0.710, 0.862, 0.629, 0.842 respectively. 6.6. Validity The instrument has been found to have adequate face validity. VII. Analysis Descriptive analysis was conducted to understand demographic and socio economic profile of ITI students. Table: 2 Descriptive analysis of Demographic and Socio economic factors of ITI students S.No Sample Sub sample No. of Students % of Students 1 Gender Male 186 70 Female 81 30 2 Age Group Below 20 185 82 Above 20 67 31 3 Previous Qualification less than 10th 26 10 10th pass 123 46 12th pass 118 44 5 First generation graduate Yes 184 69 No 83 31 The results of descriptive analysis showed that there are 186 male students (70%) and 81 female students (30%). Among the students considered for the study 185 students (69%) fall below the age of 20 years, 67 students (31%) fall above the age of 20 years. As education qualification is considered 26 students (10%) have less than 10th qualification, 123 students (46%) have 10th pass qualification, 118 students (44%) have 12th pass qualification. The results of frequency analysis showed that 52 of the students (19%) have 3 members in their family, 143 of the students (54%) have 4 members in their family, and 72 of the students (27%) have more than 4 members in their family. The results of frequency analysis showed that 184 of the students (69%) are first generation graduates and 83 of the students (31%) are not first generation graduates.
- 4. Assessing The Readiness To Adopt E-Learning Among Industrial Training Institute Students… DOI: 10.9790/487X-1901015562 www.iosrjournals.org 58 | Page As e- learning is considered the level of understanding of the comments and instruction in the e- learning platform is important factor for obtaining utmost benefit of e-learning. Hence descriptive analysis is conducted to find out the medium of study of ITI students. Table: 3 Medium of study Sample Sub sample No. of students % of students Medium of study English 59 22 Tamil 208 78 The results showed that 208(78%) of the students chose Tamil language as the medium of study, 59(22%) of the students chose English as the medium of study. Majority of the students chose other language as the medium of study (78%). When e-platform is developed there should be option for change of language. This will enhance ITI students to follow the instructions given in e- learning. For e-learning, possession of laptop or desktop and Internet connection is essential. Hence the availability of the same is studied with descriptive analysis. Table: 4 Table showing availability of sources related to e-learning S.No Sample Sub sample No of students Percentage of students 1 Availability of PC at Home No Device 70 26 Laptop 178 67 Desktop 19 7 2 Internet at home for PC No connection 214 80 Low speed access 23 9 High speed access 30 11 3 No. of courses studied in the past using computers No course 184 69 1-2 course 68 25 3-4 course 15 6 The results of frequency analysis showed that 19(7%) of the students have desktop in their home, 178(67%) of the students have laptops in their home and 70(26%) of the students have no device in their home. Majority of the students have laptops or desktops in their home. That is favorable for e- learning. Further the analysis showed that 214(80%) of the students have no access to Internet at their home, 23(9%) of the students have low speed Internet at their home and 30(11%) of the students have high speed Internet at their home. So, e-learning providing institution should have Internet facilities where they can download and use it at their home. Downloading and uploading facilities becomes a vital requirement in e- learning, to facilitate the usage of e-commerce effectively. Further nowadays most of the students use smart phones with Internet or Data pack. So providing knowledge to them to use tethering and hotspot option as Wi-fi connection will be helpful for them to use e- learning in their comfortable place. Usage of computer for academic purpose is measured using number of courses done with computers. The results of frequency analysis showed that 183(69%) of the students have done no course in the past using computer, 68(25%) of the students have done 1-2 course using computer and 15(6%) of the students have done 3-4 courses using computer. As majority of the students have not used computers for their academic purpose so induction programme is essential before introducing e- learning. 7.1. Analysis related to objective 1 The first objective of the study is to measure the perception of benefits of the e-learning among ITI students. Eleven sentence were framed to measure perception of benefits and students were asked to rate their response on a five point scale. The percentage analysis brought out the following outcomes. Table: 5 Students’ perception of benefits that will accrue due to adoption of e-learning S.No Scales No. of Students Percentage of Students 1 Very high perception of benefit 124 46 2 High perception of benefit 92 34 3 Neutral 31 12 4 Weak perception of benefit 20 8 5 Very weak perception of befit 0 0 Total 267 100 Out of the total students considered for the study 46 percent of students have very high perception of benefits, 34 percent have high perception of benefits towards e-learning, 12 percent of students have neutral perception of benefits towards e-learning and only 8 perception have weak perception of benefits towards e- learning. Majority (80%) of the students have high perception of benefits towards e-learning. So it is obvious that majority of the students perceive that they will get high benefits when they adopt e-learning.
- 5. Assessing The Readiness To Adopt E-Learning Among Industrial Training Institute Students… DOI: 10.9790/487X-1901015562 www.iosrjournals.org 59 | Page 7.2. Analysis related to objective 2 The second objective of the study was to measure perceived ease of use. It is understood from the earlier studies that if the students perceive that the e-learning will be easy to use they were ready to use e-learning. The descriptive analysis interpreted the following results. Table: 6 Table showing students’ perceived ease of use of the e-learning platform S. No Scales No. of students Percentage of students 1 Very high perceived ease of use 52 19 2 High perceived ease of use 95 35 3 Neutral 63 24 4 Low perceived ease of use 39 15 5 Very low perceived ease of use 18 7 Total 267 100 Out of the total students considered for the study 19 percent of students have very high perceived ease of use, 35 percent have high perceived ease of use towards e-learning 12 percent of students have neutral perceived ease of use towards e-learning only 8 percent of students have low perceived ease of use towards e- learning. Majority (54%) of the students have high perceived ease of use in using the e-learning platform. On the other hand only 22% of the students have low perceived ease of use towards e- learning and 24 percent of them are neutral towards perceived ease of use. It is inferred that only minority of the students have low perceived ease of use. The induction programme for e-learning should make the use of e-learning easier. That will make the students react positive towards e- learning and the maximum benefit will be obtained from e- learning. 7.3 Analysis related to objective 3 The next objective was to measure the overall attitude of the ITI students towards e-learning. As this is one of the important construct of TAM, attitude of students towards e-learning is studied and recorded. Mostly earlier studies have recorded that students had a positive attitude towards e-learning. Table: 7 Students’ attitude towards e-learning S. No Scales No. of Students Percentage of Students 1 Very high positive attitude 90 34 2 High positive attitude 109 41 3 Neutral 36 13 4 Low positive attitude 32 12 5 Very low positive attitude 0 0 Total 267 100 As attitude towards e-learning is considered 34 percent of students have very high positive attitude, 41 percent have high positive attitude towards e-learning, 13 percent of students have neutral attitude towards e- learning and only 12 percent of students have low attitude towards e-learning. Majority (75%) of the students have high positive attitude towards e-learning. So it is inferred that students’ attitude towards e-learning platform is very favorable. 7.4. Analysis related to objective 4 The next objective was to ascertain if there is any relationship that exists among perceived benefits, perceived ease of use, perceived self efficacy, behavioural intention to use and overall attitude among ITI students. Correlation matrix used to obtain the relationship between the constructs. Table: 8 Co-relation between different constructs that influence e-learning among ITI students Perceived Ease of use Perceived Benefits Behavioural Intention to Use Perceived Self-Efficacy Attitude Perceived Ease of use Pearson Correlation 1 Sig. (2-tailed) N 267 Perceived Benefits Pearson Correlation .739** 1 Sig. (2-tailed) .000 N 267 267 Behavioural Intention to Use Pearson Correlation .552** .688** 1 Sig. (2-tailed) .000 .000 N 267 267 267 Perceived Self-Efficacy Pearson Correlation .656** .759** .617** 1 Sig. (2-tailed) .000 .000 .000 N 267 267 267 267
- 6. Assessing The Readiness To Adopt E-Learning Among Industrial Training Institute Students… DOI: 10.9790/487X-1901015562 www.iosrjournals.org 60 | Page Attitude Pearson Correlation .761** .790** .607** .683** 1 Sig. (2-tailed) .000 .000 .000 .000 N 267 267 267 267 267 7.4.1. Perceived Ease of Use vs. Perceived Benefits The correlation between perceived ease of use and perceived benefits established that there exists a moderate positive co-relation (0.739). The p value (0.000) indicates that the relationship is significant. 7.4.2. Behavioural Intention to Use vs. Perceived Ease of Use The correlation between perceived ease of use and behavioural intention to use established that there exists a moderate positive co-relation (0.552). The p value (0.000) indicates that the relationship is significant. 7.4.3. Behavioural Intention to Use vs. Perceived benefits When the correlation between behavioural intention to use and perceived benefits is studied, it is found that there exists a moderate positive co-relation (0.688) between both. The p value is 0.000, less than 0.05 indicating that the relationship is significant. 7.4.4. Perceived Self- Efficacy vs. Perceived Ease of Use When the correlation between perceived self-efficacy and perceived ease of use is studied, it is found that there exists a moderate positive co-relation (0.656) between both. The p value is 0.000, less than 0.05 indicating that the relationship is significant. 7.4.5. Perceived Self- Efficacy vs. Perceived benefits The correlation between perceived self-efficacy and perceived benefits brought out that there exist a moderate positive co-relation (0.759). The p-value is 0.000, indicates that the relationship is significant. 7.4.6. Perceived Self- Efficacy vs. Behavioural Intention to Use When the correlation between perceived self-efficacy and behavioural intention to use is studied, it is found that there exists a moderate positive co-relation (0.617) between both. The p value is 0.000, less than 0.05 indicating that the relationship is significant. 7.4.7. Attitude vs. Perceived Ease of Use When the correlation between attitude and perceived ease of use is studied, it is found that there exists a moderate positive co-relation (0.761) between both. The p value is 0.000, less than 0.05 indicating that the relationship is significant. 7.4.8. Attitude vs. Perceived Benefits When the correlation between attitude and perceived benefits is studied, it is found that there exists a moderate positive co-relation (0.790) between both. The p value is 0.000, less than 0.05 indicating that the relationship is significant. 7.4.9. Attitude vs. Behavioural Intention to Use When the correlation between attitude and behavioural intention to use is studied, it is found that there exists a moderate positive co-relation (0.607) between both. The p value is 0.000, less than 0.05 indicating that the relationship is significant. 7.4.10. Attitude vs. Self-Efficacy When the correlation between attitude and self-efficacy is studied, it is found that there exists a moderate positive co-relation (0.683) between both. The p value is 0.000, less than 0.05 indicating that the relationship is significant. 7.5. Analysis related to Objective 5 The last objective was to understand the influence of socio economic and demographic factors on the attitude towards e- learning in students. To attain the objective chi- square test of association is applied and the results are listed as under. H0: There is no significant association between different socio economic and demographic factors Vs attitude
- 7. Assessing The Readiness To Adopt E-Learning Among Industrial Training Institute Students… DOI: 10.9790/487X-1901015562 www.iosrjournals.org 61 | Page Table: 9 Association between different Socio economic and demographic variables Vs attitude towards e- learning. Factors Pearson Chi-Square value df Asymp. Sig. (2-sided) Associated / Not associated Gender Vs Attitude 25.345 3 0.000 Associated Family size Vs Attitude 13.350 6 0.038 Associated Family Income Vs Attitude 27.801 9 0.001 Associated First Generation Graduate Vs Attitude 20.394 3 0.000 Associated Availability of Home PC Vs Attitude 50.243 6 0.000 Associated 7.5.1. Gender Vs Attitude Chi square test is applied between gender and attitude. The Chi- square value is 25.345 and the p- value is 0.000 which is less than 0.05. There is significant association between gender and attitude. From the observed value, it is found that female students (88.9%) have more positive attitude towards the e-learning platform than the male students (68.2%). 7.5.2. Family size Vs Attitude The Chi- square value is 13.350 and the p value is 0.038 which is less than 0.05. There is significant association between family size and attitude. From the observed value, it is inferred that the attitude of the students from 4 members’ family is higher (44.8%). That is the students with medium family size have more positive attitude towards e- learning. 7.5.3. Family Income Vs Attitude The Chi- square value is 27.801 and the p value is 0.001 which is less than 0.05. The observed value shows that the attitude is very positive for the students whose family income is more than 30,000 rupees. 7.5.4. First Generation Graduates Vs Attitude Chi- square value is 20.394 and the p value is 0.000 which is less than 0.05. From the observed value, it is found that the students who are not first generation graduates have more positive attitude than the first generation graduates. 7.5.5. Home PC Vs Attitude The Chi- square value is 50.243 and the p value is 0.000 which is less than 0.05. From the observed value, it is found that the students who do not posses any device in their home have more positive attitude (87.2%) than the students who have device at home. VIII. Findings 8.1. Findings related to objective 1 It is understood from descriptive analysis that majority (80 percentage) of the students have high perception of benefits towards e-learning. 8.2. Findings related to objective 2 The analysis brought out that 54 percentages of students have high perception and minority (24 percentage) have low perceived ease of use towards e- learning. 8.3. Findings related to objective 3 As attitude towards e- learning is considered, it is inferred that majority (75 percentage) of the students have high positive attitude towards e-learning. 8.4 Findings related to objective 4 It is inferred among the relationship between different constructs, the correlation between Attitude and Perceived Benefits (0.790) is found to have higher correlation. It means that if the students believe that they will get high benefits by adopting e-learning platform then their attitude towards e-learning will also be favorable. So the adoption of e- learning among ITI students depends on the level the understanding the benefits of the programme. If the students are made to understand the benefits that they will obtain due to e- learning compared to their usual method, it will make their participation towards e- learning easier and effective. 8.5 Findings related to objective 5 It is found that there exists significant association between demographic factors namely gender, family size, family income, first generation graduates and possession of home personal computer on attitude.
- 8. Assessing The Readiness To Adopt E-Learning Among Industrial Training Institute Students… DOI: 10.9790/487X-1901015562 www.iosrjournals.org 62 | Page IX. Discussion And Conclusion As far as e-learning is considered possession of computer or a laptop is essential. The study infers that majority of the student possess gadgets that is required for e-learning. As language is considered most of the students are trained in Tamil. So e- learning platform should have options for usage of different language. Bendetto(2003), in his study inferred that a technology will be adopted more rapidly if it has ease of adoption . In this study it is understood that the ITI students have high perceived ease of use towards e-learning, so it is obvious that e-learning will be adopted by students if introduced. Further Zhang and Bhattacharyya, 2008 in his study, have identified student’s attitudes towards e-learning as critical factor for the success of e- learning. This study shows that ITI students have high positive attitude towards e-learning. E-learning will be successful among ITI students as attitude towards e-learning is positive. The inference of the study is favorable towards e-learning among ITI students. As far as ITI course is considered, it involves maximum percentage of practical training than class room lectures. This requires more involvement from the instructors. So, as e-learning for ITI students is considered, instructors’ opinion towards e-learning is also an important factor. Hence, further studies can be conducted to evaluate the instructors’ opinion towards e-learning. References [1]. M. Abbad, and D. N. Morris, Looking Under the Bonnet: Factors affecting Student Adoption of e-learning systems in Jordan.International Journal on Review of research in open and distance learning 10(2),2009,pp1- 23.PublishersEdge,http://www.publishers-dge.com/index_files/Manager Expectations.html. [2]. P. Bertia, Measuring students attitude towards e-learning A case study. Proceedings of the 5th standing conference on e-learning and software for development held in Bucharest from09-10 April 2009 Bucharist Romania 1-8 [3]. Surry, D. W., Ensminger, D. C., and Haab, M. (2005). A model for integrating instructional technology into higher education. British Journal of Educational Technology, 36(2), 327–329. [4]. Hara, N. (2000). Student distress in a web-based distance education course. Information, Communication and Society, 3(4), 557– 579. [5]. Yi, M., & Hwang, Y. (2003). Predicting the use of web-based information systems: Self-efficacy, enjoyment, learning goal orientation, and the technology acceptance model. International Journal of Human-Computer Studies, 59, 431–449. [6]. Legris, P., Ingham, J., & Collerette, P. (2003). Why do people use information technology? A critical review of the technology acceptance model. Information & Management, 40, 191–204. [7]. Taylor, S. and P.A. Todd (1995). "Understanding Information Technology Usage: A Test of Competing Models." Information Systems Research 6(2): 144-176. [8]. Benedetto, C. A., Calantone, R. J., & Zhang, C. (2003). International technology transfer model and exploratory study in the People’s Republic of China. International Marketing Review, 20(4), 446-462. [9]. Zhang, P., & Bhattacharyya, S. (2008). Students’ views of a learning management system: A longitudinal qualitative study. The Communications of the Association for Information Systems, 23(2008), 351-374. [10]. Mehra,V. and Omidian, F. (2011). Examining Students’ Attitudes Towards E-learning: A Case from India,Malaysian Journal of Educational Technology, Volume 11, Number 2, 13-18. [11]. Adewole-Odeshi, E. (2014). Attitude of Students Towards E-learning in South-West Nigerian Universities: An Application of Technology Acceptance Model, Library Philosophy and Practice (e-journal). Paper 1035. [12]. Ramesh, R., Suresh Prabhu, P. Analysis of B.ed students’ attitude towards e-learning in Tiruchengode town. International Journal of Teacher Educational Research (IJTER) Vol.2 No.10 October, 2013 ISSN: 2319-4642. Retrieved March 29, 2016 from www.ijter.com [13]. Rhema, A., & Miliszewska, I. (2012). The potential of e-learning in assisting post-crisis countries in rebuilding their higher education systems: The case of Libya. Issues in Informing Science and Information Technology, 9, 149-160. Retrieved from http://iisit.org/Vol9/IISITv9p149-160Rhema033.pdf [14]. http://www.financialexpress.com/article/industry/jobs/why-e-learning-has-a-promising-future-in-india/19204/ accessed on 30th June 2016