
Recommended
Recommended
More Related Content
What's hot
What's hot (20)
Similar to Paper id 712019112
Similar to Paper id 712019112 (20)
More from IJRAT
Recently uploaded
Recently uploaded (20)
Paper id 712019112
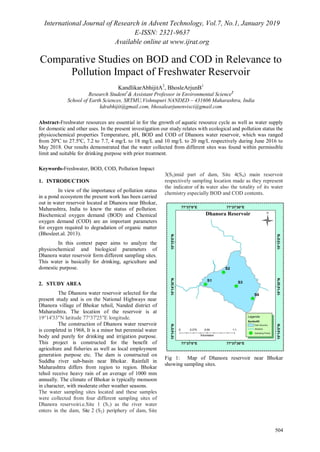
- 1. International Journal of Research in Advent Technology, Vol.7, No.1, January 2019 E-ISSN: 2321-9637 Available online at www.ijrat.org 504 Comparative Studies on BOD and COD in Relevance to Pollution Impact of Freshwater Reservoir KandlikarAbhijitA2 , BhosleArjunB1 Research Student1 & Assistant Professor in Environmental Science2 School of Earth Sciences, SRTMU,Vishnupuri NANDED – 431606 Maharashtra, India kdrabhijit@gmail.com, bhosalearjunenvisci@gmail.com Abstract-Freshwater resources are essential in for the growth of aquatic resource cycle as well as water supply for domestic and other uses. In the present investigation our study relates with ecological and pollution status the physicochemical properties Temperature, pH, BOD and COD of Dhanora water reservoir, which was ranged from 20ºC to 27.5ºC, 7.2 to 7.7, 4 mg/L to 18 mg/L and 10 mg/L to 20 mg/L respectively during June 2016 to May 2018. Our results demonstrated that the water collected from different sites was found within permissible limit and suitable for drinking purpose with prior treatment. Keywords-Freshwater, BOD, COD, Pollution Impact 1. INTRODUCTION In view of the importance of pollution status in a pond ecosystem the present work has been carried out in water reservoir located at Dhanora near Bhokar, Maharashtra, India to know the status of pollution. Biochemical oxygen demand (BOD) and Chemical oxygen demand (COD) are an important parameters for oxygen required to degradation of organic matter (Bhosleet.al. 2013). In this context paper aims to analyze the physicochemical and biological parameters of Dhanora water reservoir form different sampling sites. This water is basically for drinking, agriculture and domestic purpose. 2. STUDY AREA The Dhanora water reservoir selected for the present study and is on the National Highways near Dhanora village of Bhokar tehsil, Nanded district of Maharashtra. The location of the reservoir is at 19°14'33"N latitude 77°37'25"E longitude. The construction of Dhanora water reservoir is completed in 1968, It is a minor but perennial water body and purely for drinking and irrigation purpose. This project is constructed for the benefit of agriculture and fisheries as well as local employment generation purpose etc. The dam is constructed on Suddha river sub-basin near Bhokar. Rainfall in Maharashtra differs from region to region. Bhokar tehsil receive heavy rain of an average of 1000 mm annually. The climate of Bhokar is typically monsoon in character, with moderate other weather seasons. The water sampling sites located and these samples were collected from four different sampling sites of Dhanora reservoiri.e.Site 1 (S1) as the river water enters in the dam, Site 2 (S2) periphery of dam, Site 3(S3)mid part of dam, Site 4(S4) main reservoir respectively sampling location made as they represent the indicator of its water also the totality of its water chemistry especially BOD and COD contents. Fig 1: Map of Dhanora reservoir near Bhokar showing sampling sites.
- 2. International Journal of Research in Advent Technology, Vol.7, No.1, January 2019 E-ISSN: 2321-9637 Available online at www.ijrat.org 505 Fig 2: The location of map of Dhanora reservoir near Bhokar 3. MATERIAL AND METHODS Water samples were collected from 30 cm depth in polyethylene/plastic containers of nearly sufficient volume for the analysis.These are properly labelled and brought immediately tothelaboratoryforits systematic analysis/examination. The various parameters of the water samples were analysis can carry out in the laboratory as per the standard procedures (Trivedy and Goel, 1986). Thetemperature of waterwasmeasuredbyusingmercury– filled Celsius thermometer of 0-50oC range and 0.2oC least count. A digital pH meter was applied to measure the pH of various water samples(Sukhija L, 2010). Biochemical oxygen demand (BOD) of all samples was carried out by using alkali azide method and chemical oxygen demand (COD) byusing dichromate reflection method. 4. RESULT AND DISCUSSION The results obtained in the present study is given in Table 1, systematic evaluated and observed values of selected parameters studied as for BOD and COD is obvious factor responsible for detecting its status of solubility in aquatic ecosystems (Shaikh and Bhosle, 2015). Hence as a supportive factor the temperature and pH were studied and correlated during this research work. Pushpamet.al., (2013), determined the concentration of BOD in NagercoilNagraja temple tank and Suchindrumsthanumalayaswamy temple tank water of Kanyakumari district of Tamilnadu state from January to December 2009. They found that the concentration of BOD varied from 0.2 ppm to 9 ppm mg/L and 0.6 ppm to 9.1 ppm respectively. This may be due to the cause of human activities around this pond. Ahiarakwemet. al., (2011), carried out the study of BOD form water sample from Nijabariver in Niger delta basin of south eastern Nigeria, monitored for two period i.e. Jan-Dec 2003 and Jan-Dec 2008. They observed and noted the BOD values which was ranged from 2.2 to 3.0 mg/L to 3.2 to 4.8 mg/L in the year 2003, 2008 respectively. Mhaske and Talwankar (2017), studied the water samples for analysis of BOD from Khadakpurna reservoir of Buldhana district Maharashtra, they worked on BOD factor and carried out this work during August 2013 to July 2015. They recorded the BOD level which is found in the range of 1.2 mg/L to 4.2 mg/L. Luhariaet.al., (2016), were studied the parameter BOD content of Gawrala and Vinjasan lake of Bhadrawati, district-Chandrapur, Maharashtra and noted the values as low and high as 0.11 mg/L to 1.6 mg/L and 0.10 mg/L to 1.4 mg/L respectively. Vijayakumar and Kumaravijaya (2013),investigated the BOD level of Kundpura mangrove forest, Karnataka during April 2011 to March 2012. They noted that the BOD concentration found between 0 mg/L in the month of August at site 3 and 3.65 mg/L in the month of October at site 4. In the present research work the maximum level of biochemical oxygen demand were observed as 18 mg/L in the month of November 2016 at site S1, S3, S4 and at S1again in year 2017. Simultaneously the minimum level of BOD noted in June 2016 at site S3, S4, also in July 2016 at site S3again in June 2017 at site S3 also in the month of August 2017 at site S2 the average values are found as 11.04 mg/L respectively. Aweng and Maketab (2011),studied the physico-chemical aspects of three rivers in Sungai Endau watershed, Kluang, Johor, Malaysia. They observed the COD level of these lakes which was 1 mg/L to 3 mg/L at Dengar river, 12 mg/L to 27 mg/L at Mengkibolriver during November 2008 to June 2010, showed quite significant anthropogenic sources at the surrounding area. Jain (2018),was studied and obtained the COD values in one part of Hinjewadi, Pune, Maharashtra, during the month of May to June 2016.
- 3. International Journal of Research in Advent Technology, Vol.7, No.1, January 2019 E-ISSN: 2321-9637 Available online at www.ijrat.org 506 The observed values found in the level and ranged of 48 mg/L to 50 mg/L, which is within the limit. Watkar and Barbate (2015), carried out the COD parameter study form water of Chandrabhaga river, dist. Kalmeshwar, Maharashtra, the study was carried out during January 2013 to December 2013. They observed that, the values of COD found lowest as 71.6 mg/L in summer and highest value as 138.9 mg/L in monsoon. Bhagatet. al., (2017), analysed the COD amount content of the well water of villages in Roha tehsil Maharashtra during March 2015 to June 2016. They observed that the concentration of COD ranged from 4 mg/L to 30.2 mg/L. Mahanandaet.al., (2010), were studied and found the variation of COD content in the dug well water of Bargarh district Orissa, during their research tenure. They recorded the COD amount as minimum 2.15 ± 0.16 mg/L and maximum 2.64± 0.16 mg/L in ward number 5 and 6 respectively. In our present investigations the the values of chemical oxygen demand were observed as 20 mg/L in the month of June 2016 at site S1, S2 and in June 2017 at site S2. Lowest amount was observed averagely 10 mg/L in the June 2016 again in June 2017 at site S4. With overall observations showed that the average amount of BOD was 13.33 mg/L.
- 4. International Journal of Research in Advent Technology, Vol.7, No.1, January 2019 E-ISSN: 2321-9637 Available online at www.ijrat.org 507 Fig. 1.Temporal variation in BOD and COD contents during June 2016 to May 2017 Fig. 2. Temporal variation in BOD and COD contents during June 2017 to May 2018 0 5 10 15 20 25 S1 S3 S1 S3 S1 S3 S1 S3 S1 S3 S1 S3 S1 S3 S1 S3 S1 S3 S1 S3 S1 S3 S1 S3 Jun Jul Aug Sep Oct Nov Dec Jan Feb Mar Apr May 2016-17 Concentraionmg/L BOD COD 0 5 10 15 20 25 S1 S3 S1 S3 S1 S3 S1 S3 S1 S3 S1 S3 S1 S3 S1 S3 S1 S3 S1 S3 S1 S3 S1 S3 Jun Jul Aug Sep Oct Nov Dec Jan Feb Mar Apr May 2017-18 Concentrationmg/L BOD COD
- 5. International Journal of Research in Advent Technology, Vol.7, No.1, January 2019 E-ISSN: 2321-9637 Available online at www.ijrat.org 508 Table 1: The mean values of nutrient contents (mg/L) of Dhanora water reservoir during June, 2016 to May, 2018. Month Site Temperature pH BOD COD 2016 -17 2017-18 2016 -17 2017 -18 2016- 17 2017- 18 2016- 17 2017- 18 JUN S1 27.5 26.0 7.35 7.50 22 24 1.4 1.2 S2 27.3 25.5 7.30 7.50 17 18 1.2 1.0 S3 27.5 26.0 7.25 7.40 18 20 1.1 1.2 S4 27.0 26.0 7.35 7.40 15 16 1.0 1.2 JUL S1 25.5 25.5 7.40 7.50 13 14 1.2 1.4 S2 25.0 25.0 7.30 7.40 13 16 1.1 1.1 S3 25.5 25.0 7.50 7.40 14 18 1.2 1.4 S4 25.0 25.5 7.50 7.50 15 14 1.4 1.2 AUG S1 24.0 25.0 7.40 7.50 15 16 1.2 1.2 S2 24.0 25.0 7.30 7.60 15 15 1.4 1.4 S3 24.5 24.5 7.30 7.65 14 16 1.6 1.4 S4 24.0 24.5 7.20 7.65 16 18 1.4 1.2 SEP S1 24.0 24.0 7.40 7.60 16 14 1.5 1.2 S2 23.5 24.0 7.50 7.65 18 16 1.6 1.4 S3 23.5 23.5 7.50 7.6 18 14 1.6 1.2 S4 24.0 23.0 7.65 7.65 20 22 1.4 1.4 OCT S1 23.0 23.0 7.60 7.60 20 20 1.3 1.2 S2 23.5 22.0 7.60 7.65 22 22 1.2 1.2 S3 23.0 22.0 7.65 7.50 22 24 1.3 1.4 S4 22.0 22.0 7.65 7.60 25 22 1.3 1.2 NOV S1 22.0 21.0 7.60 7.50 25 24 1.2 1.2 S2 22.5 21.5 7.65 7.50 25 26 1.3 1.3 S3 22.5 21.0 7.65 7.40 26 24 1.2 1.4 S4 22.0 21.0 7.65 7.60 26 26 1.3 1.2 DEC S1 21.5 20.5 7.60 7.50 24 24 1.2 1.2 S2 21.0 20.0 7.60 7.65 24 26 1.0 1.2 S3 21.0 20.5 7.70 7.65 22 24 1.2 1.4 S4 21.0 20.5 7.70 7.60 23 26 1.2 1.2 JAN S1 22.0 20.5 7.65 7.60 23 24 1.2 1.6 S2 22.0 20.0 7.60 7.60 24 26 1.0 1.2 S3 22.5 20.0 7.60 7.65 25 26 1.0 1.4 S4 22.0 20.5 7.65 7.70 28 24 1.0 1.2 FEB S1 22.5 21.0 7.65 7.65 25 26 1.2 1.4 S2 22.5 21.0 7.60 7.60 24 26 1.3 1.4 S3 23.0 21.5 7.60 7.60 24 28 1.3 1.6 S4 22.0 21.5 7.50 7.65 23 24 1.4 1.2 MAR S1 22.0 21.0 7.60 7.65 24 26 1.4 1.2 S2 23.5 21.0 7.65 7.65 22 24 1.3 1.4 S3 23.5 21.0 7.60 7.60 20 22 1.4. 1.6. S4 23.0 21.5 7.65 7.60 21 22 1.3 1.4 APR S1 25.0 22.0 7.50 7.60 22 24 1.3 1.2 S2 25.5 22.5 7.60 7.50 23 24 1.4 1.4 S3 26.0 23.0 7.60 7.50 22 20 1.3 1.2 S4 27.0 23.0 7.50 7.60 20 22 1.3 1.4 MAY S1 23.5 25.0 7.60 7.60 18 18 1.2 1.2 S2 27.0 25.5 7.50 7.65 22 20 1.3 1.4 S3 26.5 26.5 7.50 7.70 21 22 1.2 1.2 S4 26.5 26.5 7.65 7.60 21 24 1.2 1.4 All above values are expressed in mg/L, while Temperature 0 C
- 6. International Journal of Research in Advent Technology, Vol.7, No.1, January 2019 E-ISSN: 2321-9637 Available online at www.ijrat.org 509 5. CONCLUSION On the basis of above study it may conclude that the surface water of Dhanora reservoir is useful for drinking purpose prior treatment is required before making it suitable for domestic use. Inflow from various anthropogenic activities, surface runoff, and local drains should be checked regularly. With overall observation of two years of experimental studies it has been found that the water quality during this period is found to be suitable and within permissible limit. 6. ACKNOWLEDGMENTS The authors are very much thankful to the School of Earth Sciences of Swami RamanandTeerthMarathwada University, Nanded for the necessary laboratory facilities and instrumental uses also library for literature survey. REFERENCES [1] Bhosle A. B;Shaikh P. R;Yennawar V. B and Nagargoje B. N (2013): Water quality assessment of Nagzari dam of Maharashtra, Journal of Applied Technology in Environmental Sanitation, Vol. 3 (3), pp. 111-116. [2] Trivedy R. K and Goel P. K, (1986): Chemical and Biological Methods for Water Pollution Studies, Environmental Publications,Karad (Maharashtra). [3] Kanase D. G;Shaikh S. A and Jagdale P. N (2016):Physico-chemical analysis of drinking water samples of different places in Kadegaon Tehsil Maharashtra(India), Advances in Applied Science Research, Vol. 7 (6), pp. 41-44. [4] Sukhija L (2010):Hydrobiologocial studies of foysagarlake Ajmer, Nature Environment and Pollution Technology, Vol. 9 (3), pp. 601-604. [5] ShaikhParveen R and BhosleArjun B, (2015): Analysis of Trace Metals from Water Samples of Siddheshwar Reservoir NearHingoli district, Maharashtra, Report and Opinion, Vol.7 (10), pp. 1-9. [6] Watkar A. M and Barbate M. P (2015): Seasonal variations in physico-chemical properties of Chandrabhaga river in Dhapewada Dist. Kalmeshwar Maharashtra India, Research Journal of Recent Sciences, Vol. 4 (ISC-2014), pp. 1-4. [7] BhagatD.V;Takey S. S and Shirke S. B (2017): Assessment of physico-chemical parameters of well water of villages in Roha tehsil dist. Raigad (MAHARASHTRA), Int. Journal of Applied and Pure Science and Agriculture, Vol.3 (5). ISSN: 2394-5532. [8] Ahiarakwem, CosmasAhamefula and Onyekuru, Samuel O (2011):A Comparative Assessment of the Physico-Chemical and Microbial Trends in Njaba River, Niger Delta Basin, SoutheasternNigeria,Journal of Water Resource and Protection,Vol.3 (9),pp686-693. [9] Mhaske, T K and Talwankar, D S (2017): Water Quality Analysis of Khadakpurna Reservoir in Buldana District – Maharashtra,International Journal of Advanced Research, Vol. 5 (8), pp.1295-1303. [10]Luharia, N M and Harney, N V; Dhamani, A A (2016): Analysis and Seasonal Variation of Physico-Chemical Parameters of Gawrala Lake and Vinjasan Lake of Bhadrawati, District- Chandrapur (M.S.), India, Asian Journal of Multidisciplinary Studies, Vol. 4 (1), pp 272-279. [11]Aweng, E R;Ismid, M S and Maketab M (2011): The Effect of Land Uses on Physicochemical Water Quality at Three Rivers in Sungai Endau watershed, Kluang, Johor, Malaysia,Australian Journal of Basic and Applied Sciences, Vol. 5 (7), pp. 923-932. [12]Jain, Nidhi (2018):Physico-Chemical Assessment of Water Quality in One Part of Hinjewadi, Pune Maharashtra (India), International Journal of Scientific Research Engineering & Technology, Vol. 7(1), pp. 1-9. [13]Vijaya Kumar, K M and Kumara, Vijaya (2013):Physico-Chemical Analysis of Water Quality of Kundapura Mangrove Forest, Karnataka, India, Global Journal of Biology, Agriculture & Health Sciences, Vol. 2(3), pp. 111-118. [14]Pushpam, P Maria; Bhagan, VUmayoru; Kumaraswamy, A (2013): Comparative Analysis of Physicochemical Parameters of Two Famous Temple Tanks in Kanyakumari District, S. India, International Journal of Latest Trends in Engineering and Technology, Vol. 2(1), pp 235- 240. [15]Mahananda M R;Mohanty B P; Behera N R (2010):Physico-Chemical Analysis of Surface and Ground Water of Bargarh District, Orissa, India, IJRRAS, Vol. 2 (3), pp. 284-295.