Artificial Neural Network for Modeling Nitrate Pollution of Groundwater
1. KSCE Journal of Civil Engineering (2017) 21(1):134-140
Copyright ⓒ2017 Korean Society of Civil Engineers
DOI 10.1007/s12205-016-0572-8
− 134 −
pISSN 1226-7988, eISSN 1976-3808
www.springer.com/12205
Environmental Engineering
Artificial Neural Network for Modeling Nitrate Pollution of Groundwater
in Marginal Area of Zayandeh-rood River, Isfahan, Iran
Kaveh Ostad-Ali-Askari*, Mohammad Shayannejad**, and Hossein Ghorbanizadeh-Kharazi***
Received July 29, 2015/Accepted March 2, 2016/Published Online May 16, 2016
··································································································································································································································
Abstract
Excessive use of chemical fertilizers, especially nitrogen fertilizers to increase crop and improper purification, and delivery of
municipal and industrial wastewater are proposed as factors that increase the amount of nitrate in groundwater in this area. Thus,
investigation of nitrate contamination as one of the most important environmental problems in groundwater is necessary. In the
present study, modeling and estimation of nitrate pollution in groundwater of marginal area of Zayandeh-rood River, Isfahan, Iran,
was investigated using water quality and artificial neural networks. 100 wells (77 agriculture well, 13 drinking well and 10 gardens
well) in the marginal area of Zayandeh-rood River, Isfahan, Iran were selected. MATLAB software and three-layer Perceptron
network were used. The back-propagation learning rule and sigmoid activation function were applied for the training process. After
frequent experiments, a network with one hidden layer and 19 neurons make the least error in the process of network training, testing
and validation. ANN models can be applied for the investigation of water quality parameters.
Keywords: artificial neural network, contamination, groundwater, nitrates
··································································································································································································································
1. Introduction
Groundwater reserves are important in natural waters which
are exploited by digging deep and semi deep wells, springs and
quants. Approximately 97% of the Earth's fresh water is
groundwater and only 3% is surface water storage (Hambright,
2006). Relative to most surface water sources, groundwater water
quality is generally superior and more consistent. Groundwater
in arid regions such as Iran contributed to supply a significant
amount of water and agriculture water. Isfahan province, Iran, is
located in an arid and semi-arid area and because of drought in
recent years, the use of groundwater for irrigation and drinking
water is very important (Dorsch, 1984; Acutis, 2000). Pollution
of groundwater resources by harmful substances that enter into
the natural environment intentionally or non-intentionally by
man is important in the future exploitation of groundwater
resources. One source of this pollution is related to nitrate. The
maximum allowable concentration of nitrate-nitrogen (NO3-N) is
10 mg/L for drinking water, according to the US Environmental
Protection Agency and the World Health Organization, which is
approximately equivalent to 45 mg of nitrate (NO3) per liter. This
cut point was determined 50 mg/L nitrate by European Union
(EU) (Zhang et al., 2013). In Iran, 45 mg/L nitrate is considered
as the maximum allowable concentration in drinking water
(Sobedji, 2001; Sadek, 2002). Municipal and industrial wastewater
discharge in the absorptive wells, and indiscriminate use of
chemical fertilizers in agriculture, are the most important factors
affecting nitrate pollution. In recent decades, the use of nitrogen
fertilizers without considering their effects on soil properties,
agricultural products and especially environmental pollution has
increased dramatically. When Phosphorus-Nitrogen Compounds
enter to lakes and rivers lead to enrich water and consequently
uncontrolled growth of aquatic plants. Subsequently, a deficiency
of dissolved oxygen in the water leads to aquatic organisms'
death (Noh, 2006). Khossravi-Dehkordi et al. (2004) investigated
the nitrate pollution, distribution and its change in groundwater
in a marginal area of Zayandeh-rood River, Isfahan, Iran. The
results showed that the average concentration of nitrate nitrogen
in water of Baghbadaran, Isfahan, Iran, wells with an average
depth of 9 m, Falavarjan area with an average depth of 7.5 m and
Varzaneh area, Isfahan, Iran, with an average depth of 6 m was
5.28, 17.63 and 6.35 mg per liter, respectively. Consuming
contaminated groundwater is harmful for plants, humans and
animals. Thus identification of contaminated water sources and
causes of pollution are essential. High concentrations of nitrate in
soil and irrigation water cause nitrate accumulation in plants that
TECHNICAL NOTE
*Faculty Member, Dept. of Civil Engineering, Isfahan (Khorasgan) Branch, Islamic Azad University, Isfahan, Iran (Corresponding Author, E-mail:
Koa.askari@khuisf.ac.ir)
**Associate Professor, Water Engineering Dept., Isfahan University of Technology, Isfahan, Isfahan Province, Iran (E-mail: shayannejad@cc.iut.ac.ir)
***Assistant Professor, Water Engineering Dept., Shoushtar Branch, Islamic Azad University, Shoushtar, Khuzestan Province, Iran (E-mail: h.ghorbaniza-
deh@gmail.com)
2. Artificial Neural Network for Modeling Nitrate Pollution of Groundwater in Marginal Area of Zayandeh-rood River, Isfahan, Iran
Vol. 21, No. 1 / January 2017 − 135 −
can be harmful for humans and animals. Organic and inorganic
nitrate reduce to nitrite, and after entering to the circulatory
system, oxidizes iron in hemoglobin and converts bivalent to
trivalent state which change hemoglobin to met-hemoglobin
(Park, 2013). In addition, elevated nitrate levels may be associated
with a prevalence of lymphatic cancer. Vitamin deficiency and
conversion of dietary nitrate to nitrosamine and nitrosamid in the
stomachmayleadtoesophagealcancer inthisregion(Panagopoulos,
2011). Dresch et al. (1984) reported the risk of congenital
malformations in children whose mothers consumed water with
nitrate concentration more than 5 mg per liter during pregnancy.
Simulation and modeling of nitrate were assessed in various
studies. Pour Farahabadi et al. (2007) used neural networks for
simulation of nitrate concentrations in the Karaj aquifer. Nitrate
concentrations in the previous season, the saturated layer
thickness, the amount of exploitation wells in the target and
previous season, changes in water level drop, and geographic
coordinates were considered as estimators of the model. Firstly,
the simulation model was developed for each season separately
and then a single model was developed for all seasons. Results
indicated that the estimation of changes in nitrate concentrations
in summer had the highest accuracy in the validation step
(efficiency index R2
= 74.75) in comparison with other seasons.
Autumn, winter and spring had an efficiency index of 63.35,
62.48 and 50.15, respectively. The efficiency index in the
validation of the proposed model for all seasons was 61.06,
which indicated efficiency of this model was appropriate to
simulate nitrate concentration (Babiker, 2004).
Akuotis et al. (2000) used the LEACHN model (Leaching
Estimation and Chemistry Model) to obtain stochastic model
information on the nitrate leaching in different cultural systems.
Then the results of the model were used for the evaluation of
spatial variations of soil hydraulic parameters. Sobedji et al.
(2001) studied and simulated nitrogen fate and its transport by
LEACHN model under different management conditions (time
and rate of nitrogen) on loamy sand and clay loam soils. This
model estimates the concentration of nitrate in the soil and
absorbed nitrate by the plants with high accuracy. Sadak et al.
(2002) used the DRAINMOD model to simulate nitrate leaching
in a sandy area for 30 years. Comparison between measured data
and simulated data showed that nitrate concentrations in soil and
nitrateleachingto drains dependon propermanagement,fertilization,
initial conditions and the amount of rainfall and its distribution.
This model was able to acceptable simulate.
In another study, a Geographic Information System (GIS) and
AVSWAT (ArcView SWAT) mathematical model were used to
simulate the amount of nitrate that enters the groundwater due to
agricultural activities (Babiker, 2004; Panagopoulos, 2011). Since
fertilizers and other chemicals used in agriculture drainage below
the root zone, due to irrigation, are considered as an important
non-point pollution of groundwater in irrigated lands (Tuppad,
2011). Due to the large agricultural areas in the Isfahan province
and overuse of chemical fertilizers, especially nitrogen fertilizers
and overuse of groundwater for public use and agriculture in this
region, the investigation of nitrate contamination in groundwater in
this area is extremely important and necessary. On the other
hand, continuous measurement of nitrate is time-consuming and
expensive and requires special equipment for measurement.
Thus, in this study, the artificial neural network model with only
common qualitative parameters such as sodium (Na+
), potassium
(K+
), calcium (Ca2+
), magnesium (Mg2+
), bicarbonate (CO3
–
),
sulfate (SO4
2–
), claire (Cl–
), pH, Electrical Conductivity (EC),
hardness and Sodium Adsorption Ratio (SAR) was used to
predict the amount of nitrate in groundwater.
2. Artificial Neural Network
The general structure of artificial neural networks is according
to the biological system of human brain. Artificial neural
networks are able to perform functions similar to natural neural
systems. In other words, they can exhibit some characteristics
similar to the human brain. In situation that there is precise
definition of the problem, apply the well-known rules is useful.
However, in situations where understanding the phenomenon is
difficult, the use of known rules and methods may not be very
appropriate. The scientists try to design an artificial intelligence
system with the capability of learning, creativity and flexibility
(such as biological systems) similar to man and present neural
computing techniques. This method does not require the setting
of specific rules for problem solving but basically relies on a
progressive education system.
Artificial neural networks process the experimental data and
transfer them to the network structure. So this network is called
the intelligent system and learns the general rules with computations
on numerical data or examples. There are some configured
parameters in the structure of these systems. Configuration of
these parameters is for desired action of system to external
stimuli and data that is called training of system. In fact, these
systems are able to learn and collect appropriate information to
deal with the phenomenon. The learning process of these
systems can be done in various ways that organize the main topic
in artificial neural networks. Artificial neural network models are
constantly developing and improving basic theoretical models and
their applications increase along with the promotion of basic
theoretical models.
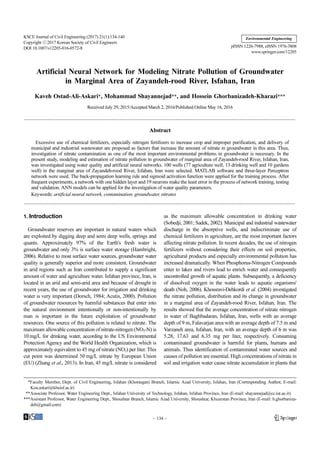
Artificial networks have similar structures despite the
diversity. An artificial neural network is usually made three
layers including input layer, hidden layer and output layer. The
input layer receives information only and acts like an
independent variable. Thus, the number of neurons in the input
layer is determined based on the nature of the problem and
depend on the number of independent variables. The output
layer acts as the dependent variable and the number of its
neurons depend on the number of dependent variables.
However, unlike the input and output layer, the hidden layer
does not represent any concept and is only an intermediate
result in the process of calculating the value of the output. Fig.
1 shows the outline of an artificial neural network.
3. Kaveh Ostad-Ali-Askari, Mohammad Shayannejad, and Hossein Ghorbanizadeh-Kharazi
− 136 − KSCE Journal of Civil Engineering
3. Methodology
3.1 Data Preparation
To achieve the objectives of the study, 100 wells (77 agriculture
well, 13 drinking well and 10 gardens well) in the marginal area
of Zayandeh-rood River, Isfahan, Iran were selected with north
latitude of 32º 25' 28" to 32º 32' 8'' and east longitude of 51º 11'
39'' to 52º 38' 31''. The following items were measured in the
spring of 2013, sodium (Na+
), potassium (K+
), calcium (Ca+2
),
magnesium (Mg+2
), bicarbonate (CO3–
), sulfides (SO4
–2
), chlorine
(Cl–
), hardness, Electronic Conductivity (EC), (pH), is the
absorption ratio (SAR) and sodium nitrate (NO3). The area for
study began from Baghbadran and continued along 200 km of
the river, including Madise, Golden City, Mynadsht, Jafar Abad,
Garyakhan, Kelishadi, Dorcheh, Isfahan, Eshkavand, Dashti,
Rashenan, Hyderabad, Zeyar, Aichi Hermedan, Sharif Abad,
Barsian, Golestane, Izhe, Nikabad triode, Varzaneh and Segzi
(these are the names of some areas across to the marginal area of
Zayandeh-rood River, Isfahan) (Fig. 2). The mean of the wells
depth was between 2.5 and 15 m. The average depth of wells in
the Baghbadran area was 9 m, in the Falavarjan area it was 7.5 m
and in Varzane it was 6 m.
3.2 Modeling using Artificial Neural Networks
Providing an artificial neural network model requires the
design of each of its components. The three-layer perceptron
neural network with the back-propagation learning method was
used to achieve the desired goals. We try to select the best and
most efficient networks with minimum error rate. In order to
select the best model, the statistical correlation coefficient (R)
and Mean Square Error (MSE) were used. In addition, sensitivity
analysis was used for determination of the main factors related to
nitrate contamination.
3.3 Data Standardization
In most cases, inputting raw data leads to reduced speed and
accuracy of network. Input data should be standardized in order
to equalize the value of the data and increase the speed and
accuracy of model. This will prevent excessive decrease of the
weights. Also, all data are between 0 and 1 by standardizing.
This is advantageous because the output of most of the functions
have a threshold between zero and one. In the present study, the
following equation was used to standardize the data (1):
(1)
In this equation, x, xstandard, xmin, xmax indicate an input variable
values, the standardized value, the possible minimum and maximum
Xs dardtan
X Xmin–
Xman Xmin–
------------------------=
Fig. 1. Overview of an Artificial Neural Network
Fig. 2. 100 Selected Wells Across to Marginal Area of Zayandeh-rood River, Isfahan, Province, Iran ( represent the position of
selected wills)
4. Artificial Neural Network for Modeling Nitrate Pollution of Groundwater in Marginal Area of Zayandeh-rood River, Isfahan, Iran
Vol. 21, No. 1 / January 2017 − 137 −
values, respectively.
3.4 Data Classification
Artificial neural network models need three categories of data
including training data, validation and testing for design. Training
data is used to find the relationship between inputs and outputs,
the validation of learning is used to control and monitor the
network properly and the test data is used for evaluation of
designed network performance. In this study, we used 50% of the
available data for training, 30% of the data for validation and the
remaining 20% data for testing of the model.
4. Results
Nitrate concentration in the Baghbaderan wells was 5.28 mg/
L, in the Falavarjan area it was 17.63 mg/L, in Varzane it was
6.35 mg/L, in the Jalalabad area (in 1 km of marginal area of
Zayandeh-rood River) was 70.8 mg/L and in the Baghmalek area
(the first area of the study) it was 0.23 mg/L.
The maximum, minimum and average nitrate nitrogen
concentrations and other parameters in Zayandeh-rood River,
Isfahan, Iran margin is shown in Table 1.
MATLAB software and network-layer perceptron (MLP) were
used for network training. Back-propagation (BP) and sigmoid
activation function was used for training. The values for the
number of hidden layer neurons 1 to 2n + 1 (n is the number of
input neurons) were applied, and in the end the best network
structure with the minimum Mean Square Error (MSE) and the
highest correlation coefficient (R) was selected. The mean
square error is calculated by the following Eq. (2):
(2)
where xi is value of the simulated data, yi is value of the
measured data, i is counter and n is the number of measured data.
The MSE indicates the amount of estimation. When the
predicted values are equal to measured values, the amount of the
MSE is zero.
We can provide the least error in the training, assessment and
validation of network, after repeating of the network with one
hidden layer and 19 neurons. Fig. 3 shows the correlation
between observed and calculated values by the artificial neural
network. Nine epochs in the training cycle has been presented to
the network that the best validate performance was obtained in
epoch 3.
As shown in Fig. 3, the best line represents the best amount of
MSE for the designed network.
Network training process is correct when the amount of
validation and test are close to each other,
MSE
1
n
--- i 1=
n
Xi Yi–( )
2
∑=
Fig. 3. The Changes Mean Square Error Over the Three Step of
Train, Validation And Test
Table 1. Maximum, Minimum and Average Nitrate Nitrogen Concentration and Other Parameters in Zayandeh-rood River, Isfahan, Iran
Margin
Amount
Year
2010 2011 2012 2013 2014
NO3
–
N (ppm)
Maximum 24.5 37.5 38.1 70.8 46.9
Minimum 0.23 0.32 0.44 0.98 1.01
Mean 5.64 6.6 9.6 11 13.9
HCO3
–
(ppm)
Maximum 18 11 8.5 12.8 1
Minimum 3 1.5 1.5 1.5 0.45
Mean 6.6 3.71 3.16 3.53 2.93
Cl–
(ppm)
Maximum 99 50 49 40.5 31
Minimum 0.5 0.82 0.6 0.5 0.5
Mean 14.6 13. 01 8.19 5.72 4.58
SO4
2–
(ppm)
Maximum 110 80 115.6 80 48
Minimum 0.2 0.4 1.5 0.8 0.65
Mean 15.92 14.32 21.05 8.12 4.9
K+
(ppm)
Maximum 84 85.4 25 21 25.5
Minimum 1 0.73 0.6 1.2 1.1
Mean 6.78 4.9 4. 57 4.47 3.88
5. Kaveh Ostad-Ali-Askari, Mohammad Shayannejad, and Hossein Ghorbanizadeh-Kharazi
− 138 − KSCE Journal of Civil Engineering
As shown in Fig. 3, the best validation is in the third step of
training which is equal to 0.020979.
In Fig. 4, calculated values by the network are plotted against
the actual values. The correlation coefficient (R) was obtained
(0.859) and was acceptable.
4.1 Sensitivity Analysis
The sensitivity analysis process shows the sensitivity rate of
the model based on the input variables. Sensitivity analysis
evaluates the contribution of each input variable to the neural
network. It is a method to assess the behavior of a model and the
importance of each input variable on the values of the output
variable of the model (Park, 2003). Sensitivity analysis was
performed to delete those inputs that did not have a significant
effect on model performance. This analysis was used to decide
which inputs must be retained and which must be deleted by
applying some degree of judgement (Zealand, 1999). There are
many ways to carry out the sensitivity analysis. In this study, the
Stat-soft method was performed for sensitivity analysis. The
sensitivity coefficients of input variables were obtained by
dividing the error of the network in the absence of a variable on
the network error with all input parameters. Results are shown in
Table 2 and Fig. 4. If the sensitivity coefficient of a variable is
greater than one, it has a great contribution in the variability of
the functional variables. Parameters sensitivity coefficient in
Statsoft method were shown in Fig. 5.
5. Discussion
In the present study, artificial neural networks were used as a
tool for estimating groundwater nitrate based on other parameters
of water quality analysis including sodium, potassium, calcium,
magnesium, bicarbonate, sulfate, chloride, pH, conductivity,
hardness, sodium adsorption ratio. MATLAB software and three
layer perceptrons were used for the training network. The rule of
Back-Propagation (BP) and sigmoid activation function were
used for training processes. After repeated network experiments
with one hidden layer and 19 neurons, the lowest error in training
process error, assessment and validation was established in this
layer. The best validation was obtained in the third step of
training and MSE was equal to 0.020979. The value of the
correlation coefficient (R) was 0.859 which was in an acceptable
range and confirmed that the model is able to well serve the
purpose. Sensitivity analysis was performed by Statsoft method
that according to the timetable analysis, sensitivity coefficient
ranges were between 0.76 and 1.2. This shows that the maximum
effect on the model was applied by electronic conductivity and
pH parameters and the minimum effect by sodium.
ANNs have been carried out to model groundwater, investigate
water quality, forecast precipitation and stream flow. Researchers
applied ANNs to predict the concentration of nitrogen in streams
from watershed features, for optimization of water pollution
Fig. 4. Comparison of Actual and Calculated Values by Neural
Network
Table 2. Sensitivity Coefficient of Parameters in Statsoft Method
Deleted factor MSE
Deleted factor
sensitivity index
Without deleted factor 0.021 1
Cl 0.024 1.129
HCO3 0.023 1.092
K 0.019 0.899
Na 0.016 0.764
Ca 0.024 1.126
Mg 0.022 1.035
SO4 0.017 0.834
EC 0.025 1.203
Hardness 0.018 0.869
Sodium absorbance ratio 0.020 0.964
pH 0.025 1.899
Fig. 5. Parameters Sensitivity Coefficient in Statsoft Method
6. Artificial Neural Network for Modeling Nitrate Pollution of Groundwater in Marginal Area of Zayandeh-rood River, Isfahan, Iran
Vol. 21, No. 1 / January 2017 − 139 −
control and river pollution planning and for optimization of
groundwater remediation (Rogers, 1994; Wen, 1998; Lek, 1999).
The ANN approach has several advantages. It sets input data
without any assumptions, and develops a mapping of the input
and output variables that can predict desired output. Any smooth,
measurable function between input and output can be approximated
by multi-layer neural networks through selecting a suitable set of
connecting weights and transfer functions. ANN models have
been widely applied to water quality problems (Singh, 2009).
The artificial neural networks use in various branches of
engineering including water engineering. Some of them have
been mentioned below:
Prediction of rainfall in space and time (French, 1992),
optimization of groundwater (Rogers, 1994), drainage design in
unsteady conditions (Shukla, 1996), land drainage engineering
(Yang, 1996, 1997), prediction of water levels in rivers
(Thirumalaian, 1998) flow forecasting to reservoirs (Jain, 1999).
These researchers used artificial neural networks to achieve their
goals. Bruton et al. (2000), estimated daily pan evaporation using
artificial neural networks. Sample size was 2044 from various
cities of the world as Rome from 1992 to 1996. Input data
included: rainfall, temperature, relative humidity, solar radiation,
wind speed. The pan evaporation that was estimated by artificial
neural networks had less error than other methods. The amount
of error was 1.11 mm/day.
Odhiambo et al. (2001) estimated grass evaporation by
artificial neural networks. Input data were solar radiation,
relative humidity, wind speed and temperature. Error was
0.48 by artificial neural networks and was 0.56 by FAO
Penman-Monteith method.
Kumar et al. (2002) estimated grass evaporation by artificial
neural networks. Data including minimum and maximum air
temperature, minimum and maximum relative humidity, wind
speed and solar radiation were calculated. Data were normalized.
Finally, the best results were obtained by network with one
input layer, one hidden layer and one output layer. The amount
of error was 0.6 mm/day by artificial neural networks. While, the
amount of error was 0.97 mm/day by Penman-Monteith
method.
Nor et al. (2015) used a three-layer multilayer perceptron.
Their results showed that the model detect the presence of nitrate
added in distilled water and was capable of distinguishing the
concentration level in the presence of other types of contamination
with a RMSE of 0.0132.
Keskin et al. (2015) predicted water pollution sources by
ANNs in Sivas, Karabük and Bart n areas of Turkey, which have
different types of rocks, agricultural activity. They showed ANN
could be used for assessment of groundwater pollution sources.
Trajkovic et al. (2003), used artificial neural networks for
evapotranspiration prediction. In this case, they used the amount
of evapotranspiration of 11 and 23 days ago for prediction of
evapotranspiration in the coming day. Ratio of predicted
evapotranspiration to measured evapotranspiration was 0.994
that these results showed good performance of this method.
6. Conclusions
After repeated network experiments with one hidden layer and
19 neurons, the lowest error in training process error, assessment
and validation was established in this layer. The best validation
was obtained in the third step of training and MSE was equal to
0.020979. These findings showed ANN models can be applied
for the investigation of water quality parameters.
References
Acutis, M., Ducco, G., and Grignani, C. (2000). “Stochastic use of the
LEACHN model to forecast nitrate leaching in different maize
cropping systems.” Eur. J. Agron., Vol. 13, Nos. 2-3, pp. 191-206.
Babiker, I. S., Mohamed, M. A., Terao, H., Kato, K., and Ohta, K.
(2004). “Assessment of groundwater contamination by nitrate leaching
from intensive vegetable cultivation using geographical information
system.” Environ. Int., Vol. 29, No. 8, pp. 1009-1017.
Bruton,J.M.,McClendon,R.W.,andHoogenboom,G.(2000).“Estimating
daily pan evaporation with artificial neural network.” Trans. ASAE,
Vol. 43, No. 2, pp. 492-496.
Dorsch, M. M., Scragg, R. K. R., Mcmichael, A. J., Baghurst, P. A., and
Dyer, K. F. (1984). “Congenital malformations and maternal drinking
water supply in rural South Australia: A case control study.” Am. J.
Epidemiol., Vol. 119, No. 4, pp. 473-486.
El-Sadek, A., Feyen, J., and Ragab, R. (2002). “Simulation of nitrogen
balance of maize field under different drainage strategies using the
DRAINMOD-N model.” Irrig. Drain., Vol. 51, pp. 61-75.
French, M. N., Krayewski, W. F., and Cuykendall, R. R. (1992). “Rainfall
forecasting in space and time using a neural networks.” J. Hydrol.,
Vol. 137, Nos. 1-4, pp. 1-37.
Hambright, K. D., Ragep, F. J., and Ginat, J. (2006). Water in the middle
east: Cooperation and technological solutions in the jordan valley,
University of Oklahoma Press.
Jain, S. K., Das, A., and Srivastava, D. K. (1999). “Application of ANN
for reservoir inflow prediction and operation.” J. Water Res. Plan.
Manage., Vol. 125, No. 5, pp. 263-271.
Keskin, T. E., Dü enci, M., and Kaçaro lu, F. (2015). “Prediction of
water pollution sources using artificial neural networks in the study
areas of Sivas, Karabük and Bart n (Turkey).” Environmental Earth
Sciences, Vol. 73, No. 9, pp. 5333-5347.
Khosravi Dehkordi, A., Afyuni, M., and Musavi, F. (2004). “Nitrate
concentration in groundwater in the Zayanderoud river basin.”
Environmental. Studies. J., Vol. 32, No. 39, pp. 33-40.
Kumar, M., Raghuwanshi, N. S., Singh, R., Wallender, W. W., and Pruitt,
W. O. (2002). “Estimating evapotranspiration using artificial neural
networks.” J. Irrig. And Drain. ASCE, Vol. 128, No. 4, pp. 224-233.
Lek, S., Guiresse, M., and Giraudel, J. L. (1999). “Predicting stream
nitrogen concentration from watershed features using neural networks.”
Water Res., Vol. 33, No. 16, pp. 3469-3478.
Noh, H., Zhang, Q., Shin, B., Han, S., and Feng, L. (2006). “A neural
network model of maize crop nitrogen stress assessment for a multi-
spectral imaging sensor.” Biosyst. Eng., Vol. 94, No. 4, pp. 477-485.
Nor, A. S. M., Faramarzi, M., MAM. Yunus, M. A. M., and Ibrahim, S.
(2014). “Nitrate and sulfate estimations in water sources using a
planar electromagnetic sensor array and artificial neural network
method.” IEEE, Vol. 15, No. 1, pp. 497-504.
Odhiambo, L. O., Yoder, R. E., Yoder, D. C., and Hines, J. W. (2001).
“Optimization of fuzzy evaporation model through neural training
i
g
o
g
o
i
7. Kaveh Ostad-Ali-Askari, Mohammad Shayannejad, and Hossein Ghorbanizadeh-Kharazi
− 140 − KSCE Journal of Civil Engineering
with input-output examples.” Trans. ASAE, Vol. 44, No. 6, pp. 1625-
1633.
Panagopoulos, Y., Makropoulos, C., Baltas, E., and Mimikou, M. (2011).
“SWAT parameterization for the identification of critical diffuse
pollution source areas under data limitations.” Ecol. Model., Vol.
222, No. 19, pp. 3500-3512.
Park, J., Daniels, H. V., and Cho, S. H. (2013). “Nitrite toxicity and
methemoglobin changes in southern flounder, paralichthys lethostigma,
in brackish water.” J. World. Aquacult. Soc., Vol. 44, No. 5, pp. 726-
734.
Park, Y. S., Cereghino, R., Compin, A., and Lek, S. (2003). “Applications
of artificial neural networks for patterning and predicting aquatic
insect species richness in running waters.” Ecol. Model., Vol. 160,
No. 3, pp. 265-280.
Rogers, L. L. and Dowla, F. U. (1994). “Optimization of groundwater
remediation using artificial neural networks with parallel solute
transport modeling.” Water Resour. Res., Vol. 30, No. 2, pp. 457-
481.
Shukla, M. B., Kok, R., Prasher, S. O., Clark, G., and Lacroix, R. (1996).
“Use of artificial neural network in transient drainage design.”
Trans. ASAE, Vol. 39, No. 1, pp. 119-124.
Singh, K. P., Basant, A., Malik, A., and Jain, G. (2009). “Artificial
neural network modeling of the river water quality – A case study.”
Ecol. Model., Vol. 220, No. 6, pp. 888-895.
Sobedji, J. M., Van Es, H. M., and Huston, J. L. (2001). “N fate and
transport under variable cropping history and fertilizer rate on loamy
sand and clay loam soils: I. Calibration of the LEACHMN model.”
Plant Soil, Vol. 299, No. 1, pp. 57-70.
Thirumalaian, K. and Deo, M. C. (1998). “River stage forecasting using
artificial neural network.” J. Hydrol. Eng., Vol. 3, No. 1, pp. 26-32.
Trajkovic, S., Todorovic, B., and Standkovic, M. (2003). “Forecasting
of reference evapotranspiration by artificial neural network.” J.
Irrig. And Drain., ASCE, Vol. 129, No. 6, pp. 454-457.
Tuppad, P., Douglas-Mankin, K. R., Lee, T., Srinivasan, R., and Arnold,
J. G. (2011). “Soil and Water Assessment Tool (SWAT) hydrologic/
water quality model: Extended capability and wider adoption.” Am.
Soc. Agric. Biol. Eng., Vol. 54, No. 5, pp. 1677-1684.
Wen, C. W. and Lee, C. S. (1998). “A neural networkapproach to
multiobjective optimization for water quality management in a river
basin.” Water Resour. Res., Vol. 34, No. 3, pp. 427-436.
Yang, C. C., Prasher, S. O., and Lacroix, R. (1996). “Application of
artificial neural network to land drainage engineering.” Trans.
ASAE, Vol. 39, No. 2, pp. 525-533.
Yang, C. C., Prasher, S. O., Lacroix, R., Sreekanth, S., Patni, N. K., and
Masse, L. (1997). “Artificial neural network model for subsurface-
drained farmlands.” J. Irrig. And Drain., ASCE, Vol. 123, No. 4,
pp. 285-292.
Zealand, C. M., Burn, D. H., and Simonovic, S. P. (1999). “Short term
streamflow forecasting using artificial neural networks.” J. Hydrol.,
Vol. 214, Nos. 1-4, pp. 32-48.
Zhang, X., Xu, Z., Sun, X., Dong, W., and Ballantine, D. (2013). “Nitrate in
shallow groundwater in typical agricultural and forest ecosystems in
China, 2004-2010.” J. Environ Sci. (China), Vol. 25, No. 5, pp.
1007-1014.