Analysis of Algorithm Company Performance and Stock Price Prediction
•
0 likes•58 views

celltrionhealthcare 091990 Algorithm Investment Report
![[Price for scheduled purchasing]
Arbitrarily made
Algorithm stocks Trading Strategies (consolidated) 091990 Date
Period
Gap
(Indication /
stock)
Color
2019-07-05
3 months
Current stock price Evaluation
Stock price rise
probability score
Investment opinion Prospective purchase amount
56,700 W Mid 44.2 Normal 2,000,000 W
Suggested Purchase
Amount 661,416 W
Number of stocks
purchased 12
Indication price Range Buying / Selling Buying / Selling [Stocks]
High price 86,904 W 86,904 W~ ~ 75,044 W 53 % -352,336 W -4
High mid 75,044 W 75,044 W ~ 63,184 W 32 % -213,988 W -3
Mid 63,184 W 63,184 W ~ 51,324 W 11 % -75,641 W -1
Low mid 51,324 W 51,324 W ~ 39,465 W -9 % 62,707 W 1
low price 39,465 W 39,465 W ~ 0 W -30 % 201,054 W 5
Stock price rise
probability score
A Sector 44.6 48.1 46.1 45.3 48.8 49.3
44.2B Sector 35.0 42.1 35.4 45.3 32.9 13.8
Total average
2019.02.08 2019.03.11 2019.04.08 2019.05.08 2019.06.05 2019.07.04
39.8 45.1 40.7 30.8 40.8 31.5
25 % -30 %
2019.03.11 2019.04.08 2019.05.08 2019.06.05 2019.07.04
Total of
increase rate
Total score
A Sector 7 % -4 % -2 % 7 % 1 %
-7 % 42.0B Sector 17 % -19 % 22 % -38 % -139 %
Total average 12 % -11 % -32 %
45
48 46 45
49 49
35
42
35
45
33
14
40
45
41
31
41
32
0
10
20
30
40
50
60
2019.02.08 2019.03.11 2019.04.08 2019.05.08 2019.06.05 2019.07.04
Stock price rise probability score
A sector
B sector
Total average
7%
-4% -2%
7% 1%
17%
-19%
22%
-38%
-139%
12%
-11%
-32%
25%
-30%
-150%
-100%
-50%
0%
50%
2019.03.11 2019.04.08 2019.05.08 2019.06.05 2019.07.04
Increase rate of stock price rise
A sector
B sector
Total average
celltrionhealthcare](data:image/gif;base64,R0lGODlhAQABAIAAAAAAAP///yH5BAEAAAAALAAAAAABAAEAAAIBRAA7)
Recommended
Recommended
More Related Content
What's hot
What's hot (20)
Similar to Analysis of Algorithm Company Performance and Stock Price Prediction
Similar to Analysis of Algorithm Company Performance and Stock Price Prediction (20)
More from 알고리즘 기업분석 컨설팅-알기컨,algikeon
More from 알고리즘 기업분석 컨설팅-알기컨,algikeon (20)
Recently uploaded
Recently uploaded (20)
Analysis of Algorithm Company Performance and Stock Price Prediction
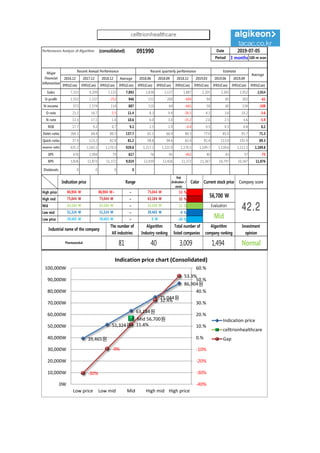
- 1. Performance Analysis of Algorithm (consolidated) 091990 Date Period 3 months 100-m won 2016.12 2017.12 2018.12 Average 2018.06 2018.09 2018.12 2019.03 2019.06 2019.09 IFRS(Con) IFRS(Con) IFRS(Con) IFRS(Con) IFRS(Con) IFRS(Con) IFRS(Con) IFRS(Con) IFRS(Con) IFRS(Con) IFRS(Con) Sales 7,333 9,209 7,135 7,892 1,838 2,127 1,887 2,205 2,365 2,952 2,014 O-profit 1,553 1,537 -252 946 152 200 -689 94 85 302 -61 N-income 972 1,574 114 887 110 64 -665 58 60 134 -108 O-rate 21.2 16.7 -3.5 11.4 8.3 9.4 -36.5 4.3 3.6 10.2 -3.6 N-rate 13.3 17.1 1.6 10.6 6.0 3.0 -35.2 2.6 2.5 4.6 -5.9 ROE 17.7 9.2 0.7 9.2 2.5 1.9 -4.0 0.5 0.5 0.8 0.2 Debt-ratio 264.5 68.4 80.3 137.7 61.1 66.9 80.3 77.0 85.0 93.7 71.3 Quick-ratio 37.9 123.2 82.4 81.2 98.8 94.6 82.4 81.4 113.0 192.9 89.3 reserve-ratio 435.2 1,183.1 1,170.5 929.6 1,217.2 1,221.9 1,170.5 1,149.7 1,130.6 1,112.3 1,189.8 EPS 676 1,094 79 617 76 45 -462 40 43 57 -75 BPS 3,826 11,873 11,372 9,024 12,439 12,426 11,372 11,267 10,797 10,347 11,876 Dividends 0 0 0 0 2019-07-05 Major Financial Information Recent Annual Performance Recent quarterly performance Estimate Average Gap (Indication / stock) Color High price ~ 53 % High mid ~ 32 % Mid ~ 11 % Low mid ~ -9 % Low price ~ -30 % Indication price Range Current stock price Company score 75,044 W 75,044 W 63,184 W 63,184 W 63,184 W 51,324 W Evaluation 86,904 W 86,904 W~ 75,044 W 56,700 W 42.251,324 W 51,324 W 39,465 W Mid Normal 39,465 W 39,465 W 0 W Industrial name of the company The number of All industries Algorithm Industry ranking Total number of listed companies Algorithm company ranking Investment opinion Pharmaceutical 81 40 3,009 1,494 39,465원 51,324원 63,184원 75,044원 86,904원 Mid 56,700원 -30% -9% 11.4% 32.4% 53.3% -40% -30% -20% -10% 0.% 10.% 20.% 30.% 40.% 50.% 60.% 0W 10,000W 20,000W 30,000W 40,000W 50,000W 60,000W 70,000W 80,000W 90,000W 100,000W Low price Low mid Mid High mid High price Indication price chart (Consolidated) Indication price celltrionhealthcare Gap celltrionhealthcare
- 2. [Price for scheduled purchasing] Arbitrarily made Algorithm stocks Trading Strategies (consolidated) 091990 Date Period Gap (Indication / stock) Color 2019-07-05 3 months Current stock price Evaluation Stock price rise probability score Investment opinion Prospective purchase amount 56,700 W Mid 44.2 Normal 2,000,000 W Suggested Purchase Amount 661,416 W Number of stocks purchased 12 Indication price Range Buying / Selling Buying / Selling [Stocks] High price 86,904 W 86,904 W~ ~ 75,044 W 53 % -352,336 W -4 High mid 75,044 W 75,044 W ~ 63,184 W 32 % -213,988 W -3 Mid 63,184 W 63,184 W ~ 51,324 W 11 % -75,641 W -1 Low mid 51,324 W 51,324 W ~ 39,465 W -9 % 62,707 W 1 low price 39,465 W 39,465 W ~ 0 W -30 % 201,054 W 5 Stock price rise probability score A Sector 44.6 48.1 46.1 45.3 48.8 49.3 44.2B Sector 35.0 42.1 35.4 45.3 32.9 13.8 Total average 2019.02.08 2019.03.11 2019.04.08 2019.05.08 2019.06.05 2019.07.04 39.8 45.1 40.7 30.8 40.8 31.5 25 % -30 % 2019.03.11 2019.04.08 2019.05.08 2019.06.05 2019.07.04 Total of increase rate Total score A Sector 7 % -4 % -2 % 7 % 1 % -7 % 42.0B Sector 17 % -19 % 22 % -38 % -139 % Total average 12 % -11 % -32 % 45 48 46 45 49 49 35 42 35 45 33 14 40 45 41 31 41 32 0 10 20 30 40 50 60 2019.02.08 2019.03.11 2019.04.08 2019.05.08 2019.06.05 2019.07.04 Stock price rise probability score A sector B sector Total average 7% -4% -2% 7% 1% 17% -19% 22% -38% -139% 12% -11% -32% 25% -30% -150% -100% -50% 0% 50% 2019.03.11 2019.04.08 2019.05.08 2019.06.05 2019.07.04 Increase rate of stock price rise A sector B sector Total average celltrionhealthcare
- 3. 정보와 완전 정보 결 투자판단 있습니 위배 무단으 숙지하 Compliance notice ① The information provided by The Algorithm Company Analysis Consulting is obtained through reliable data and information and The Algorithm Company Analysis Program (TACAP), but its accuracy or completeness are not guaranteed. Furthermore, it may change over time.Therefore, we are not legally responsible for the results of the data provided by The Algorithm Company Analysis Consulting because of information errors or omissions. ② The Algorithm Company Analysis Consulting and all the information provided on it site are reference materials for investment decisions and the final responsibility of investment is up to users utilizing this information. ③ The Algorithm Company Analysis Consulting and its site do not do anything that violates the related laws such as discretionary transaction. ④ Users can not reallocate and recycle the information provided by The Algorithm Company Analysis Consulting firm let alone the information provided by its Site. ⑤ Be sure to know about application period of this algorithm analysis report in order to improve its accuracy. Tel : 070 - 4667 - 5009 Email : tacac@tacac.co.kr Homepage : tacac.co.kr Blog : tacac.blog.me SERVICES M&A, IPO, RECOVER, CORPORATE RESTRUCTURING, MANAGEMENT OF TECHNOLOGY, BUSINESS STRATEGY, FAMILY BUSINESS Request : http://tacac.co.kr/?page_id=1374 ① Consulting The Algori accuracy o change ove results of Consulting ② informatio investmen up ③ do anythin transaction ④ The Algori informatio ⑤ analysis re