Download to read offline

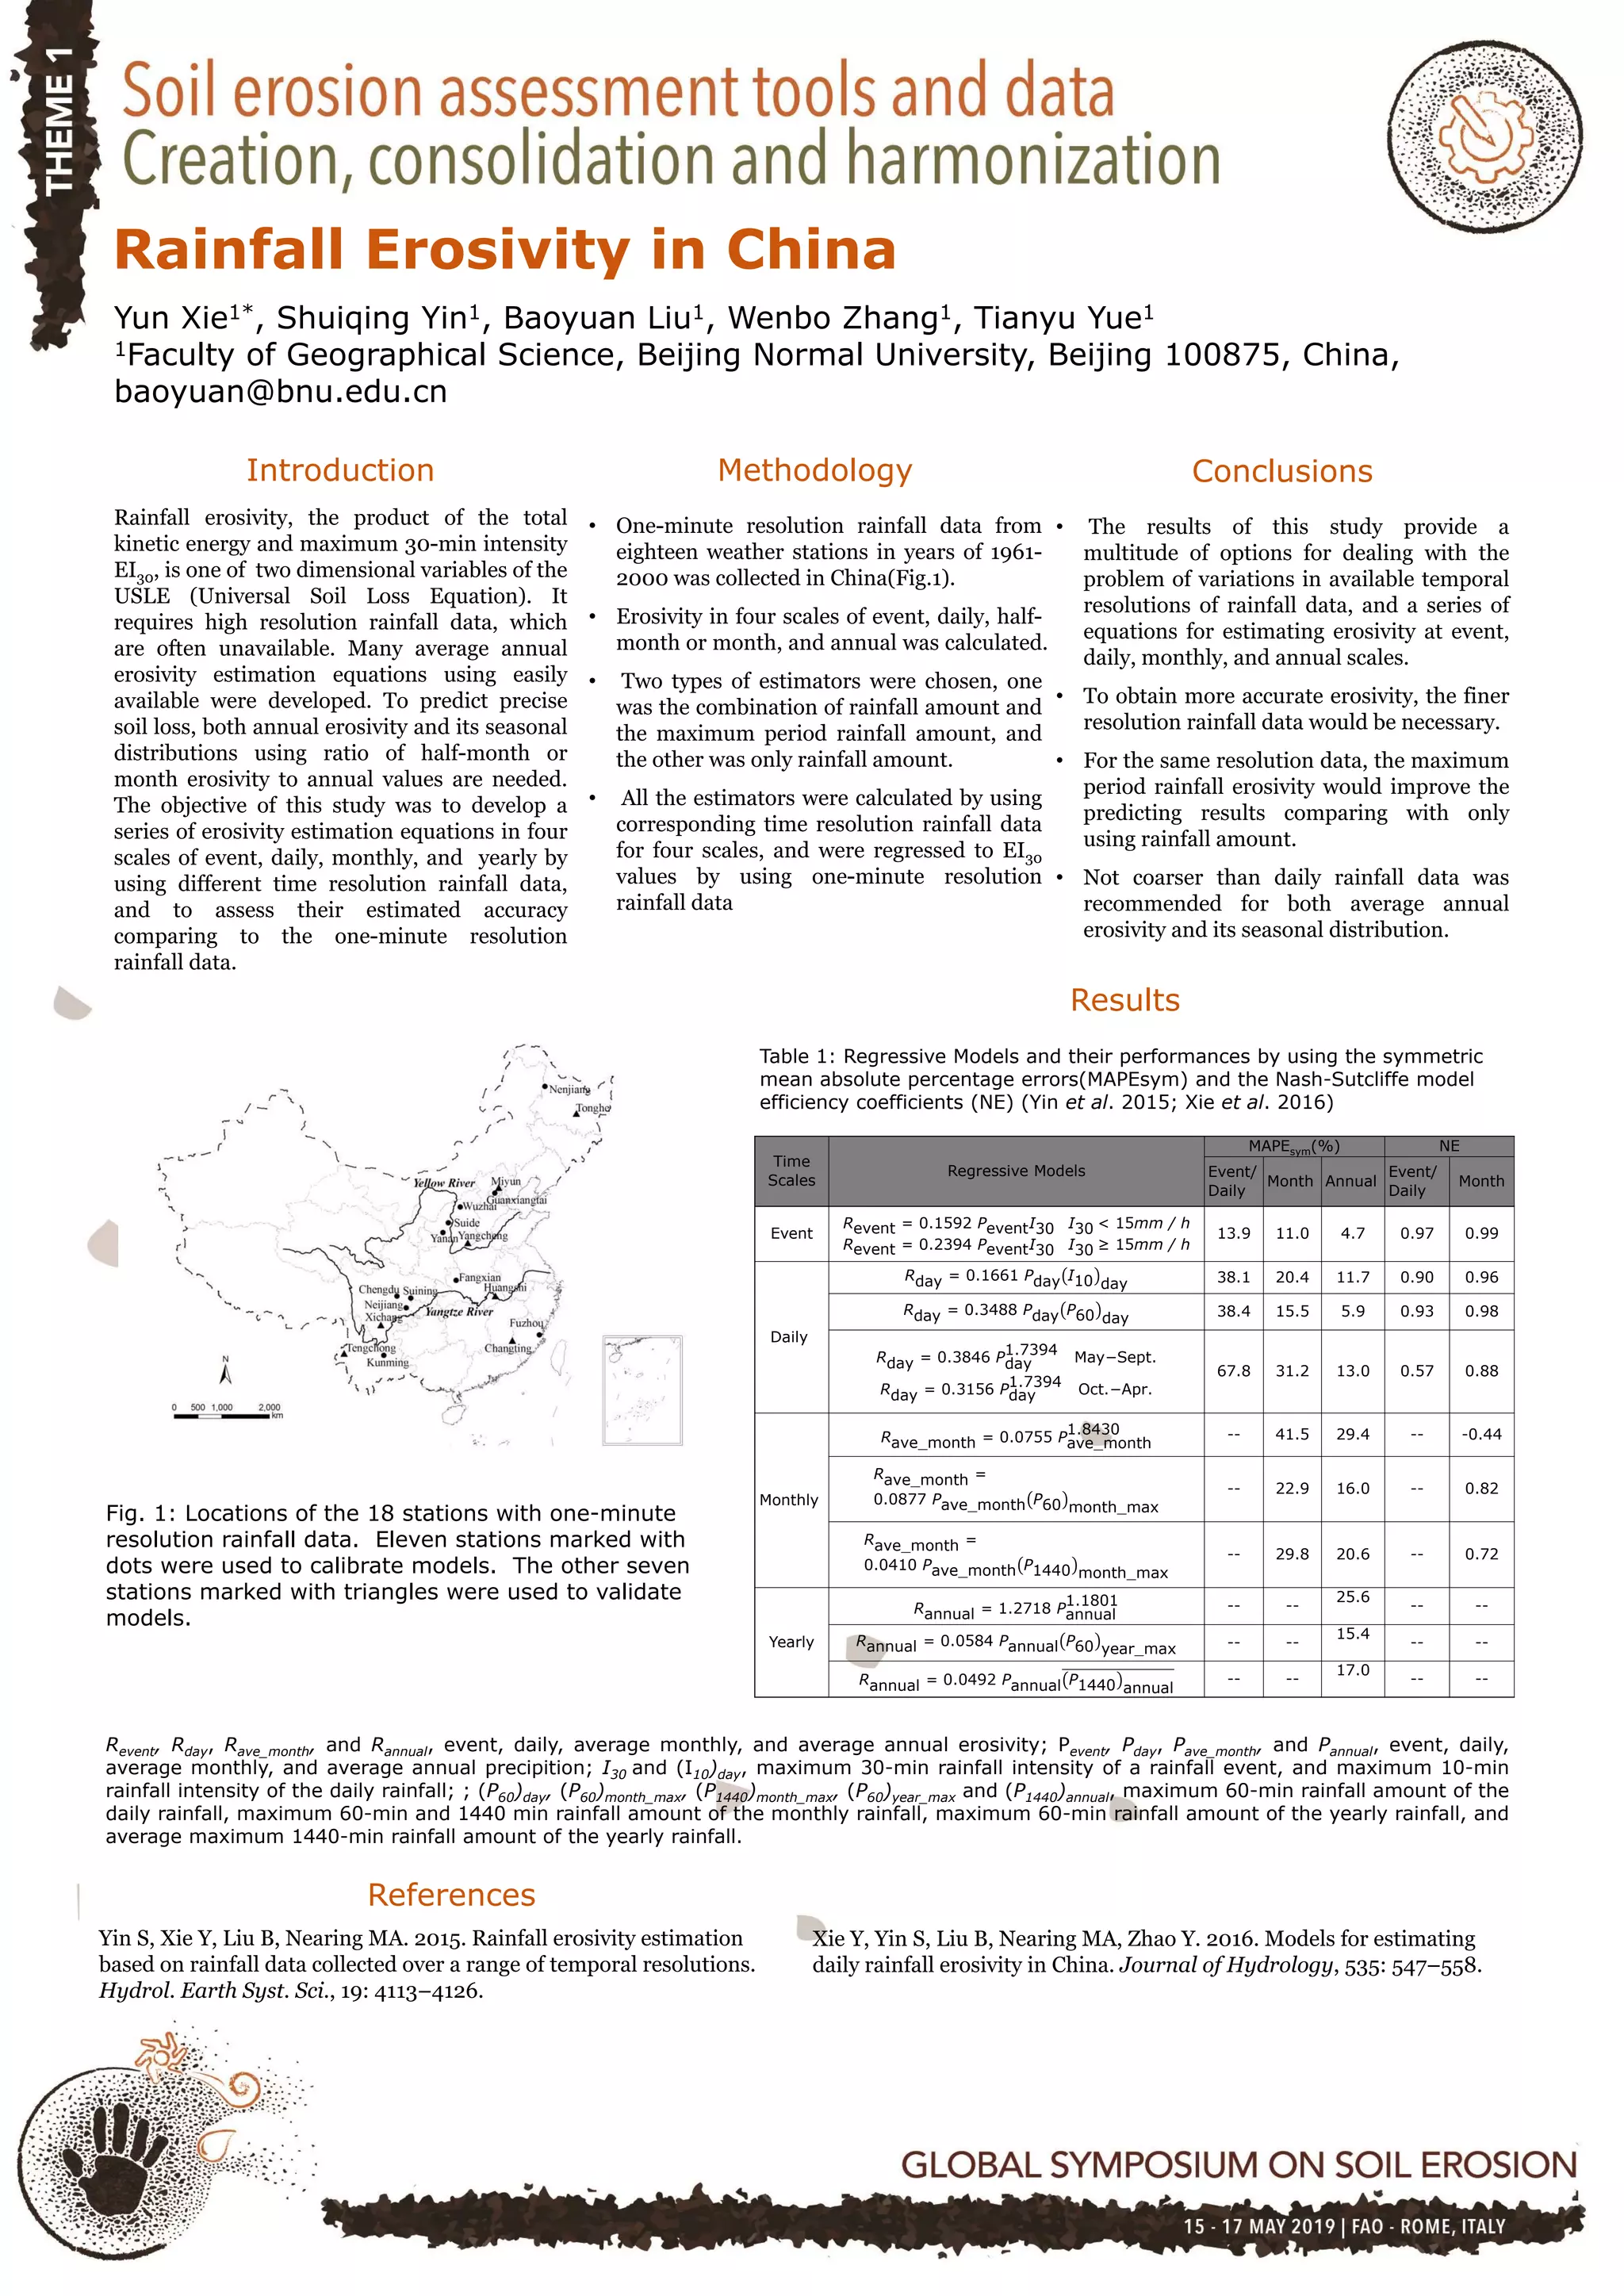

The study develops a series of rainfall erosivity estimation equations using different temporal resolutions of rainfall data in China, addressing the need for high-resolution data to predict soil loss accurately. It presents methodologies for estimating erosivity at event, daily, monthly, and yearly scales while comparing against one-minute resolution data. The findings suggest that finer resolution data improves prediction accuracy and that maximum period rainfall erosivity offers better results than using rainfall amount alone.