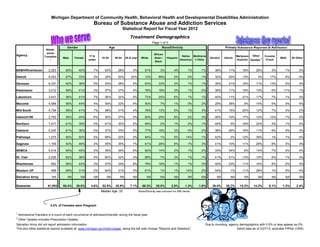
1. Male Female
17 &
under
18-35 36-54 55 & over White
African
Amer./
Black
Hispanic
Native
American
Multiracia
l/ Other
Alcohol Heroin
Marijuana
/Hashish
Other
Opiates 2
Cocaine
/Crack
Meth All Other
BABH/Riverhaven 2,283 60% 40% 7% 63% 28% 3% 91% 3% 4% 1% 1% 36% 11% 18% 29% 3% 1% 2%
Detroit 9,053 67% 33% 3% 25% 52% 20% 12% 86% 2% 0% 1% 32% 35% 13% 3% 17% 0% 0%
Genesee 6,337 62% 38% 5% 52% 38% 5% 63% 33% 2% 1% 1% 35% 21% 18% 11% 13% 0% 3%
Kalamazoo 3,012 59% 41% 3% 57% 37% 4% 78% 16% 3% 1% 2% 39% 11% 19% 13% 6% 11% 1%
Lakeshore 3,641 59% 41% 7% 56% 32% 5% 73% 20% 6% 1% 1% 40% 11% 21% 17% 7% 1% 3%
Macomb 4,586 56% 44% 4% 59% 32% 4% 90% 7% 1% 0% 2% 29% 38% 9% 14% 6% 0% 4%
Mid-South 4,756 59% 41% 7% 58% 31% 4% 78% 13% 5% 1% 3% 41% 15% 20% 12% 7% 3% 2%
network180 2,762 55% 45% 6% 52% 37% 5% 62% 25% 8% 2% 3% 46% 10% 17% 12% 12% 1% 2%
Northern 7,471 61% 39% 5% 61% 30% 5% 94% 2% 1% 2% 1% 49% 5% 18% 22% 2% 1% 2%
Oakland 5,340 61% 39% 5% 57% 33% 5% 77% 19% 3% 0% 2% 38% 26% 16% 11% 6% 0% 3%
Pathways 1,675 50% 50% 5% 69% 22% 3% 84% 1% 0% 14% 1% 42% 2% 12% 39% 1% 1% 4%
Saginaw 1,195 54% 46% 4% 55% 35% 7% 61% 28% 8% 1% 3% 41% 10% 11% 28% 8% 0% 3%
SEMCA 5,516 60% 40% 3% 55% 36% 6% 82% 14% 2% 1% 2% 33% 34% 8% 14% 7% 0% 4%
St. Clair 2,026 62% 38% 4% 60% 32% 4% 88% 7% 3% 1% 1% 41% 21% 13% 15% 6% 1% 3%
Washtenaw 952 56% 44% 3% 57% 34% 6% 78% 18% 1% 1% 3% 40% 23% 11% 15% 8% 0% 3%
Western UP 488 69% 31% 2% 64% 31% 3% 81% 1% 1% 14% 2% 54% 1% 11% 28% 1% 0% 4%
Salvation Army NA NA NA NA NA NA NA NA NA NA NA NA NA NA NA NA NA NA NA
Statewide 61,093 60.4% 39.6% 4.6% 52.5% 35.8% 7.1% 69.3% 25.0% 2.8% 1.3% 1.6% 38.0% 20.7% 15.2% 14.3% 8.1% 1.3% 2.4%
Race/Ethnicity was unknown for 588 clients.
3.4% of Females were Pregnant
1
Admissions/Transfers is a count of each occurrence of admission/transfer during the fiscal year.
2
Other Opiates includes Prescription Opiates.
Salvation Army did not report admission information. Due to rounding, agency demographics with 0.5% or less appear as 0%.
Admit data as of 2/27/13, excludes PIPHs (1200)
Michigan Department of Community Health, Behavioral Health and Developmental Disabilities Administration
Bureau of Substance Abuse and Addiction Services
Statistical Report for Fiscal Year 2012
Treatment Demographics
Page 1 of 3
Gender Race/Ethnicity Primary Substance Reported at Admission
This and other statistical reports available at: www.michigan.gov/mdch-bsaas, along the left side choose "Reports and Statistics".
Median Age: 33
Admis-
sions/
Transfers
1
Agency
Age
2. Less than
HS
Completed
HS
More than
HS
Employed Unemployed Other None
Under
$10,000
$10,000-
$30,000
Over
$30,000
Independent Dependent Homeless
2,283 31% 48% 21% 18% 60% 22% 44% 36% 20% 1% 75% 19% 6%
9,053 44% 42% 14% 4% 62% 34% 61% 34% 4% 0% 35% 38% 28%
6,337 40% 42% 18% 11% 59% 29% 49% 20% 8% 23% 50% 29% 21%
3,012 24% 54% 22% 20% 67% 13% 58% 25% 16% 1% 78% 17% 5%
3,641 22% 62% 16% 19% 65% 16% 51% 26% 20% 3% 64% 31% 5%
4,586 29% 45% 26% 16% 56% 28% 54% 26% 18% 1% 90% 5% 5%
4,756 29% 48% 23% 14% 64% 22% 67% 19% 13% 1% 57% 37% 7%
2,762 31% 47% 22% 12% 65% 23% 48% 30% 20% 2% 61% 27% 12%
7,471 26% 53% 20% 25% 58% 18% 32% 32% 33% 3% 72% 21% 6%
5,340 27% 45% 27% 22% 59% 20% 43% 31% 22% 4% 72% 22% 7%
1,675 24% 45% 31% 22% 62% 16% 39% 38% 21% 2% 70% 25% 5%
1,195 32% 42% 26% 14% 60% 26% 38% 43% 18% 2% 68% 26% 6%
5,516 30% 46% 24% 12% 61% 27% 48% 35% 15% 1% 62% 28% 11%
2,026 27% 50% 23% 20% 56% 24% 50% 27% 18% 5% 76% 18% 6%
952 27% 35% 39% 23% 30% 47% 45% 31% 21% 3% 54% 29% 16%
488 22% 49% 28% 18% 72% 10% 67% 23% 9% 1% 62% 34% 4%
NA NA NA NA NA NA NA NA NA NA NA NA NA NA
61,093 31.3% 47.2% 21.5% 15.5% 60.4% 24.1% 50.0% 29.3% 16.6% 4.1% 62.5% 25.9% 11.5%
1
Admissions/Transfers is a count of each occurrence of admission/transfer during the fiscal year.
Salvation Army did not report admission information. Due to rounding, agency demographics with 0.5% or less appear as 0%.
Admit data as of 2/27/13, excludes PIPHs (1200)This and other statistical reports available at: www.michigan.gov/mdch-bsaas, along the left side choose "Reports and Statistics".
Michigan Department of Community Health, Behavioral Health and Developmental Disabilities Administration
Page 2 of 3
Treatment Demographics
Statistical Report for Fiscal Year 2012
Bureau of Substance Abuse and Addiction Services
Living Arrangements
Detroit
Genesee
Admis-
sions/
Transfers
1
Employment Status IncomeEducation Level
Agency
BABH/Riverhaven
Median Income: $1 per year.
Statewide
Kalamazoo
Lakeshore
Macomb
Washtenaw
Western UP
Northern
Mid-South
Oakland
Pathways
Saginaw
Salvation Army
SEMCA
St. Clair
network180
3. 994 0 125 88 665 5 203 52 85 1 65 31
44% 0% 5% 4% 29% 0% 9% 2% 4% 0% 3%
7,037 0 88 309 1,124 91 58 11 26 6 303 287
78% 0% 1% 3% 12% 1% 1% 0% 0% 0% 3%
3,897 4 249 190 1,589 11 121 125 128 1 22 152
61% 0% 4% 3% 25% 0% 2% 2% 2% 0% 0%
1,510 0 45 103 867 1 191 55 190 1 49 213
50% 0% 1% 3% 29% 0% 6% 2% 6% 0% 2%
1,689 7 11 206 1,287 20 88 115 137 1 80 69
46% 0% 0% 6% 35% 1% 2% 3% 4% 0% 2%
2,725 0 0 36 1,327 3 151 151 179 2 12 62
59% 0% 0% 1% 29% 0% 3% 3% 4% 0% 0%
1,974 0 523 154 1,312 21 360 88 232 2 90 152
42% 0% 11% 3% 28% 0% 8% 2% 5% 0% 2%
1,611 17 116 39 530 1 169 62 143 3 71 55
58% 1% 4% 1% 19% 0% 6% 2% 5% 0% 3%
2,490 0 27 451 3,582 12 298 127 436 0 48 289
33% 0% 0% 6% 48% 0% 4% 2% 6% 0% 1%
2,570 2 0 191 1,982 64 158 138 156 5 74 130
48% 0% 0% 4% 37% 1% 3% 3% 3% 0% 1%
734 0 5 59 543 2 91 50 158 1 32 44
44% 0% 0% 4% 32% 0% 5% 3% 9% 0% 2%
779 1 75 11 114 0 149 17 29 1 19 11
65% 0% 6% 1% 10% 0% 12% 1% 2% 0% 2%
3,387 0 1 132 1,579 10 41 145 170 4 47 64
61% 0% 0% 2% 29% 0% 1% 3% 3% 0% 1%
1,012 0 88 71 619 0 82 78 70 2 4 58
50% 0% 4% 4% 31% 0% 4% 4% 3% 0% 0%
621 1 18 11 213 4 1 31 41 1 10 11
65% 0% 2% 1% 22% 0% 0% 3% 4% 0% 1%
97 0 7 32 263 0 53 6 28 0 2 18
20% 0% 1% 7% 54% 0% 11% 1% 6% 0% 0%
NA NA NA NA NA NA NA NA NA NA NA NA
NA NA NA NA NA NA NA NA NA NA NA
33,127 32 1,378 2,083 17,596 245 2,214 1,251 2,208 31 928 1,646
2.7%
or reported any type involvement with the Correctional or Judicial system.
Salvation Army did not report admission information. 2.7% were involved in the Drug Court program.
1
Admissions/Transfers is a count of each occurrence of admission/transfer during the fiscal year. Due to rounding, agency demographics with 0.5% or less appear as 0%.
2
This data reflects what clients report at the time of their admission, it has not been corroborated.
Admit data as of 2/27/13, excludes PIPHs (1200)This and other statistical reports available at: www.michigan.gov/mdch-bsaas, along the left side choose "Reports and Statistics".
Court
Supervision
Awaiting TrialIn Jail Parole Probation
Juvenile
Detention
Center
5,516
1,195
2,283
6,337
9,053
2,762
4,756
4,586
3,012
44.2%
28.8%3.4%Statewide
27,007
54.2%
61,093
3,641
Lakeshore
Salvation Army
SEMCA
St. Clair
Washtenaw
Western UP
7,471
Saginaw
Oakland
Pathways
952
1,675
5,340
NA
488
Macomb
Mid-South
network180
Northern
2,026
0.1% 1.5%
Agency
Admis-
sions/
Transfers
1
Awaiting
Sentencing
Refused to
Provide Info
2.0%0.1%
BABH/Riverhaven
Detroit
Genesee
Kalamazoo
3.6%2.3% 0.4% 3.6%
Involved in
Drug Court
Michigan Department of Community Health, Behavioral Health and Developmental Disabilities Administration
Bureau of Substance Abuse and Addiction Services
Statistical Report for Fiscal Year 2012
Treatment Demographics
Page 3 of 3
Unknown
Reported Involvement with Correctional or Judicial System
2
None In Prison
4. Admissions is a count of each occurrence of admission/transfer during the fiscal year.
3.4% Percent of Females were Pregnant at Admission
Race/Ethnicity was unknown for 588 clients.
Median Age: 33
61,093 Total Admissions 2
Other Opiates includes Prescription Opiates.
Admit data as of 2/27/13, excludes PIPHs (1200)This and other statistical reports available at: www.michigan.gov/mdch-bsaas, along the left side choose "Reports and Statistics".
Page 1 of 2
Michigan Department of Community Health, Behavioral Health and Developmental Disabilities Administration
Bureau of Substance Abuse and Addiction Services
Statistical Report for Fiscal Year 2012
Treatment Demographics - Statewide Graphs
4.6%
52.5%
35.8%
7.1%
0%
10%
20%
30%
40%
50%
60%
70%
80%
17 & under 18-35 36-54 55 & over
Age Groups
Age at Admission
69.3%
25.0%
2.8% 1.3% 1.6%
0%
10%
20%
30%
40%
50%
60%
70%
80%
White African Amer./
Black
Hispanic Native American Multiracial/ Other
Race/Ethnic Groups
Race/Ethnicity at Admission
38.0%
35.0%
15.2%
8.1%
1.3% 2.4%
0%
10%
20%
30%
40%
50%
60%
70%
80%
Alcohol Heroin & Other
Opiates 2
Marijuana
/Hashish
Cocaine /Crack Metham-
phetamine
All Other
Primary Substances
Primary Substance Reported at Admission
Male
36,890
60.4%
Female
24,203
39.6%
Gender at Admission
5. 44.2% reported any type involvement with the Correctional or Judicial system.
Median Income: $1 per year.
61,093 Total Admissions Admissions is a count of each occurrence of admission/transfer during the fiscal year.
Admit data as of 2/27/13, excludes PIPHs (1200)This and other statistical reports available at: www.michigan.gov/mdch-bsaas, along the left side choose "Reports and Statistics".
Page 2 of 2
Michigan Department of Community Health, Behavioral Health and Developmental Disabilities Administration
Bureau of Substance Abuse and Addiction Services
Statistical Report for Fiscal Year 2012
Treatment Demographics - Statewide Graphs
54.2%
0.1% 2.3% 3.4%
28.8%
0.4%
3.6% 2.0% 3.6%
0.1% 1.5%
0%
10%
20%
30%
40%
50%
60%
70%
80%
None
InPrison
InJail
Parole
Probation
JuvenileDetentionCenter
CourtSupervision
AwaitingTrial
AwaitingSentencing
RefusedtoProvideInfo
Unknown
Correctional/Judicial Groups
Reported Involvement with Correctional or Judicial System at Admission
31.3%
47.2%
21.5%
0%
10%
20%
30%
40%
50%
60%
70%
80%
Less than
HS
Completed
HS
More than
HS
Education Groups
Education Level at Admission
15.5%
60.4%
24.1%
0%
10%
20%
30%
40%
50%
60%
70%
80%
Employed Unemployed Other
Employment Groups
Employment Status at
Admission
62.5%
25.9%
11.5%
0%
10%
20%
30%
40%
50%
60%
70%
80%
Independent Dependent Homeless
Housing Groups
Living Arrangements at
Admission
Yes 1,646
2.7%
No
59,447
97.3%
Involved in Drug Court Program at Admit
50.0%
29.3%
16.6%
4.1%
0%
10%
20%
30%
40%
50%
60%
70%
80%
None Under
$10,000
$10,000-
$30,000
Over
$30,000
Income Groups
Income at Admission