SLC Police Compstat Data for Week 2/19/18 - 2/25/18
•
0 likes•84 views

SLC Police Dept. Week ending 2/25/18 District 5 Data starts on Page 6.

Recommended
More Related Content
What's hot
What's hot (20)
Similar to SLC Police Compstat Data for Week 2/19/18 - 2/25/18
Similar to SLC Police Compstat Data for Week 2/19/18 - 2/25/18 (20)
More from ELPCO East Liberty Park Comm. Organization
More from ELPCO East Liberty Park Comm. Organization (20)
Recently uploaded
Recently uploaded (20)
SLC Police Compstat Data for Week 2/19/18 - 2/25/18
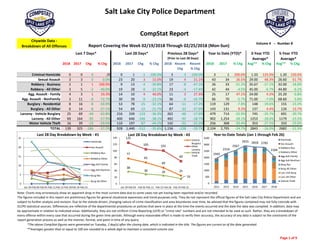
- 1. Salt Lake City Police Department 2018 2017 Chg % Chg 2018 2017 Chg % Chg 2018 Recent Chg Recent % Chg 2018 2017 % Chg Avg** % Chg Avg** % Chg Criminal Homicide 0 0 0 /0 0 1 ‐1 ‐100.0% 3 ‐3 ‐100.0% 3 1 200.0% 1.33 125.0% 1.20 150.0% Sexual Assault 3 3 0 0.0% 23 20 3 15.0% 19 4 21.1% 43 34 26.5% 29.00 48.3% 26.60 61.7% Robbery ‐ Business 2 1 1 100.0% 9 13 ‐4 ‐30.8% 17 ‐8 ‐47.1% 26 33 ‐21.2% 35.67 ‐27.1% 32.00 ‐18.8% Robbery ‐ All Other 3 5 ‐2 ‐40.0% 19 28 ‐9 ‐32.1% 23 ‐4 ‐17.4% 42 44 ‐4.5% 45.00 ‐6.7% 44.80 ‐6.2% Agg. Assault ‐ Family 4 3 1 33.3% 14 10 4 40.0% 11 3 27.3% 25 17 47.1% 24.00 4.2% 25.20 ‐0.8% Agg. Assault ‐ NonFamily 3 11 ‐8 ‐72.7% 30 39 ‐9 ‐23.1% 36 ‐6 ‐16.7% 66 70 ‐5.7% 71.00 ‐7.0% 68.60 ‐3.8% Burglary ‐ Residential 8 16 ‐8 ‐50.0% 53 78 ‐25 ‐32.1% 64 ‐11 ‐17.2% 119 129 ‐7.8% 148 ‐19.6% 155 ‐23.2% Burglary ‐ All Other 6 14 ‐8 ‐57.1% 54 69 ‐15 ‐21.7% 87 ‐33 ‐37.9% 143 131 9.2% 137 4.4% 126 13.7% Larceny ‐ Vehicle Burglary 25 69 ‐44 ‐63.8% 216 339 ‐123 ‐36.3% 262 ‐46 ‐17.6% 479 714 ‐32.9% 745 ‐35.7% 691 ‐30.7% Larceny ‐ All Other 69 164 ‐95 ‐57.9% 400 646 ‐246 ‐38.1% 492 ‐92 ‐18.7% 902 1,254 ‐28.1% 1253 ‐28.0% 1179 ‐23.5% Motor Vehicle Theft 16 39 ‐23 ‐59.0% 110 197 ‐87 ‐44.2% 142 ‐32 ‐22.5% 256 368 ‐30.4% 353 ‐27.5% 333 ‐23.0% TOTAL 139 325 ‐186 ‐57.2% 928 1,440 ‐512 ‐35.6% 1,156 ‐228 ‐19.7% 2,104 2,795 ‐24.7% 2843 ‐26.0% 2682 ‐21.5% Jan 29‐Feb 05‐Feb 12 Feb 19‐Feb 2012 2013 2014 2015 2016 2017 2018 Homicide 0 0 0 0 0 2 0 1 2 1 3 Sex Assault 6 6 8 3 27 19 27 19 34 34 43 Robbery ‐ Business 3 1 3 2 15 29 24 37 37 33 26 Robbery ‐ All Other 7 4 5 3 34 41 48 42 49 44 42 Aggravated Assault ‐ Family 5 3 2 4 18 26 28 30 25 17 25 Aggravated Assault ‐ All Other 4 12 11 3 51 67 63 61 82 70 66 Burglary ‐ Residential 23 12 10 8 119 163 168 177 138 129 119 Burglary ‐ All Other 18 19 11 6 81 136 82 155 125 131 143 Larceny ‐ Vehicle Burglary 77 65 49 25 552 558 660 772 750 714 479 Larceny ‐ All Other 125 105 101 69 873 994 1143 1262 1243 1254 902 Vehicle Theft 38 30 26 16 175 279 324 359 333 368 256 TOTALS 306 257 226 139 1945 2314 2567 2915 2818 2795 2104 Year‐to‐Date Totals (Jan 1 through Feb 26) Note: Charts may erroneously show an apparent drop in the most current data due to some cases not yet having been reported and/or recorded. The figures included in this report are preliminary figures for general situational awareness and trend purposes only. They do not represent the official figures of the Salt Lake City Police Department and are subject to further analysis and revision. Due to the statute‐driven, changing nature of crime classification and area boundaries over time, be advised that the figures contained may not fully coincide with SLCPD statistical sources. Differences are reflective of the departmental procedures or policies that were in place at the time the events occurred and the date the data was compiled. In addition, data may be approximate in relation to indicated areas. Additionally, they are not Uniform Crime Reporting (UCR) or "crime rate" numbers and are not intended to be used as such. Rather, they are a breakdown of every offense within every case that occurred during the given time periods. Although every reasonable effort is made to verify their accuracy, the accuracy of any data is subject to the constraints of the report generation process as well as the manner, format, and point in time of any query. *The above CompStat figures were generated on Tuesday, 2 day(s) after the closing date, which is indicated in the title. The figures are current as of the date generated. CompStat Report……. Citywide Data ‐ Breakdown of All Offenses Volume 4 ‐‐ Number 8 Last 7 Days* Last 28 Days* Previous 28 Days* (Prior to Last 28 Days) Year to Date (YTD)* 3‐Year YTD Average* 5‐Year YTD Average* **Averages greater than or equal to 100 are rounded to a whole digit to maintain a consistent column size. Report Covering the Week 02/19/2018 Through 02/25/2018 (Mon‐Sun) 0 5 10 15 20 25 Jan 29‐Feb 04 Feb 05‐Feb 11 Feb 12‐Feb 18 Feb 19‐Feb 25 Last 28 Day Breakdown by Week ‐ #1 Homicide Sex Assault Robbery‐Bus. Robbery‐Other Agg Aslt‐Family Agg Aslt‐NonFam Burg‐Res Burg‐All Other 1945 2314 2567 2915 2818 2795 2104 0 500 1000 1500 2000 2500 3000 3500 2012 2013 2014 2015 2016 2017 2018 Year‐to‐Date Totals (Jan 1 through Feb 26) Homicide Sex Assault Robbery‐Bus. Robbery‐Other Agg Aslt‐Family Agg Aslt‐NonFam Burg‐Res Burg‐All Other Larc‐Veh Burg Larc‐All Other Vehicle Theft 77 65 49 25 125 105 101 69 38 30 26 16 0 20 40 60 80 100 120 140 Jan 29‐Feb 04 Feb 05‐Feb 11 Feb 12‐Feb 18 Feb 19‐Feb 25 Last 28 Day Breakdown by Week ‐ #2 Vehicle Burglary Other Larceny Vehicle Theft Page 1 of 9
- 2. Salt Lake City Police Department 2018 2017 Chg % Chg 2018 2017 Chg % Chg 2018 Recent Chg Recent % Chg 2018 2017 % Chg Avg** % Chg Avg** % Chg Criminal Homicide 0 0 0 /0 0 0 0 /0 0 0 /0 0 0 /0 0.00 /0 0.00 /0 Sexual Assault 1 1 0 0.0% 4 3 1 33.3% 3 1 33.3% 8 6 33.3% 5.67 41.2% 5.00 60.0% Robbery ‐ Business 0 0 0 /0 0 1 ‐1 ‐100.0% 1 ‐1 ‐100.0% 1 5 ‐80.0% 6.33 ‐84.2% 4.40 ‐77.3% Robbery ‐ All Other 2 2 0 0.0% 6 12 ‐6 ‐50.0% 4 2 50.0% 10 18 ‐44.4% 16.33 ‐38.8% 16.20 ‐38.3% Agg. Assault ‐ Family 2 0 2 /0 2 0 2 /0 1 1 100.0% 3 1 200.0% 1.00 200.0% 1.20 150.0% Agg. Assault ‐ NonFamily 1 3 ‐2 ‐66.7% 10 11 ‐1 ‐9.1% 9 1 11.1% 19 22 ‐13.6% 19.67 ‐3.4% 18.40 3.3% Burglary ‐ Residential 0 1 ‐1 ‐100.0% 1 7 ‐6 ‐85.7% 2 ‐1 ‐50.0% 3 8 ‐62.5% 6.00 ‐50.0% 4.60 ‐34.8% Burglary ‐ All Other 0 5 ‐5 ‐100.0% 0 11 ‐11 ‐100.0% 6 ‐6 ‐100.0% 6 18 ‐66.7% 15.33 ‐60.9% 13.60 ‐55.9% Larceny ‐ Vehicle Burglary 3 13 ‐10 ‐76.9% 20 56 ‐36 ‐64.3% 35 ‐15 ‐42.9% 55 108 ‐49.1% 115 ‐52.0% 95.60 ‐42.5% Larceny ‐ All Other 9 31 ‐22 ‐71.0% 48 127 ‐79 ‐62.2% 57 ‐9 ‐15.8% 108 244 ‐55.7% 225 ‐52.1% 205 ‐47.4% Motor Vehicle Theft 2 4 ‐2 ‐50.0% 11 16 ‐5 ‐31.3% 9 2 22.2% 20 24 ‐16.7% 27.67 ‐27.7% 23.80 ‐16.0% TOTAL 20 60 ‐40 ‐66.7% 102 244 ‐142 ‐58.2% 127 ‐25 ‐19.7% 233 454 ‐48.7% 438 ‐46.8% 388 ‐40.0% Jan 29‐Feb 05‐Feb 12 Feb 19‐Feb 2012 2013 2014 2015 2016 2017 2018 Homicide 0 0 0 0 0 0 0 0 0 0 0 Sex Assault 1 1 1 1 5 2 6 4 7 6 8 Robbery ‐ Business 0 0 0 0 0 2 1 8 6 5 1 Robbery ‐ All Other 2 1 1 2 11 15 17 14 17 18 10 Aggravated Assault ‐ Family 0 0 0 2 0 0 3 1 1 1 3 Aggravated Assault ‐ All Other 0 5 4 1 11 18 15 15 22 22 19 Burglary ‐ Residential 1 0 0 0 1 4 1 4 6 8 3 Burglary ‐ All Other 0 0 0 0 8 12 10 14 14 18 6 Larceny ‐ Vehicle Burglary 7 7 3 3 158 76 58 125 111 108 55 Larceny ‐ All Other 14 13 12 9 100 146 205 231 201 244 108 Vehicle Theft 4 1 4 2 18 19 17 35 24 24 20 TOTALS 29 28 25 20 312 294 333 451 409 454 233 Year‐to‐Date Totals (Jan 1 through Feb 26) Note: Charts may erroneously show an apparent drop in the most current data due to some cases not yet having been reported and/or recorded. The figures included in this report are preliminary figures for general situational awareness and trend purposes only. They do not represent the official figures of the Salt Lake City Police Department and are subject to further analysis and revision. Due to the statute‐driven, changing nature of crime classification and area boundaries over time, be advised that the figures contained may not fully coincide with SLCPD statistical sources. Differences are reflective of the departmental procedures or policies that were in place at the time the events occurred and the date the data was compiled. In addition, data may be approximate in relation to indicated areas. Additionally, they are not Uniform Crime Reporting (UCR) or "crime rate" numbers and are not intended to be used as such. Rather, they are a breakdown of every offense within every case that occurred during the given time periods. Although every reasonable effort is made to verify their accuracy, the accuracy of any data is subject to the constraints of the report generation process as well as the manner, format, and point in time of any query. *The above CompStat figures were generated on Tuesday, 2 day(s) after the closing date, which is indicated in the title. The figures are current as of the date generated. **Averages greater than or equal to 100 are rounded to a whole digit to maintain a consistent column size. ***The Rio Grande District is defined as the area from North Temple to 700 South and State Street to I‐15. However, this area overlaps other districts covered with the SLCPD CompStat Report, namely parts of Districts 3 & 4. As a result, the data contained within the Rio Grande District may also be listed in the data for other areas. CompStat Report……. Rio Grande District*** Breakdown of All Offenses Report Covering the Week 02/19/2018 Through 02/25/2018 (Mon‐Sun) Volume 4 ‐‐ Number 8 Last 7 Days* Last 28 Days* Previous 28 Days* (Prior to Last 28 Days) Year to Date (YTD)* 3‐Year YTD Average* 5‐Year YTD Average* 0 1 2 3 4 5 6 Jan 29‐Feb 04 Feb 05‐Feb 11 Feb 12‐Feb 18 Feb 19‐Feb 25 Last 28 Day Breakdown by Week ‐ #1 Homicide Sex Assault Robbery‐Bus. Robbery‐Other Agg Aslt‐Family Agg Aslt‐NonFam Burg‐Res Burg‐All Other 312 294 333 451 409 454 233 0 50 100 150 200 250 300 350 400 450 500 2012 2013 2014 2015 2016 2017 2018 Year‐to‐Date Totals (Jan 1 through Feb 26) Homicide Sex Assault Robbery‐Bus. Robbery‐Other Agg Aslt‐Family Agg Aslt‐NonFam Burg‐Res Burg‐All Other Larc‐Veh Burg Larc‐All Other Vehicle Theft 0 2 4 6 8 10 12 14 16 Jan 29‐Feb 04 Feb 05‐Feb 11 Feb 12‐Feb 18 Feb 19‐Feb 25 Last 28 Day Breakdown by Week ‐ #2 Vehicle Burglary Other Larceny Vehicle Theft Page 2 of 9
- 3. Salt Lake City Police Department 2018 2017 Chg % Chg 2018 2017 Chg % Chg 2018 Recent Chg Recent % Chg 2018 2017 % Chg Avg** % Chg Avg** % Chg Criminal Homicide 0 0 0 /0 0 0 0 /0 0 0 /0 0 0 /0 0.33 ‐100.0% 0.20 ‐100.0% Sexual Assault 0 1 ‐1 ‐100.0% 3 2 1 50.0% 2 1 50.0% 5 3 66.7% 2.33 114.3% 2.60 92.3% Robbery ‐ Business 1 0 1 /0 2 0 2 /0 0 2 /0 2 1 100.0% 1.33 50.0% 1.60 25.0% Robbery ‐ All Other 0 0 0 /0 0 1 ‐1 ‐100.0% 0 0 /0 0 2 ‐100.0% 5.00 ‐100.0% 5.00 ‐100.0% Agg. Assault ‐ Family 0 1 ‐1 ‐100.0% 3 3 0 0.0% 2 1 50.0% 5 5 0.0% 5.67 ‐11.8% 4.80 4.2% Agg. Assault ‐ NonFamily 0 1 ‐1 ‐100.0% 1 5 ‐4 ‐80.0% 1 0 0.0% 2 9 ‐77.8% 7.67 ‐73.9% 8.00 ‐75.0% Burglary ‐ Residential 2 3 ‐1 ‐33.3% 4 11 ‐7 ‐63.6% 9 ‐5 ‐55.6% 13 15 ‐13.3% 15.00 ‐13.3% 18.40 ‐29.3% Burglary ‐ All Other 1 0 1 /0 4 4 0 0.0% 7 ‐3 ‐42.9% 11 9 22.2% 10.67 3.1% 11.40 ‐3.5% Larceny ‐ Vehicle Burglary 2 3 ‐1 ‐33.3% 19 31 ‐12 ‐38.7% 10 9 90.0% 29 67 ‐56.7% 63.67 ‐54.5% 58.00 ‐50.0% Larceny ‐ All Other 2 4 ‐2 ‐50.0% 23 28 ‐5 ‐17.9% 25 ‐2 ‐8.0% 49 56 ‐12.5% 70.67 ‐30.7% 71.60 ‐31.6% Motor Vehicle Theft 3 8 ‐5 ‐62.5% 19 25 ‐6 ‐24.0% 16 3 18.8% 35 60 ‐41.7% 57.00 ‐38.6% 58.20 ‐39.9% TOTAL 11 21 ‐10 ‐47.6% 78 110 ‐32 ‐29.1% 72 6 8.3% 151 227 ‐33.5% 239 ‐36.9% 240 ‐37.0% Jan 29‐Feb 05‐Feb 12 Feb 19‐Feb 2012 2013 2014 2015 2016 2017 2018 Homicide 0 0 0 0 0 0 0 0 1 0 0 Sex Assault 2 0 1 0 4 4 2 2 2 3 5 Robbery ‐ Business 0 0 1 1 0 0 4 2 1 1 2 Robbery ‐ All Other 0 0 0 0 4 4 6 8 5 2 0 Aggravated Assault ‐ Family 1 2 0 0 5 4 3 5 7 5 5 Aggravated Assault ‐ All Other 1 0 0 0 4 13 4 4 10 9 2 Burglary ‐ Residential 1 1 0 2 19 23 24 17 13 15 13 Burglary ‐ All Other 1 2 0 1 10 19 6 12 11 9 11 Larceny ‐ Vehicle Burglary 7 7 3 2 37 45 54 65 59 67 29 Larceny ‐ All Other 8 5 8 2 80 63 83 75 81 56 49 Vehicle Theft 5 7 4 3 20 62 58 54 57 60 35 TOTALS 26 24 17 11 183 237 244 244 247 227 151 Year‐to‐Date Totals (Jan 1 through Feb 26) Note: Charts may erroneously show an apparent drop in the most current data due to some cases not yet having been reported and/or recorded. The figures included in this report are preliminary figures for general situational awareness and trend purposes only. They do not represent the official figures of the Salt Lake City Police Department and are subject to further analysis and revision. Due to the statute‐driven, changing nature of crime classification and area boundaries over time, be advised that the figures contained may not fully coincide with SLCPD statistical sources. Differences are reflective of the departmental procedures or policies that were in place at the time the events occurred and the date the data was compiled. In addition, data may be approximate in relation to indicated areas. Additionally, they are not Uniform Crime Reporting (UCR) or "crime rate" numbers and are not intended to be used as such. Rather, they are a breakdown of every offense within every case that occurred during the given time periods. Although every reasonable effort is made to verify their accuracy, the accuracy of any data is subject to the constraints of the report generation process as well as the manner, format, and point in time of any query. CompStat Report……. Council District 1 ‐ Breakdown of All Offenses *The above CompStat figures were generated on Tuesday, 2 day(s) after the closing date, which is indicated in the title. The figures are current as of the date generated. Last 7 Days* Last 28 Days* Previous 28 Days* (Prior to Last 28 Days) Year to Date (YTD)* 3‐Year YTD Average* 5‐Year YTD Average* Volume 4 ‐‐ Number 8 **Averages greater than or equal to 100 are rounded to a whole digit to maintain a consistent column size. Report Covering the Week 02/19/2018 Through 02/25/2018 (Mon‐Sun) 0 1 2 3 Jan 29‐Feb 04 Feb 05‐Feb 11 Feb 12‐Feb 18 Feb 19‐Feb 25 Last 28 Day Breakdown by Week ‐ #1 Homicide Sex Assault Robbery‐Bus. Robbery‐Other Agg Aslt‐Family Agg Aslt‐NonFam Burg‐Res Burg‐All Other 183 237 244 244 247 227 151 0 50 100 150 200 250 300 2012 2013 2014 2015 2016 2017 2018 Year‐to‐Date Totals (Jan 1 through Feb 26) Homicide Sex Assault Robbery‐Bus. Robbery‐Other Agg Aslt‐Family Agg Aslt‐NonFam Burg‐Res Burg‐All Other Larc‐Veh Burg Larc‐All Other Vehicle Theft 0 1 2 3 4 5 6 7 8 9 Jan 29‐Feb 04 Feb 05‐Feb 11 Feb 12‐Feb 18 Feb 19‐Feb 25 Last 28 Day Breakdown by Week ‐ #2 Vehicle Burglary Other Larceny Vehicle Theft Page 3 of 9
- 4. Salt Lake City Police Department 2018 2017 Chg % Chg 2018 2017 Chg % Chg 2018 Recent Chg Recent % Chg 2018 2017 % Chg Avg** % Chg Avg** % Chg Criminal Homicide 0 0 0 /0 0 0 0 /0 0 0 /0 0 0 /0 0.33 ‐100.0% 0.20 ‐100.0% Sexual Assault 1 0 1 /0 6 2 4 200.0% 1 5 500.0% 7 5 40.0% 4.00 75.0% 4.40 59.1% Robbery ‐ Business 1 0 1 /0 2 2 0 0.0% 3 ‐1 ‐33.3% 5 4 25.0% 5.33 ‐6.2% 4.60 8.7% Robbery ‐ All Other 0 1 ‐1 ‐100.0% 6 6 0 0.0% 6 0 0.0% 12 8 50.0% 8.00 50.0% 7.40 62.2% Agg. Assault ‐ Family 0 0 0 /0 2 1 1 100.0% 4 ‐2 ‐50.0% 6 3 100.0% 6.33 ‐5.3% 5.60 7.1% Agg. Assault ‐ NonFamily 1 2 ‐1 ‐50.0% 5 6 ‐1 ‐16.7% 11 ‐6 ‐54.5% 16 12 33.3% 12.67 26.3% 11.20 42.9% Burglary ‐ Residential 2 4 ‐2 ‐50.0% 13 11 2 18.2% 13 0 0.0% 27 20 35.0% 17.67 52.8% 24.00 12.5% Burglary ‐ All Other 1 1 0 0.0% 10 15 ‐5 ‐33.3% 18 ‐8 ‐44.4% 28 27 3.7% 33.67 ‐16.8% 28.00 0.0% Larceny ‐ Vehicle Burglary 3 9 ‐6 ‐66.7% 25 44 ‐19 ‐43.2% 32 ‐7 ‐21.9% 57 89 ‐36.0% 95.33 ‐40.2% 87.40 ‐34.8% Larceny ‐ All Other 10 21 ‐11 ‐52.4% 59 77 ‐18 ‐23.4% 59 0 0.0% 121 140 ‐13.6% 160 ‐24.4% 165 ‐26.8% Motor Vehicle Theft 5 10 ‐5 ‐50.0% 29 40 ‐11 ‐27.5% 30 ‐1 ‐3.3% 59 86 ‐31.4% 78.67 ‐25.0% 73.00 ‐19.2% TOTAL 24 48 ‐24 ‐50.0% 157 204 ‐47 ‐23.0% 177 ‐20 ‐11.3% 338 394 ‐14.2% 422 ‐19.9% 411 ‐17.8% Jan 29‐Feb 05‐Feb 12 Feb 19‐Feb 2012 2013 2014 2015 2016 2017 2018 Homicide 0 0 0 0 0 0 0 0 1 0 0 Sex Assault 0 2 3 1 5 2 8 4 3 5 7 Robbery ‐ Business 0 0 1 1 5 4 3 8 4 4 5 Robbery ‐ All Other 1 3 2 0 6 5 8 5 11 8 12 Aggravated Assault ‐ Family 2 0 0 0 5 5 4 9 7 3 6 Aggravated Assault ‐ All Other 0 0 4 1 9 9 9 10 16 12 16 Burglary ‐ Residential 6 2 3 2 16 35 32 24 9 20 27 Burglary ‐ All Other 2 4 3 1 23 26 13 42 32 27 28 Larceny ‐ Vehicle Burglary 5 7 10 3 71 65 86 69 128 89 57 Larceny ‐ All Other 17 16 16 10 172 163 183 176 164 140 121 Vehicle Theft 8 7 9 5 51 59 70 75 75 86 59 TOTALS 41 41 51 24 363 373 416 422 450 394 338 Year‐to‐Date Totals (Jan 1 through Feb 26) Note: Charts may erroneously show an apparent drop in the most current data due to some cases not yet having been reported and/or recorded. The figures included in this report are preliminary figures for general situational awareness and trend purposes only. They do not represent the official figures of the Salt Lake City Police Department and are subject to further analysis and revision. Due to the statute‐driven, changing nature of crime classification and area boundaries over time, be advised that the figures contained may not fully coincide with SLCPD statistical sources. Differences are reflective of the departmental procedures or policies that were in place at the time the events occurred and the date the data was compiled. In addition, data may be approximate in relation to indicated areas. Additionally, they are not Uniform Crime Reporting (UCR) or "crime rate" numbers and are not intended to be used as such. Rather, they are a breakdown of every offense within every case that occurred during the given time periods. Although every reasonable effort is made to verify their accuracy, the accuracy of any data is subject to the constraints of the report generation process as well as the manner, format, and point in time of any query. CompStat Report……. Council District 2 ‐ Breakdown of All Offenses *The above CompStat figures were generated on Tuesday, 2 day(s) after the closing date, which is indicated in the title. The figures are current as of the date generated. Last 7 Days* Last 28 Days* Previous 28 Days* (Prior to Last 28 Days) Year to Date (YTD)* 3‐Year YTD Average* 5‐Year YTD Average* Volume 4 ‐‐ Number 8 **Averages greater than or equal to 100 are rounded to a whole digit to maintain a consistent column size. Report Covering the Week 02/19/2018 Through 02/25/2018 (Mon‐Sun) 0 1 2 3 4 5 6 7 Jan 29‐Feb 04 Feb 05‐Feb 11 Feb 12‐Feb 18 Feb 19‐Feb 25 Last 28 Day Breakdown by Week ‐ #1 Homicide Sex Assault Robbery‐Bus. Robbery‐Other Agg Aslt‐Family Agg Aslt‐NonFam Burg‐Res Burg‐All Other 363 373 416 422 450 394 338 0 50 100 150 200 250 300 350 400 450 500 2012 2013 2014 2015 2016 2017 2018 Year‐to‐Date Totals (Jan 1 through Feb 26) Homicide Sex Assault Robbery‐Bus. Robbery‐Other Agg Aslt‐Family Agg Aslt‐NonFam Burg‐Res Burg‐All Other Larc‐Veh Burg Larc‐All Other Vehicle Theft 0 2 4 6 8 10 12 14 16 18 Jan 29‐Feb 04 Feb 05‐Feb 11 Feb 12‐Feb 18 Feb 19‐Feb 25 Last 28 Day Breakdown by Week ‐ #2 Vehicle Burglary Other Larceny Vehicle Theft Page 4 of 9
- 5. Salt Lake City Police Department 2018 2017 Chg % Chg 2018 2017 Chg % Chg 2018 Recent Chg Recent % Chg 2018 2017 % Chg Avg** % Chg Avg** % Chg Criminal Homicide 0 0 0 /0 0 0 0 /0 0 0 /0 0 0 /0 0.00 /0 0.00 /0 Sexual Assault 0 0 0 /0 2 2 0 0.0% 0 2 /0 2 4 ‐50.0% 3.67 ‐45.5% 3.20 ‐37.5% Robbery ‐ Business 0 0 0 /0 0 0 0 /0 1 ‐1 ‐100.0% 1 3 ‐66.7% 2.00 ‐50.0% 1.60 ‐37.5% Robbery ‐ All Other 1 0 1 /0 3 0 3 /0 1 2 200.0% 4 1 300.0% 3.00 33.3% 3.60 11.1% Agg. Assault ‐ Family 1 1 0 0.0% 2 3 ‐1 ‐33.3% 0 2 /0 2 3 ‐33.3% 2.33 ‐14.3% 2.00 0.0% Agg. Assault ‐ NonFamily 0 3 ‐3 ‐100.0% 2 6 ‐4 ‐66.7% 2 0 0.0% 4 8 ‐50.0% 7.67 ‐47.8% 6.20 ‐35.5% Burglary ‐ Residential 0 1 ‐1 ‐100.0% 6 14 ‐8 ‐57.1% 9 ‐3 ‐33.3% 15 16 ‐6.3% 20.67 ‐27.4% 21.00 ‐28.6% Burglary ‐ All Other 0 0 0 /0 6 5 1 20.0% 10 ‐4 ‐40.0% 16 10 60.0% 10.67 50.0% 11.40 40.4% Larceny ‐ Vehicle Burglary 2 9 ‐7 ‐77.8% 35 50 ‐15 ‐30.0% 30 5 16.7% 65 91 ‐28.6% 102 ‐36.1% 91.60 ‐29.0% Larceny ‐ All Other 7 10 ‐3 ‐30.0% 24 37 ‐13 ‐35.1% 23 1 4.3% 47 72 ‐34.7% 74.00 ‐36.5% 65.60 ‐28.4% Motor Vehicle Theft 0 5 ‐5 ‐100.0% 9 18 ‐9 ‐50.0% 15 ‐6 ‐40.0% 25 28 ‐10.7% 29.67 ‐15.7% 27.40 ‐8.8% TOTAL 11 29 ‐18 ‐62.1% 89 135 ‐46 ‐34.1% 91 ‐2 ‐2.2% 181 236 ‐23.3% 255 ‐29.1% 234 ‐22.5% Jan 29‐Feb 05‐Feb 12 Feb 19‐Feb 2012 2013 2014 2015 2016 2017 2018 Homicide 0 0 0 0 0 0 0 0 0 0 0 Sex Assault 0 1 1 0 1 2 3 3 4 4 2 Robbery ‐ Business 0 0 0 0 0 0 2 1 2 3 1 Robbery ‐ All Other 1 0 1 1 0 4 5 4 4 1 4 Aggravated Assault ‐ Family 0 0 1 1 2 2 1 3 1 3 2 Aggravated Assault ‐ All Other 0 2 0 0 5 4 4 5 10 8 4 Burglary ‐ Residential 4 2 0 0 17 22 21 27 19 16 15 Burglary ‐ All Other 4 0 2 0 9 14 11 7 15 10 16 Larceny ‐ Vehicle Burglary 15 12 6 2 51 71 82 108 106 91 65 Larceny ‐ All Other 6 7 4 7 31 54 52 69 81 72 47 Vehicle Theft 4 2 3 0 17 22 26 32 29 28 25 TOTALS 34 26 18 11 133 195 207 259 271 236 181 Year‐to‐Date Totals (Jan 1 through Feb 26) Note: Charts may erroneously show an apparent drop in the most current data due to some cases not yet having been reported and/or recorded. The figures included in this report are preliminary figures for general situational awareness and trend purposes only. They do not represent the official figures of the Salt Lake City Police Department and are subject to further analysis and revision. Due to the statute‐driven, changing nature of crime classification and area boundaries over time, be advised that the figures contained may not fully coincide with SLCPD statistical sources. Differences are reflective of the departmental procedures or policies that were in place at the time the events occurred and the date the data was compiled. In addition, data may be approximate in relation to indicated areas. Additionally, they are not Uniform Crime Reporting (UCR) or "crime rate" numbers and are not intended to be used as such. Rather, they are a breakdown of every offense within every case that occurred during the given time periods. Although every reasonable effort is made to verify their accuracy, the accuracy of any data is subject to the constraints of the report generation process as well as the manner, format, and point in time of any query. CompStat Report……. Council District 3 ‐ Breakdown of All Offenses *The above CompStat figures were generated on Tuesday, 2 day(s) after the closing date, which is indicated in the title. The figures are current as of the date generated. Last 7 Days* Last 28 Days* Previous 28 Days* (Prior to Last 28 Days) Year to Date (YTD)* 3‐Year YTD Average* 5‐Year YTD Average* Volume 4 ‐‐ Number 8 **Averages greater than or equal to 100 are rounded to a whole digit to maintain a consistent column size. Report Covering the Week 02/19/2018 Through 02/25/2018 (Mon‐Sun) 0 1 2 3 4 5 Jan 29‐Feb 04 Feb 05‐Feb 11 Feb 12‐Feb 18 Feb 19‐Feb 25 Last 28 Day Breakdown by Week ‐ #1 Homicide Sex Assault Robbery‐Bus. Robbery‐Other Agg Aslt‐Family Agg Aslt‐NonFam Burg‐Res Burg‐All Other 133 195 207 259 271 236 181 0 50 100 150 200 250 300 2012 2013 2014 2015 2016 2017 2018 Year‐to‐Date Totals (Jan 1 through Feb 26) Homicide Sex Assault Robbery‐Bus. Robbery‐Other Agg Aslt‐Family Agg Aslt‐NonFam Burg‐Res Burg‐All Other Larc‐Veh Burg Larc‐All Other Vehicle Theft0 2 4 6 8 10 12 14 16 Jan 29‐Feb 04 Feb 05‐Feb 11 Feb 12‐Feb 18 Feb 19‐Feb 25 Last 28 Day Breakdown by Week ‐ #2 Vehicle Burglary Other Larceny Vehicle Theft Page 5 of 9
- 6. Salt Lake City Police Department 2018 2017 Chg % Chg 2018 2017 Chg % Chg 2018 Recent Chg Recent % Chg 2018 2017 % Chg Avg** % Chg Avg** % Chg Criminal Homicide 0 0 0 /0 0 0 0 /0 0 0 /0 0 0 /0 0.00 /0 0.00 /0 Sexual Assault 2 2 0 0.0% 7 10 ‐3 ‐30.0% 7 0 0.0% 15 15 0.0% 10.67 40.6% 9.20 63.0% Robbery ‐ Business 0 0 0 /0 3 6 ‐3 ‐50.0% 6 ‐3 ‐50.0% 9 16 ‐43.8% 12.00 ‐25.0% 9.60 ‐6.2% Robbery ‐ All Other 2 2 0 0.0% 7 14 ‐7 ‐50.0% 11 ‐4 ‐36.4% 18 25 ‐28.0% 19.67 ‐8.5% 19.60 ‐8.2% Agg. Assault ‐ Family 3 1 2 200.0% 4 2 2 100.0% 2 2 100.0% 6 3 100.0% 3.67 63.6% 5.20 15.4% Agg. Assault ‐ NonFamily 1 3 ‐2 ‐66.7% 14 13 1 7.7% 13 1 7.7% 27 28 ‐3.6% 26.67 1.2% 25.60 5.5% Burglary ‐ Residential 2 1 1 100.0% 8 18 ‐10 ‐55.6% 7 1 14.3% 15 32 ‐53.1% 27.00 ‐44.4% 24.20 ‐38.0% Burglary ‐ All Other 1 6 ‐5 ‐83.3% 19 19 0 0.0% 19 0 0.0% 38 34 11.8% 37.33 1.8% 31.60 20.3% Larceny ‐ Vehicle Burglary 5 26 ‐21 ‐80.8% 57 107 ‐50 ‐46.7% 70 ‐13 ‐18.6% 128 209 ‐38.8% 208 ‐38.4% 185 ‐31.0% Larceny ‐ All Other 27 62 ‐35 ‐56.5% 127 248 ‐121 ‐48.8% 132 ‐5 ‐3.8% 262 454 ‐42.3% 395 ‐33.7% 382 ‐31.3% Motor Vehicle Theft 7 7 0 0.0% 33 42 ‐9 ‐21.4% 25 8 32.0% 59 65 ‐9.2% 66.67 ‐11.5% 61.40 ‐3.9% TOTAL 50 110 ‐60 ‐54.6% 279 479 ‐200 ‐41.8% 292 ‐13 ‐4.5% 577 881 ‐34.5% 806 ‐28.4% 753 ‐23.4% Jan 29‐Feb 05‐Feb 12 Feb 19‐Feb 2012 2013 2014 2015 2016 2017 2018 Homicide 0 0 0 0 0 0 0 0 0 0 0 Sex Assault 3 1 1 2 9 6 8 5 12 15 15 Robbery ‐ Business 1 1 1 0 4 6 6 13 7 16 9 Robbery ‐ All Other 2 1 2 2 16 18 21 16 18 25 18 Aggravated Assault ‐ Family 1 0 0 3 1 9 6 4 4 3 6 Aggravated Assault ‐ All Other 2 6 5 1 16 22 26 23 29 28 27 Burglary ‐ Residential 5 1 0 2 13 20 20 28 21 32 15 Burglary ‐ All Other 4 8 6 1 15 30 16 49 29 34 38 Larceny ‐ Vehicle Burglary 23 19 10 5 224 139 165 238 176 209 128 Larceny ‐ All Other 34 33 33 27 229 328 395 398 333 454 262 Vehicle Theft 11 8 7 7 33 57 50 74 61 65 59 TOTALS 86 78 65 50 560 635 713 848 690 881 577 Year‐to‐Date Totals (Jan 1 through Feb 26) Note: Charts may erroneously show an apparent drop in the most current data due to some cases not yet having been reported and/or recorded. The figures included in this report are preliminary figures for general situational awareness and trend purposes only. They do not represent the official figures of the Salt Lake City Police Department and are subject to further analysis and revision. Due to the statute‐driven, changing nature of crime classification and area boundaries over time, be advised that the figures contained may not fully coincide with SLCPD statistical sources. Differences are reflective of the departmental procedures or policies that were in place at the time the events occurred and the date the data was compiled. In addition, data may be approximate in relation to indicated areas. Additionally, they are not Uniform Crime Reporting (UCR) or "crime rate" numbers and are not intended to be used as such. Rather, they are a breakdown of every offense within every case that occurred during the given time periods. Although every reasonable effort is made to verify their accuracy, the accuracy of any data is subject to the constraints of the report generation process as well as the manner, format, and point in time of any query. CompStat Report……. Council District 4 ‐ Breakdown of All Offenses *The above CompStat figures were generated on Tuesday, 2 day(s) after the closing date, which is indicated in the title. The figures are current as of the date generated. Last 7 Days* Last 28 Days* Previous 28 Days* (Prior to Last 28 Days) Year to Date (YTD)* 3‐Year YTD Average* 5‐Year YTD Average* Volume 4 ‐‐ Number 8 **Averages greater than or equal to 100 are rounded to a whole digit to maintain a consistent column size. Report Covering the Week 02/19/2018 Through 02/25/2018 (Mon‐Sun) 0 1 2 3 4 5 6 7 8 9 Jan 29‐Feb 04 Feb 05‐Feb 11Feb 12‐Feb 18Feb 19‐Feb 25 Last 28 Day Breakdown by Week ‐ #1 Homicide Sex Assault Robbery‐Bus. Robbery‐Other Agg Aslt‐Family Agg Aslt‐NonFam Burg‐Res Burg‐All Other 560 635 713 848 690 881 577 0 100 200 300 400 500 600 700 800 900 1000 2012 2013 2014 2015 2016 2017 2018 Year‐to‐Date Totals (Jan 1 through Feb 26) Homicide Sex Assault Robbery‐Bus. Robbery‐Other Agg Aslt‐Family Agg Aslt‐NonFam Burg‐Res Burg‐All Other Larc‐Veh Burg Larc‐All Other Vehicle Theft0 5 10 15 20 25 30 35 40 Jan 29‐Feb 04 Feb 05‐Feb 11 Feb 12‐Feb 18 Feb 19‐Feb 25 Last 28 Day Breakdown by Week ‐ #2 Vehicle Burglary Other Larceny Vehicle Theft Page 6 of 9
- 7. Salt Lake City Police Department 2018 2017 Chg % Chg 2018 2017 Chg % Chg 2018 Recent Chg Recent % Chg 2018 2017 % Chg Avg** % Chg Avg** % Chg Criminal Homicide 0 0 0 /0 0 1 ‐1 ‐100.0% 0 0 /0 0 1 ‐100.0% 0.33 ‐100.0% 0.60 ‐100.0% Sexual Assault 0 0 0 /0 1 0 1 /0 4 ‐3 ‐75.0% 5 2 150.0% 4.00 25.0% 3.20 56.3% Robbery ‐ Business 0 0 0 /0 1 4 ‐3 ‐75.0% 4 ‐3 ‐75.0% 5 6 ‐16.7% 7.00 ‐28.6% 6.80 ‐26.5% Robbery ‐ All Other 0 2 ‐2 ‐100.0% 2 5 ‐3 ‐60.0% 4 ‐2 ‐50.0% 6 5 20.0% 5.67 5.9% 6.00 0.0% Agg. Assault ‐ Family 0 0 0 /0 1 0 1 /0 3 ‐2 ‐66.7% 4 1 300.0% 2.67 50.0% 4.20 ‐4.8% Agg. Assault ‐ NonFamily 1 1 0 0.0% 5 8 ‐3 ‐37.5% 8 ‐3 ‐37.5% 13 11 18.2% 11.00 18.2% 12.20 6.6% Burglary ‐ Residential 1 1 0 0.0% 12 6 6 100.0% 9 3 33.3% 22 14 57.1% 31.67 ‐30.5% 31.80 ‐30.8% Burglary ‐ All Other 2 3 ‐1 ‐33.3% 12 16 ‐4 ‐25.0% 15 ‐3 ‐20.0% 27 30 ‐10.0% 27.00 0.0% 23.40 15.4% Larceny ‐ Vehicle Burglary 6 11 ‐5 ‐45.5% 47 46 1 2.2% 46 1 2.2% 93 123 ‐24.4% 120 ‐22.7% 114 ‐18.3% Larceny ‐ All Other 13 46 ‐33 ‐71.7% 104 142 ‐38 ‐26.8% 154 ‐50 ‐32.5% 261 297 ‐12.1% 337 ‐22.5% 291 ‐10.2% Motor Vehicle Theft 1 7 ‐6 ‐85.7% 8 41 ‐33 ‐80.5% 23 ‐15 ‐65.2% 31 74 ‐58.1% 63.00 ‐50.8% 56.60 ‐45.2% TOTAL 24 71 ‐47 ‐66.2% 193 269 ‐76 ‐28.3% 270 ‐77 ‐28.5% 467 564 ‐17.2% 609 ‐23.4% 549 ‐15.0% Jan 29‐Feb 05‐Feb 12 Feb 19‐Feb 2012 2013 2014 2015 2016 2017 2018 Homicide 0 0 0 0 0 2 0 0 0 1 0 Sex Assault 0 1 0 0 3 1 3 2 8 2 5 Robbery ‐ Business 1 0 0 0 2 11 2 5 10 6 5 Robbery ‐ All Other 2 0 0 0 4 7 6 4 8 5 6 Aggravated Assault ‐ Family 0 0 1 0 3 2 11 4 3 1 4 Aggravated Assault ‐ All Other 0 3 1 1 8 13 15 11 11 11 13 Burglary ‐ Residential 3 3 5 1 20 28 36 44 37 14 22 Burglary ‐ All Other 5 5 0 2 8 25 11 34 17 30 27 Larceny ‐ Vehicle Burglary 13 17 11 6 55 91 117 125 113 123 93 Larceny ‐ All Other 43 27 21 13 182 209 235 327 386 297 261 Vehicle Theft 6 0 1 1 20 37 57 61 54 74 31 TOTALS 73 56 40 24 305 426 493 617 647 564 467 Year‐to‐Date Totals (Jan 1 through Feb 26) Note: Charts may erroneously show an apparent drop in the most current data due to some cases not yet having been reported and/or recorded. The figures included in this report are preliminary figures for general situational awareness and trend purposes only. They do not represent the official figures of the Salt Lake City Police Department and are subject to further analysis and revision. Due to the statute‐driven, changing nature of crime classification and area boundaries over time, be advised that the figures contained may not fully coincide with SLCPD statistical sources. Differences are reflective of the departmental procedures or policies that were in place at the time the events occurred and the date the data was compiled. In addition, data may be approximate in relation to indicated areas. Additionally, they are not Uniform Crime Reporting (UCR) or "crime rate" numbers and are not intended to be used as such. Rather, they are a breakdown of every offense within every case that occurred during the given time periods. Although every reasonable effort is made to verify their accuracy, the accuracy of any data is subject to the constraints of the report generation process as well as the manner, format, and point in time of any query. CompStat Report……. Council District 5 ‐ Breakdown of All Offenses *The above CompStat figures were generated on Tuesday, 2 day(s) after the closing date, which is indicated in the title. The figures are current as of the date generated. Last 7 Days* Last 28 Days* Previous 28 Days* (Prior to Last 28 Days) Year to Date (YTD)* 3‐Year YTD Average* 5‐Year YTD Average* Volume 4 ‐‐ Number 8 **Averages greater than or equal to 100 are rounded to a whole digit to maintain a consistent column size. Report Covering the Week 02/19/2018 Through 02/25/2018 (Mon‐Sun) 0 1 2 3 4 5 6 Jan 29‐Feb 04 Feb 05‐Feb 11 Feb 12‐Feb 18 Feb 19‐Feb 25 Last 28 Day Breakdown by Week ‐ #1 Homicide Sex Assault Robbery‐Bus. Robbery‐Other Agg Aslt‐Family Agg Aslt‐NonFam Burg‐Res Burg‐All Other 305 426 493 617 647 564 467 0 100 200 300 400 500 600 700 2012 2013 2014 2015 2016 2017 2018 Year‐to‐Date Totals (Jan 1 through Feb 26) Homicide Sex Assault Robbery‐Bus. Robbery‐Other Agg Aslt‐Family Agg Aslt‐NonFam Burg‐Res Burg‐All Other Larc‐Veh Burg Larc‐All Other Vehicle Theft0 5 10 15 20 25 30 35 40 45 50 Jan 29‐Feb 04 Feb 05‐Feb 11 Feb 12‐Feb 18 Feb 19‐Feb 25 Last 28 Day Breakdown by Week ‐ #2 Vehicle Burglary Other Larceny Vehicle Theft Page 7 of 9
- 8. Salt Lake City Police Department 2018 2017 Chg % Chg 2018 2017 Chg % Chg 2018 Recent Chg Recent % Chg 2018 2017 % Chg Avg** % Chg Avg** % Chg Criminal Homicide 0 0 0 /0 0 0 0 /0 0 0 /0 0 0 /0 0.00 /0 0.00 /0 Sexual Assault 0 0 0 /0 1 0 1 /0 1 0 0.0% 2 0 /0 0.33 500.0% 0.60 233.3% Robbery ‐ Business 0 1 ‐1 ‐100.0% 0 1 ‐1 ‐100.0% 1 ‐1 ‐100.0% 1 2 ‐50.0% 1.00 0.0% 1.60 ‐37.5% Robbery ‐ All Other 0 0 0 /0 1 0 1 /0 0 1 /0 1 0 /0 0.33 200.0% 0.20 400.0% Agg. Assault ‐ Family 0 0 0 /0 1 1 0 0.0% 0 1 /0 1 1 0.0% 0.67 50.0% 0.60 66.7% Agg. Assault ‐ NonFamily 0 0 0 /0 0 0 0 /0 0 0 /0 0 1 ‐100.0% 1.33 ‐100.0% 0.80 ‐100.0% Burglary ‐ Residential 0 4 ‐4 ‐100.0% 3 7 ‐4 ‐57.1% 5 ‐2 ‐40.0% 8 15 ‐46.7% 13.33 ‐40.0% 13.80 ‐42.0% Burglary ‐ All Other 0 0 0 /0 0 2 ‐2 ‐100.0% 2 ‐2 ‐100.0% 2 4 ‐50.0% 3.67 ‐45.5% 5.20 ‐61.5% Larceny ‐ Vehicle Burglary 1 6 ‐5 ‐83.3% 10 24 ‐14 ‐58.3% 22 ‐12 ‐54.5% 32 38 ‐15.8% 44.00 ‐27.3% 45.60 ‐29.8% Larceny ‐ All Other 0 3 ‐3 ‐100.0% 9 22 ‐13 ‐59.1% 15 ‐6 ‐40.0% 24 34 ‐29.4% 28.33 ‐15.3% 26.00 ‐7.7% Motor Vehicle Theft 0 0 0 /0 2 7 ‐5 ‐71.4% 7 ‐5 ‐71.4% 9 10 ‐10.0% 11.67 ‐22.9% 12.60 ‐28.6% TOTAL 1 14 ‐13 ‐92.9% 27 64 ‐37 ‐57.8% 53 ‐26 ‐49.1% 80 105 ‐23.8% 105 ‐23.6% 107 ‐25.2% Jan 29‐Feb 05‐Feb 12 Feb 19‐Feb 2012 2013 2014 2015 2016 2017 2018 Homicide 0 0 0 0 0 0 0 0 0 0 0 Sex Assault 1 0 0 0 1 0 2 0 1 0 2 Robbery ‐ Business 0 0 0 0 1 1 4 0 1 2 1 Robbery ‐ All Other 1 0 0 0 0 0 0 1 0 0 1 Aggravated Assault ‐ Family 1 0 0 0 0 0 1 0 1 1 1 Aggravated Assault ‐ All Other 0 0 0 0 2 0 0 2 1 1 0 Burglary ‐ Residential 2 1 0 0 9 13 16 14 11 15 8 Burglary ‐ All Other 0 0 0 0 2 8 7 4 3 4 2 Larceny ‐ Vehicle Burglary 7 1 1 1 28 54 42 50 44 38 32 Larceny ‐ All Other 0 5 4 0 20 18 27 31 20 34 24 Vehicle Theft 1 1 0 0 7 12 16 12 13 10 9 TOTALS 13 8 5 1 70 106 115 114 95 105 80 Year‐to‐Date Totals (Jan 1 through Feb 26) Note: Charts may erroneously show an apparent drop in the most current data due to some cases not yet having been reported and/or recorded. The figures included in this report are preliminary figures for general situational awareness and trend purposes only. They do not represent the official figures of the Salt Lake City Police Department and are subject to further analysis and revision. Due to the statute‐driven, changing nature of crime classification and area boundaries over time, be advised that the figures contained may not fully coincide with SLCPD statistical sources. Differences are reflective of the departmental procedures or policies that were in place at the time the events occurred and the date the data was compiled. In addition, data may be approximate in relation to indicated areas. Additionally, they are not Uniform Crime Reporting (UCR) or "crime rate" numbers and are not intended to be used as such. Rather, they are a breakdown of every offense within every case that occurred during the given time periods. Although every reasonable effort is made to verify their accuracy, the accuracy of any data is subject to the constraints of the report generation process as well as the manner, format, and point in time of any query. CompStat Report……. Council District 6 ‐ Breakdown of All Offenses *The above CompStat figures were generated on Tuesday, 2 day(s) after the closing date, which is indicated in the title. The figures are current as of the date generated. Last 7 Days* Last 28 Days* Previous 28 Days* (Prior to Last 28 Days) Year to Date (YTD)* 3‐Year YTD Average* 5‐Year YTD Average* Volume 4 ‐‐ Number 8 **Averages greater than or equal to 100 are rounded to a whole digit to maintain a consistent column size. Report Covering the Week 02/19/2018 Through 02/25/2018 (Mon‐Sun) 0 1 2 3 Jan 29‐Feb 04 Feb 05‐Feb 11 Feb 12‐Feb 18 Feb 19‐Feb 25 Last 28 Day Breakdown by Week ‐ #1 Homicide Sex Assault Robbery‐Bus. Robbery‐Other Agg Aslt‐Family Agg Aslt‐NonFam Burg‐Res Burg‐All Other 70 106 115 114 95 105 80 0 20 40 60 80 100 120 140 2012 2013 2014 2015 2016 2017 2018 Year‐to‐Date Totals (Jan 1 through Feb 26) Homicide Sex Assault Robbery‐Bus. Robbery‐Other Agg Aslt‐Family Agg Aslt‐NonFam Burg‐Res Burg‐All Other Larc‐Veh Burg Larc‐All Other Vehicle Theft0 1 2 3 4 5 6 7 8 Jan 29‐Feb 04 Feb 05‐Feb 11 Feb 12‐Feb 18 Feb 19‐Feb 25 Last 28 Day Breakdown by Week ‐ #2 Vehicle Burglary Other Larceny Vehicle Theft Page 8 of 9
- 9. Salt Lake City Police Department 2018 2017 Chg % Chg 2018 2017 Chg % Chg 2018 Recent Chg Recent % Chg 2018 2017 % Chg Avg** % Chg Avg** % Chg Criminal Homicide 0 0 0 /0 0 0 0 /0 1 ‐1 ‐100.0% 1 0 /0 0.33 200.0% 0.20 400.0% Sexual Assault 0 0 0 /0 1 4 ‐3 ‐75.0% 2 ‐1 ‐50.0% 3 5 ‐40.0% 3.67 ‐18.2% 3.00 0.0% Robbery ‐ Business 0 0 0 /0 1 0 1 /0 2 ‐1 ‐50.0% 3 1 200.0% 6.67 ‐55.0% 5.80 ‐48.3% Robbery ‐ All Other 0 0 0 /0 0 1 ‐1 ‐100.0% 0 0 /0 0 2 ‐100.0% 3.00 ‐100.0% 2.40 ‐100.0% Agg. Assault ‐ Family 0 0 0 /0 0 0 0 /0 0 0 /0 0 0 /0 2.00 ‐100.0% 2.20 ‐100.0% Agg. Assault ‐ NonFamily 0 1 ‐1 ‐100.0% 2 1 1 100.0% 1 1 100.0% 3 1 200.0% 3.67 ‐18.2% 4.00 ‐25.0% Burglary ‐ Residential 1 2 ‐1 ‐50.0% 7 10 ‐3 ‐30.0% 12 ‐5 ‐41.7% 19 16 18.8% 19.67 ‐3.4% 19.20 ‐1.0% Burglary ‐ All Other 1 4 ‐3 ‐75.0% 3 8 ‐5 ‐62.5% 14 ‐11 ‐78.6% 19 17 11.8% 11.67 62.9% 13.00 46.2% Larceny ‐ Vehicle Burglary 5 3 2 66.7% 19 32 ‐13 ‐40.6% 50 ‐31 ‐62.0% 69 91 ‐24.2% 99.00 ‐30.3% 95.60 ‐27.8% Larceny ‐ All Other 7 15 ‐8 ‐53.3% 43 76 ‐33 ‐43.4% 69 ‐26 ‐37.7% 112 171 ‐34.5% 161 ‐30.3% 150 ‐25.3% Motor Vehicle Theft 0 2 ‐2 ‐100.0% 9 18 ‐9 ‐50.0% 19 ‐10 ‐52.6% 30 34 ‐11.8% 33.67 ‐10.9% 31.20 ‐3.8% TOTAL 14 27 ‐13 ‐48.2% 85 150 ‐65 ‐43.3% 170 ‐85 ‐50.0% 259 338 ‐23.4% 344 ‐24.7% 327 ‐20.7% Jan 29‐Feb 05‐Feb 12 Feb 19‐Feb 2012 2013 2014 2015 2016 2017 2018 Homicide 0 0 0 0 0 0 0 1 0 0 1 Sex Assault 0 1 0 0 3 3 1 3 3 5 3 Robbery ‐ Business 1 0 0 0 2 6 3 8 11 1 3 Robbery ‐ All Other 0 0 0 0 3 2 1 4 3 2 0 Aggravated Assault ‐ Family 0 0 0 0 1 4 1 4 2 0 0 Aggravated Assault ‐ All Other 0 1 1 0 5 4 5 6 4 1 3 Burglary ‐ Residential 2 2 2 1 24 21 16 19 24 16 19 Burglary ‐ All Other 2 0 0 1 12 13 17 4 14 17 19 Larceny ‐ Vehicle Burglary 5 2 7 5 61 76 105 101 105 91 69 Larceny ‐ All Other 12 12 12 7 116 121 147 158 153 171 112 Vehicle Theft 3 4 2 0 18 18 37 37 30 34 30 TOTALS 25 22 24 14 245 268 333 345 349 338 259 Year‐to‐Date Totals (Jan 1 through Feb 26) Note: Charts may erroneously show an apparent drop in the most current data due to some cases not yet having been reported and/or recorded. The figures included in this report are preliminary figures for general situational awareness and trend purposes only. They do not represent the official figures of the Salt Lake City Police Department and are subject to further analysis and revision. Due to the statute‐driven, changing nature of crime classification and area boundaries over time, be advised that the figures contained may not fully coincide with SLCPD statistical sources. Differences are reflective of the departmental procedures or policies that were in place at the time the events occurred and the date the data was compiled. In addition, data may be approximate in relation to indicated areas. Additionally, they are not Uniform Crime Reporting (UCR) or "crime rate" numbers and are not intended to be used as such. Rather, they are a breakdown of every offense within every case that occurred during the given time periods. Although every reasonable effort is made to verify their accuracy, the accuracy of any data is subject to the constraints of the report generation process as well as the manner, format, and point in time of any query. *The above CompStat figures were generated on Tuesday, 2 day(s) after the closing date, which is indicated in the title. The figures are current as of the date generated. CompStat Report……. Council District 7 ‐ Breakdown of All Offenses Volume 4 ‐‐ Number 8 Last 7 Days* Last 28 Days* Previous 28 Days* (Prior to Last 28 Days) Year to Date (YTD)* 3‐Year YTD Average* 5‐Year YTD Average* **Averages greater than or equal to 100 are rounded to a whole digit to maintain a consistent column size. Report Covering the Week 02/19/2018 Through 02/25/2018 (Mon‐Sun) 0 1 2 3 Jan 29‐Feb 04 Feb 05‐Feb 11 Feb 12‐Feb 18 Feb 19‐Feb 25 Last 28 Day Breakdown by Week ‐ #1 Homicide Sex Assault Robbery‐Bus. Robbery‐Other Agg Aslt‐Family Agg Aslt‐NonFam Burg‐Res Burg‐All Other 245 268 333 345 349 338 259 0 50 100 150 200 250 300 350 400 2012 2013 2014 2015 2016 2017 2018 Year‐to‐Date Totals (Jan 1 through Feb 26) Homicide Sex Assault Robbery‐Bus. Robbery‐Other Agg Aslt‐Family Agg Aslt‐NonFam Burg‐Res Burg‐All Other Larc‐Veh Burg Larc‐All Other Vehicle Theft0 2 4 6 8 10 12 14 Jan 29‐Feb 04 Feb 05‐Feb 11 Feb 12‐Feb 18 Feb 19‐Feb 25 Last 28 Day Breakdown by Week ‐ #2 Vehicle Burglary Other Larceny Vehicle Theft Page 9 of 9