
Recommended
More Related Content
What's hot
What's hot (16)
Similar to Ticket trends 2012 2017
Similar to Ticket trends 2012 2017 (16)
Recently uploaded
Recently uploaded (20)
Ticket trends 2012 2017
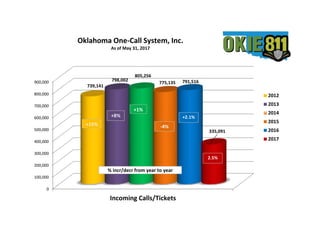
- 1. +6% +12% +15% % Increase from year to year 0 100,000 200,000 300,000 400,000 500,000 600,000 700,000 800,000 900,000 Incoming Calls/Tickets 739,141 798,002 805,256 775,135 791,516 335,091 2012 2013 2014 2015 2016 2017 Oklahoma One-Call System, Inc. As of May 31, 2017 +8% +15% % incr/decr from year to year +2.1% -4% +1% 2.5%
- 2. +3% +9% +11% % Increase from year to year Jan Feb Mar Apr May Jun Jul Aug Sep Oct Nov Dec 2012 55,179 52,971 61,898 65,211 68,070 64,179 66,025 70,000 58,363 68,712 58,767 49,766 2013 64,413 53,186 64,884 68,568 70,258 68,256 73,336 73,420 68,747 74,779 60,431 57,724 2014 70,357 61,827 70,473 74,912 71,683 70,272 70,787 68,814 67,550 69,954 51,509 57,118 2015 60,678 54,874 66,114 67,823 60,269 74,427 71,440 67,537 68,414 68,395 58,064 57,100 2016 59,093 64,502 72,594 64,621 66,243 71,587 65,856 75,276 67,381 67,024 60,754 56,585 2017 61,281 60,354 74,136 64,594 74,726 30,000 35,000 40,000 45,000 50,000 55,000 60,000 65,000 70,000 75,000 80,000 85,000 Oklahoma One-Call System, Inc. Incoming Tickets - Trend by Month
- 3. +3% +10% +21% % Increase from year to year 0 1,000,000 2,000,000 3,000,000 4,000,000 5,000,000 6,000,000 7,000,000 Outgoing Transmissions/Tickets 5,290,954 5,980,963 6,141,957 5,757,571 5,877,298 2,108,586 2012 2013 2014 2015 2016 2017 +21% % incr/decr from year to year Oklahoma One-Call System, Inc. As of May 31, 2017 +13% +3% NOTE: 2017 - changed from # of Transmissions to # of Tickets - 6% +2% -13%
- 4. +3% +9% +11% % Increase from year to year Jan Feb Mar Apr May Jun Jul Aug Sep Oct Nov Dec 2012 377,911 348,996 427,797 453,940 479,845 459,767 473,379 513,761 426,592 500,131 446,085 382,750 2013 486,885 401,485 491,412 513,818 524,187 505,871 548,502 545,447 509,699 558,850 450,665 444,142 2014 522,143 464,832 532,306 568,304 536,016 522,006 529,865 543,172 539,787 555,811 392,575 435,140 2015 457,509 407,684 492,287 497,258 449,965 550,538 528,720 490,637 503,723 510,416 436,207 432,627 2016 444,010 479,315 536,320 476,884 492,833 530,707 490,076 559,649 500,392 495,154 453,190 418,768 2017 385,869 380,497 466,355 405,450 470,415 200,000 250,000 300,000 350,000 400,000 450,000 500,000 550,000 600,000 650,000 Oklahoma One-Call System, Inc. Outgoing Tickets/Transmissions - Trend by Month (2017 changed from notifications to tickets)
- 5. 63.58% 28.52% 4.20% 0.60% 1.43% 0.10% 0.13% 1.43% 0% 5% 10% 15% 20% 25% 30% 35% 40% 45% 50% 55% 60% 65% 70% Normal Update Emergency Non-Compliant 2nd Notice 3rd Notice Demolition Others (NoChrg) % OF INCOMING LOCATE REQUESTS BY TICKET TYPE YTD through May 2017
- 6. 0 100,000 200,000 300,000 400,000 500,000 600,000 2012 2013 2014 2015 2016 2017 Oklahoma One-Call System, Inc. Incoming Locate Requests by Company Type As-of May 31, 2017 Contractor Government Occupants Utility Other 4% 8% 13% 5% 70%
- 7. 0 5,000 10,000 15,000 20,000 25,000 30,000 35,000 40,000 45,000 2016 Incoming Tickets by Work Type As-of May 31, 2017
- 8. -1% -1% -1% 10% 20% -5% 17% -6% 15% -3% -20% 38% 6% 32% 10% -37% -35% 44% 1% -30% 6% -14% 4% 3% -50% -40% -30% -20% -10% 0% 10% 20% 30% 40% 50% Electric Gas Water/FireHydnt Telephone Cable/SatelliteTV Fence/Gate Pipeline Bridges/Roads/GuardRail Septic/Sewer Landscaping/Planting/DirtWork NewSrvc-Water/Sewer/Gas FiberOpticLine Pole(s)/Signs/Signals Foundtn/Paving/Drivwy/Sidewlk NewConstruction Drainage/FrenchDrain/Conduit StormShelter OilField Sprinklers/Irrigation Ditchwork/Culvert SoilTestBoring ConcreteRemoval/Demolition Pond/Pools/Waterways Others Incoming Tickets by Work Type Difference from YTD 2016 to YTD 2017 thru MAY
- 9. 0.0% 10.0% 20.0% 30.0% 40.0% 50.0% 60.0% 70.0% 2012 2013 2014 2015 2016 2017 2.1% 1.4% 0.8% 1.0% 0.4% 11.7% 43.5% 41.3% 39.6% 37.6% 37.5% 38.3% 54.4% 57.3% 59.5% 61.4% 62.1% 50.0% % Fax/Portal Tickets % Call Tickets % Web Tickets Oklahoma One-Call System, Inc. Trends by Ticket Source As of May 31, 2017 NOTE: Portal Update Tickets Started Mar 2017
- 10. 7.16 7.49 7.63 7.43 7.43 6.29 0.00 1.00 2.00 3.00 4.00 5.00 6.00 7.00 8.00 9.00 2012 2013 2014 2015 2016 2017 Avg Outgoing Tickets NOTE: 2017 - changed from # of Transmissions to # of Tickets
- 11. 1.2% -0.4% 15.3% -2.9% 1.5% 10.8% -15% -10% -5% 0% 5% 10% 15% 20% 25% SW-Great Plains S-Chickasaw SE-Kiamichi Central-Frontier NW-Red Carpet NE-Green Cntry Incoming Tickets by PEDPC Council Area % of Change In Ticket Volumes Comparing YTD May 2016 to May 2017
- 12. 140% 79% 146% 84% 51% 95% 0% 20% 40% 60% 80% 100% 120% 140% 160% ADAIR BLAINE CIMARRON MAJOR HASKELL PUSHMATAHA NE-Green Cntry NW-Red Carpet NW-Red Carpet NW-Red CarpetSE-KiamichiSE-Kiamichi Incoming Tickets by PEDPC Council Area Counties/Areas with Largest Increase Comparing YTD May 2016 to May 2017
- 13. -7% -10% -18% 6% -3% 11% 6% 15% 3% -24% 0% -1% -30% -20% -10% 0% 10% 20% 30% CANADIAN CLEVELAND GRADY HUGHES LINCOLN LOGAN MCCLAIN OKFUSKEE OKLAHOMA PAYNE POTTAWATOMIE SEMINOLE Central Oklahoma - Frontier % of Change In Ticket Volumes Comparing YTD May 2016 to May 2017
- 14. 140% 45% 29% -3% 30% 17% 13% 21% 1% 0% 16% 19% -17% 28% -16% 5% 29% -2% -30% -10% 10% 30% 50% 70% 90% 110% 130% 150% ADAIR CHEROKEE CRAIG CREEK DELAWARE MAYES MCINTOSH MUSKOGEE NOWATA OKMULGEE OSAGE OTTAWA PAWNEE ROGERS SEQUOYAH TULSA WAGONER WASHINGTON NE Oklahoma - Green Country % of Change In Ticket Volumes Comparing YTD May 2016 to May 2017
- 15. -14% 45% 1% -29% 14% 8% -39% 16% -2% -28% -32% -9% -21% 22% -50% -40% -30% -20% -10% 0% 10% 20% 30% 40% 50% 60% BECKHAM CADDO COMANCHE COTTON CUSTER GREER HARMON JACKSON JEFFERSON KIOWA ROGERMILLS STEPHENS TILLMAN WASHITA SW Oklahoma - Great Plains % of Change In Ticket Volumes Comparing YTD May 2016 to May 2017
- 16. 3% 12% 0% 7% 4% -33% -10% -40% -30% -20% -10% 0% 10% 20% 30% CARTER GARVIN JOHNSTON LOVE MARSHALL MURRAY PONTOTOC South Oklahoma - Chickasaw % of Change In Ticket Volumes Comparing YTD May 2016 to May 2017
- 17. -14% -31% 79% 146% -1% 10% -23% -43% 20% -4% 18% 84% -28% -27% -27% 22% -80% -30% 20% 70% 120% 170% ALFALFA BEAVER BLAINE CIMARRON DEWEY ELLIS GARFIELD GRANT HARPER KAY KINGFISHER MAJOR NOBLE TEXAS WOODS WOODWARD NW Oklahoma - Red Carpet % of Change In Ticket Volumes Comparing YTD May 2016 to May 2017
- 18. 1% 25% 7% 10% 51% -7% -9% 1% 28% 95% -20% 0% 20% 40% 60% 80% 100% ATOKA BRYAN CHOCTAW COAL HASKELL LATIMER LEFLORE MCCURTAIN PITTSBURG PUSHMATAHA SE Oklahoma - Kiamicha % of Change In Ticket Volumes Comparing YTD May 2016 to May 2017