SlideShare a Scribd company logo
1 of 4
Download to read offline
úú ú
ú
ú
ú
ú
ú
ú
ú
ú
úúúú
ú
úú
ú
ú
ú
ú
ú
ú
ú
ÛÚ
ÛÚ
ÛÚ
ÛÚ
ÛÚ
ÛÚ
ÛÚ
ÛÚ
ÛÚ
ÛÚ
ÛÚ
ÛÚ
ÛÚ
!( !(
!(
!(
!(
!(
!(
!(
!(
!(
!(
!(
©
©
©
XW
XWXW
#*
&=!
&=!
&=!
&=!
&=!
&=!
&=!
&=!
&=!
&=!
&=!
&=!
&=!
&=!
&=!
Town of
Albion
Town of Barre
Town of
Gaines
Town of
Ridgeway
Town of
Shelby
UV98
UV31A
UV31
Albion
0 0.5 10.25
Miles
www.edrdpc.com
µ
Notes: 1. Basemap: "USGS TNM Topo
Base Map" displayed via the USGS Topo
Map Service. 2. This map was generated
in ArcMap on February 12, 2020. 3. This is
a color graphic. Reproduction in grayscale
may misrepresent the data.
Heritage Wind
Project
Town of Barre, Orleans
County, New York
Figure 15-1: Public Health
and Safety
!
!!
!
!
!
!
!!
!
!
!
!
!
!
!
!
!
!
1:50,000
Sheet 1 of 4
XW Police Station
© Fire and EMS
ú Bridge
ÛÚ Regulated Dam
!( EPA Regulated Facility
&=!
Wind Turbine
#* Permanent Met Tower
Access Road
Collection Line
POI Substation
Collection Substation
O&M Facility
Laydown Yard
FEMA 100-Year Floodplain
Facility Site
!
!
!
! 5-mile Study Area
Town Boundary
County Boundary
HR
ú
ú
ú
ú
ú
ú
ú
ú
úú
úú
ú
ú
ú
ú
ú
ú
ú
úúú
úúúúúú
ú
ú
ú
ú
ú
ÛÚ
ÛÚ
ÛÚ
ÛÚ
ÛÚ
ÛÚ
ÛÚ
!( !(
!(
!(
!(
!(
!(
!(
!(
!(
!(
!(
©
©
©
©
XW
XWXW
XW
#*
#*
&=!
&=!
&=!
&=! &=!
&=!
&=!
&=!
&=!
&=!
&=!
&=!
&=!
&=!
&=!
&=!
&=!
&=!
Town of
Albion
Town of Barre
Town of
Clarendon
Town of
Gaines
Town of
Murray
UV237
UV279
UV104
UV31A
UV31
UV387
UV98
Albion
Holley
0 0.5 10.25
Miles
www.edrdpc.com
µ
Notes: 1. Basemap: "USGS TNM Topo
Base Map" displayed via the USGS Topo
Map Service. 2. This map was generated
in ArcMap on February 12, 2020. 3. This is
a color graphic. Reproduction in grayscale
may misrepresent the data.
Heritage Wind
Project
Town of Barre, Orleans
County, New York
Figure 15-1: Public Health
and Safety
!
!!
!
!
!
!
!!
!
!
!
!
!
!
!
!
!
!
1:50,000
Sheet 2 of 4
XW Police Station
© Fire and EMS
ú Bridge
ÛÚ Regulated Dam
!( EPA Regulated Facility
&=!
Wind Turbine
#* Permanent Met Tower
Access Road
Collection Line
Laydown Yard
FEMA 100-Year Floodplain
Facility Site
!
!
!
! 5-mile Study Area
Town Boundary
County Boundary
ill
ú ú
ú
ú
ú
ú
ú
ú
ú
ú
úú
ú
ú
ú
ú
ú
ÛÚ
ÛÚ
ÛÚ
ÛÚ
ÛÚ
ÛÚ
ÛÚ
ÛÚ
ÛÚ
ÛÚ
ÛÚ
ÛÚ
ÛÚ
ÛÚ
ÛÚ
ÛÚ
ÛÚ
ÛÚ
ÛÚ
!(
!(
!(
!(
!(
©
&=!
&=!
&=!
&=!
&=! &=!
&=!
&=!
&=!
&=!
&=!
&=!
&=!
&=!
Genesee County
Orleans County
Town of
Alabama
Town of Barre
Town of Elba
Town of
Oakfield
Town of
Shelby
UV262
UV63
UV98
Elba
Oakfield
0 0.5 10.25
Miles
www.edrdpc.com
µ
Notes: 1. Basemap: "USGS TNM Topo
Base Map" displayed via the USGS Topo
Map Service. 2. This map was generated
in ArcMap on February 12, 2020. 3. This is
a color graphic. Reproduction in grayscale
may misrepresent the data.
Heritage Wind
Project
Town of Barre, Orleans
County, New York
Figure 15-1: Public Health
and Safety
!
!!
!
!
!
!
!!
!
!
!
!
!
!
!
!
!
!
1:50,000
Sheet 3 of 4
© Fire and EMS
ú Bridge
ÛÚ Regulated Dam
!( NYSDEC Water Withdrawl
!( EPA Regulated Facility
&=!
Wind Turbine
Access Road
Collection Line
POI Substation
Collection Substation
O&M Facility
FEMA 100-Year Floodplain
Facility Site
!
!
!
! 5-mile Study Area
Town Boundary
County Boundary
ill
ú
ú
ú
ú
ú
ú
ú
ú
ú
ú
úú
ú
ú
ú
ú
ú
ú
ÛÚ
ÛÚ
ÛÚ
ÛÚ
ÛÚ
ÛÚ
ÛÚ
ÛÚ
ÛÚ
ÛÚ
ÛÚ
ÛÚ
!(© ©
&=!
&=!
&=!
&=!
&=!
&=!
&=!
&=!
&=!
&=!
&=!
&=!
&=!
&=!
&=!
&=!
&=!
Genesee County
Orleans County
Town of Barre
Town of Byron
Town of
Clarendon
Town of Elba
UV237
UV262
UV98
Elba
0 0.5 10.25
Miles
www.edrdpc.com
µ
Notes: 1. Basemap: "USGS TNM Topo
Base Map" displayed via the USGS Topo
Map Service. 2. This map was generated
in ArcMap on February 12, 2020. 3. This is
a color graphic. Reproduction in grayscale
may misrepresent the data.
Heritage Wind
Project
Town of Barre, Orleans
County, New York
Figure 15-1: Public Health
and Safety
!
!!
!
!
!
!
!!
!
!
!
!
!
!
!
!
!
!
1:50,000
Sheet 4 of 4
© Fire and EMS
ú Bridge
ÛÚ Regulated Dam
!( NYSDEC Water Withdrawl
&=!
Wind Turbine
Access Road
Collection Line
POI Substation
Collection Substation
O&M Facility
FEMA 100-Year Floodplain
Facility Site
!
!
!
! 5-mile Study Area
Town Boundary
County Boundary
ill

More Related Content

More from Heritage Wind

More from Heritage Wind (20)

Figure 3.1-1. Visual Study Area
Figure 3.1-1. Visual Study AreaFigure 3.1-1. Visual Study Area
Figure 3.1-1. Visual Study Area
 
Figure 4-2. Land Use Programs
Figure 4-2. Land Use ProgramsFigure 4-2. Land Use Programs
Figure 4-2. Land Use Programs
 
Figure 4-1. Existing Land Use
Figure 4-1. Existing Land UseFigure 4-1. Existing Land Use
Figure 4-1. Existing Land Use
 
Figure 3-3. Municipal Boundaries Temp Road Improvements
Figure 3-3. Municipal Boundaries Temp Road ImprovementsFigure 3-3. Municipal Boundaries Temp Road Improvements
Figure 3-3. Municipal Boundaries Temp Road Improvements
 
Figure 3-2. Interconnection Location
Figure 3-2. Interconnection LocationFigure 3-2. Interconnection Location
Figure 3-2. Interconnection Location
 
Figure 2-2. Facility Layout
Figure 2-2. Facility LayoutFigure 2-2. Facility Layout
Figure 2-2. Facility Layout
 
Figure 28-1. Potential Environmental Justice Areas
Figure 28-1. Potential Environmental Justice AreasFigure 28-1. Potential Environmental Justice Areas
Figure 28-1. Potential Environmental Justice Areas
 
Figure 23-2. Surface Waters
Figure 23-2. Surface WatersFigure 23-2. Surface Waters
Figure 23-2. Surface Waters
 
Figure 22-3. Delineated Wetlands and Surface Waters
Figure 22-3. Delineated Wetlands and Surface WatersFigure 22-3. Delineated Wetlands and Surface Waters
Figure 22-3. Delineated Wetlands and Surface Waters
 
Figure 22-2. Significant Natural Communities
Figure 22-2. Significant Natural CommunitiesFigure 22-2. Significant Natural Communities
Figure 22-2. Significant Natural Communities
 
Figure 21-3. Bedrock
Figure 21-3. BedrockFigure 21-3. Bedrock
Figure 21-3. Bedrock
 
Figure 21-2. Soil Types
Figure 21-2. Soil TypesFigure 21-2. Soil Types
Figure 21-2. Soil Types
 
Figure 21-1. Slope
Figure 21-1. SlopeFigure 21-1. Slope
Figure 21-1. Slope
 
Figure 19-1. Sensitive Receptor Locations
Figure 19-1. Sensitive Receptor LocationsFigure 19-1. Sensitive Receptor Locations
Figure 19-1. Sensitive Receptor Locations
 
Figure 13 1. Real Property Map
Figure 13 1. Real Property MapFigure 13 1. Real Property Map
Figure 13 1. Real Property Map
 
Figure 9 1. Facility Site Comparison Map
Figure 9 1. Facility Site Comparison MapFigure 9 1. Facility Site Comparison Map
Figure 9 1. Facility Site Comparison Map
 
Figure 4-8. Recreational Area and Other Sensitive Land Uses
Figure 4-8. Recreational Area and Other Sensitive Land UsesFigure 4-8. Recreational Area and Other Sensitive Land Uses
Figure 4-8. Recreational Area and Other Sensitive Land Uses
 
Figure 4-5. Zoning District
Figure 4-5. Zoning DistrictFigure 4-5. Zoning District
Figure 4-5. Zoning District
 
Figure 4-6. Proposed Land Use
Figure 4-6. Proposed Land UseFigure 4-6. Proposed Land Use
Figure 4-6. Proposed Land Use
 
Figure 4-4. Tax Parcel
Figure 4-4. Tax ParcelFigure 4-4. Tax Parcel
Figure 4-4. Tax Parcel
 

Recently uploaded

21P35A0312 Internship eccccccReport.docx
21P35A0312 Internship eccccccReport.docx21P35A0312 Internship eccccccReport.docx
21P35A0312 Internship eccccccReport.docx
rahulmanepalli02
 
Final DBMS Manual (2).pdf final lab manual
Final DBMS Manual (2).pdf final lab manualFinal DBMS Manual (2).pdf final lab manual
Final DBMS Manual (2).pdf final lab manual
BalamuruganV28
 
Artificial intelligence presentation2-171219131633.pdf
Artificial intelligence presentation2-171219131633.pdfArtificial intelligence presentation2-171219131633.pdf
Artificial intelligence presentation2-171219131633.pdf
Kira Dess
 

Recently uploaded (20)

Maximizing Incident Investigation Efficacy in Oil & Gas: Techniques and Tools
Maximizing Incident Investigation Efficacy in Oil & Gas: Techniques and ToolsMaximizing Incident Investigation Efficacy in Oil & Gas: Techniques and Tools
Maximizing Incident Investigation Efficacy in Oil & Gas: Techniques and Tools
 
Artificial Intelligence in due diligence
Artificial Intelligence in due diligenceArtificial Intelligence in due diligence
Artificial Intelligence in due diligence
 
Instruct Nirmaana 24-Smart and Lean Construction Through Technology.pdf
Instruct Nirmaana 24-Smart and Lean Construction Through Technology.pdfInstruct Nirmaana 24-Smart and Lean Construction Through Technology.pdf
Instruct Nirmaana 24-Smart and Lean Construction Through Technology.pdf
 
Seismic Hazard Assessment Software in Python by Prof. Dr. Costas Sachpazis
Seismic Hazard Assessment Software in Python by Prof. Dr. Costas SachpazisSeismic Hazard Assessment Software in Python by Prof. Dr. Costas Sachpazis
Seismic Hazard Assessment Software in Python by Prof. Dr. Costas Sachpazis
 
21scheme vtu syllabus of visveraya technological university
21scheme vtu syllabus of visveraya technological university21scheme vtu syllabus of visveraya technological university
21scheme vtu syllabus of visveraya technological university
 
Dynamo Scripts for Task IDs and Space Naming.pptx
Dynamo Scripts for Task IDs and Space Naming.pptxDynamo Scripts for Task IDs and Space Naming.pptx
Dynamo Scripts for Task IDs and Space Naming.pptx
 
21P35A0312 Internship eccccccReport.docx
21P35A0312 Internship eccccccReport.docx21P35A0312 Internship eccccccReport.docx
21P35A0312 Internship eccccccReport.docx
 
litvinenko_Henry_Intrusion_Hong-Kong_2024.pdf
litvinenko_Henry_Intrusion_Hong-Kong_2024.pdflitvinenko_Henry_Intrusion_Hong-Kong_2024.pdf
litvinenko_Henry_Intrusion_Hong-Kong_2024.pdf
 
Final DBMS Manual (2).pdf final lab manual
Final DBMS Manual (2).pdf final lab manualFinal DBMS Manual (2).pdf final lab manual
Final DBMS Manual (2).pdf final lab manual
 
5G and 6G refer to generations of mobile network technology, each representin...
5G and 6G refer to generations of mobile network technology, each representin...5G and 6G refer to generations of mobile network technology, each representin...
5G and 6G refer to generations of mobile network technology, each representin...
 
UNIT 4 PTRP final Convergence in probability.pptx
UNIT 4 PTRP final Convergence in probability.pptxUNIT 4 PTRP final Convergence in probability.pptx
UNIT 4 PTRP final Convergence in probability.pptx
 
Worksharing and 3D Modeling with Revit.pptx
Worksharing and 3D Modeling with Revit.pptxWorksharing and 3D Modeling with Revit.pptx
Worksharing and 3D Modeling with Revit.pptx
 
Fuzzy logic method-based stress detector with blood pressure and body tempera...
Fuzzy logic method-based stress detector with blood pressure and body tempera...Fuzzy logic method-based stress detector with blood pressure and body tempera...
Fuzzy logic method-based stress detector with blood pressure and body tempera...
 
Insurance management system project report.pdf
Insurance management system project report.pdfInsurance management system project report.pdf
Insurance management system project report.pdf
 
Intro to Design (for Engineers) at Sydney Uni
Intro to Design (for Engineers) at Sydney UniIntro to Design (for Engineers) at Sydney Uni
Intro to Design (for Engineers) at Sydney Uni
 
handbook on reinforce concrete and detailing
handbook on reinforce concrete and detailinghandbook on reinforce concrete and detailing
handbook on reinforce concrete and detailing
 
8th International Conference on Soft Computing, Mathematics and Control (SMC ...
8th International Conference on Soft Computing, Mathematics and Control (SMC ...8th International Conference on Soft Computing, Mathematics and Control (SMC ...
8th International Conference on Soft Computing, Mathematics and Control (SMC ...
 
CLOUD COMPUTING SERVICES - Cloud Reference Modal
CLOUD COMPUTING SERVICES - Cloud Reference ModalCLOUD COMPUTING SERVICES - Cloud Reference Modal
CLOUD COMPUTING SERVICES - Cloud Reference Modal
 
NO1 Best Powerful Vashikaran Specialist Baba Vashikaran Specialist For Love V...
NO1 Best Powerful Vashikaran Specialist Baba Vashikaran Specialist For Love V...NO1 Best Powerful Vashikaran Specialist Baba Vashikaran Specialist For Love V...
NO1 Best Powerful Vashikaran Specialist Baba Vashikaran Specialist For Love V...
 
Artificial intelligence presentation2-171219131633.pdf
Artificial intelligence presentation2-171219131633.pdfArtificial intelligence presentation2-171219131633.pdf
Artificial intelligence presentation2-171219131633.pdf
 

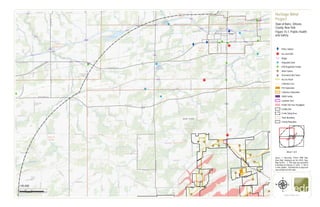
Figure 15-1. Public Health and Safety Maps