SlideShare a Scribd company logo
1 of 74
Download to read offline
STRESSES IN SOIL
• Structural loads are supported on soil via foundations.
• The loads produce stresses and resulting strains.
• Deformation in vertical direction occurring due to
vertical stresses is called settlement.
• Stresses which produce excessive deformations are
termed as failure stresses.
• Stresses also develop due to the soil layer above any
point, known as geostatic stress or over burden
pressure.
• Magnitude of geostatic stress at a point is affected by
groundwater table fluctuation.
• Intensity of stress is not uniform but vary from point to
point.
• For the design of structures such as retaining walls,
sheet piles for braced excavations and waterfront
structures and some types of pile foundations,
stresses acting in the horizontal direction are more
important.
• The knowledge of stress distribution along a soil
cross section is important to analyse the problems
such as,
a- Settlement of foundations
b- Stability (bearing capacity) of foundations
c- Stability of slopes
d- Stability of retaining structures
• Soil mass is a skeleton of solid particles enclosing
voids.
• Voids may contain water (saturated soil), air (dry soil) or
both (partially saturated soil).
• When stress is applied, volume of soil reduces due to
rearrangement of solid particles.
• Volume reduction brings particles close, forces acting
at inter-particle contacts increase
• Forces acting between the particles remain unchanged
if the rearrangement of particles does not occur.
• In fully saturated soil, reduction in volume in not
possible, unless some water escapes
• Water within the voids can also withstand stresses by
an increase in pressure when the soil is fully saturated.
• In a saturated soil mass, the following three types of
stresses are generally considered while dealing with
soil engineering problems.
TYPES OF STRESSES
The stress developed at any point in a soil mass due
any applied loading and/or weight of soil lying above
that point is known as the total stress.
a- Total stress:
Total stress at section XX in Fig:-1 & 2 is written as follows;
σ = γb D + γsatZ (1)
σ = γwD + γsat.1Z1 + γsat.2Z2 (2)
• It is termed as neutral stress since it acts equally in all
directions.
• The neutral stress reduces the inter-particle stress and
the strength of soil is reduced.
b- Neutral stress
(pore water pressure):
• It is the pressure of water
filling the voids between
solid particles.
Neutral stress or hydrostatic pressure at sec. XX for Fig:-1 & 2
• u = w Z (3)
• u = w D + w Z1 + w Z2 (4)
c- Effective stress:
•The stress carried by solid particles at their points of
contact (Fig.3).
•It is the sum of vertical components of forces developed
at points of contact between the soil particles divided the
cross- sectional are
Fig:-3
• It is the effective stress due to which frictional resistance
against particle movement such as rolling, slipping, sliding,
etc., develops.
• When effective stress is zero, the soil is in a critical condition.
• Effective stress is expressed as follows;
σ/
= σ – u (5)
 The effective stress at section XX for Fig. 1, is given below;
σ/
= γb D + γsatZ – γwZ (6)
σ/
= γb D + Z(γsat -γw) (7)
= γb D + γsubZ (8)
Where, γsub or γ/
is submerged or
buoyant unit weight of the soil.
Consider Fig. 1,
• If water table rises to ground surface, the effective stress will
be equal to “γsub(Z+D)”,
• If water table lowers down to XX, then the effective stress
will be equal to “γb(Z+D)”.
• Hence it can be said that the lowering of water table causes
an increase in the effective stress, because γb > γsub,
• The effective stress at section XX for Fig. 2 is as follows;
σ/
= γwD + γsat.1Z1 + γsat.2Z2 – (γwD + γwZ1 + γwZ2) (9)
= Z1(γsat.1 -γw) + Z2(γsat.2 -γw) (10)
= γsub.1Z1+ γsub.2Z2 (11)
• Equation 11 shows that effective stress is independent of
depth of water above the ground surface.
SIGNIFICANCE OF EFFECTIVE STRESS
• Whenever load is applied to a soil stratum, major
principal stresses on horizontal planes within the soil
layer increase.
• For sustained load, soil settles and consolidates, reaching
a new state of equilibrium due to changes in effective
stress.
• Changes in total stress, with effective stress unchanged,
do not cause soil to consolidate
• Whatever the depth of water ‘D’ (Fig. 2), the effective
stress at XX remains constant.
• If water level falls below ground level, effective stress will
increase and consolidation will occur.
• The changes in effective stresses may be brought about
by;
1. Increases in applied loading,
2. Lowering of the ground water table,
3. Reduction in the neutral stresses due to other reasons.
The frictional component of shear strength (σ tan φ), changes
with effective stress, so the designer must always consider the
effective stresses, and not the total stresses, when working
with saturated soils.
RESPONSE OF EFFECTIVE STRESS TO CHANGES IN TOTAL
STRESS
• Consider a saturated soil mass subjected to an increase in total
stress,
• Initial static pore water pressure before increase in total stress = us
• Since pore water is resisting particle rearrangement, pore water
pressure is increased above the static value immediately after
increase in total stress.
• This increase in pore water pressure will be equal to the increase
in total vertical stress,
u = us + ue (13)
• The soil is said to be in drained condition when ue = 0.
• The term ‘drained’ does not mean that all water has left the soil
pores.
• It simply means that excess pore water pressure has dissipated.
• The soil remains fully saturated throughout the process of
drainage
• As drainage from the pores takes place, soil particles get closer
and inter-particle or effective stress increases.
• With complete dissipation of excess pore pressure, the increase of
total vertical stress is carried entirely by the solid particles.
• For low permeability soils, long time is required for drainage to
occur, resulting in gradual transfer of increase in total stress
from neutral stress (pore water pressure) to the effective stress
(inter-particle stress). The process is known as consolidation.
• Let increase in the total stress due a load applied = ∆σ
• Short-term effect of ∆σ is the increase in pore pressure (us) to a
new value of (us +ue).
• Immediately after application of stress, ue = ∆σ.
• Before application of stress ∆σ, the total stress is expressed as
under,
σ = σ/
+ us (14)
Short-term effect of stress increase can be expressed:
σ + ∆σ = σ/
+ (us + ue) = σ/
+ (us + ∆σ) since, ue = ∆σ (15)
Where, ue = ∆σ is the initial ‘excess hydrostatic pressure’.
With completion of drainage, the transfer from neutral stress
to effective stress gives the equation:
σ + ∆σ = (σ/
+ ∆σ⁄
) + us (16)
U = Us = w z U = Us + Ue = w z +
STRESSES DUE TO APPLIED LOADING
• Whenever loads are applied to soil, additional stresses are
induced
• These stresses are distributed throughout the soil mass.
• The distribution of stress depends on the following
properties.
1. Modulus of elasticity or the stress-strain behaviour
2. Poisson’s ratio
3. Stratification
• For analysis of engineering problem, intensity of stress at
different points within the influence zone is required.
• Methods to determine subsurface stresses are mostly
based on the theory of elasticity.
• Stress-strain behaviour of soil is very complex,
simplifying assumptions are generally made the stresses
thus computed are approximate.
• Fortunately, the results are good enough for the soil
problems commonly encountered in practice.
BOUSSINESQ’S METHOD
• Boussinesq’s theory for stress distribution (1885) is
based on the theory of elasticity.
• It is used to estimate stress in soil due to point load
applied at the ground surface.
Boussinesq’s made the following assumptions.
1. The soil mass is an elastic, homogeneous1
, isotropic2
and
semi- infinite3
medium which extends infinitely in all
directions from a level surface.
2. The soil is weightless.
3. The soil is not subjected to any other stress before the
application of point load.
4. The stress distribution due to point load is independent of
the type of soil.
5. The law of linear stress distribution is valid.
6. There exists a continuity of stress.
7. The change in soil volume due to loading is neglected.
8. The stress distribution is symmetrical with respect to z-axis.
1- Homogeneous- same material properties (e.g. e, m, γ,
structure, etc.) through the soil mass
2- Isotropic- same elastic properties in all directions
3-Semi-infinite- a medium bounded on one side with a
horizontal boundary. In case of soil, ground surface is the
boundary and semi-infinite medium means the soil mass below
the ground surface.
Consider system as shown.
(17)
Where,
P, is the applied loading
Z, is the depth where stress is
required
r, is the radial distance and
kb
is Boussinesq’s stress coefficient and is given below
2
5
2
2
1
2
3








z
r
kb

2
5
2
2
1
478
.
0








z
r  2
5
2
2
3
478
.
0
z
r
z


(18)
kb can be determined from the given values of r/z from
the Eq-18. When the point ‘A’ lies on the z-axis i.e., r = 0
And ‘σz’ for such a condition is maximum
kb = 0.478 (19)
b
z k
z
p
2


Boussinesq’s equation has the following important points
worth noting,
1. The vertical stress does not depend on the modulus of elasticity
(E) and the poisson’s ratio ().
2. It only depends on magnitude of load and the coordinates (r , z).
3. At the ground surface (z = 0), the vertical stress is theoretically
infinite. However, in actual case only finite stress develops.
4. The vertical stress (z) decreases rapidly with an increase in r/z
ratio.
5. Theoretically, the vertical stress would be zero only at an infinite
distance. But actually the vertical stress becomes negligible when
r/z = 5 or more.
6. In actual practice, foundation loads are never applied on the
ground surface.
7. The field observations reveal that the actual stresses are generally
smaller than the theoretical values calculated by Boussinesq’s
equation, especially at shallow depths. Thus, the Boussinesq’s
equation, gives conservative values and is commonly used in soil
engineering problems.
LIMITATIONS OF BOUSSINESQ’S EQUATION
1. The equation was developed for stresses in elastic solids. Its
application to soils may be questionable. However, experience
indicates that the results obtained are satisfactory.
2. The application of Boussinesq’s equation can be justified when
there is a stress increase (a loading case, which is in soil). The
real requirement of the equation is that the soil should have a
constant stress-strain ratio, which is almost true for load ranges
applied to the soil.
For the unloading case, when there is a stress decrease the
relation between stress and strain is not linear and, therefore,
the equation is not applicable.
Therefore if stresses in soil are small in comparison with shear
strength, soil behaves somewhat elastically and Boussinesq,s
equation can be used.
3. For practical cases, the Boussinesq’s equation can be safely used
for homogeneous deposits of clay, man-made fills and for
limited thickness of uniform sand deposits. In deep sand
deposits, the modulus of elasticity increases with increase in
depth and, therefore, Boussinesq’s equation does not give
satisfactory results.
4. The point loads applied below ground surface induce somewhat
smaller stresses than those caused by surface loads, and,
therefore, the Boussinesq’s equation is not reliably applicable.
However, the equation is frequently used for shallow footings,
in which z is measured below the base of the footing.
Vertical Stress under Center of a Uniformly Loaded Circular Area
Boussinesq's method is applied to find vertical stress under the
center of a uniformly loaded flexible circular area.
Let ‘q’ be the pressure intensity on circular area of radius ‘R’.
Total load on the elementary area dA
=dp
= q (r d.) dr
(1)
Where,
dA
= length x width of elementary area = (dr
) (r d)
Vertical stress, dz
, for point ‘A’at a depth ‘z’, due dp
(2)
)
(
2
)
d
dr
(
3
2
/
5
2
2
3
z
r
z
qr
d z





The stress at A due to entire loaded area can be found by
integrating Eq-2
(3)
d
)
(
2
3
2
/
5
2
2
3
0
2
0







dr
z
r
r
z
q
d
R
r
r
z
z


 
 




(4)
]
1
)
/
[(
1
1 2
/
3
2









z
R
q
z

Vertical stress under center of uniformly loaded flexible circular area
The variation of z/q with z/R. is given in Table, and
also shown in Figure. The value of z decreases
rapidly with depth; and, at z = 5R, it is about 6% of q,
Intensity of stress under the center of a uniformly loaded flexible area
Vertical Stress Due to Rectangular Loaded Area
Boussinesq's Theory is used to find vertical stress under a
rectangular loaded area.
Area (L x B) at the ground surface is subjected to an applied
pressure = q
Consider a small elementary area dA = dx dy
The load on the area dA = dp = q dx dy
Vertical stress below corner of a uniformly loaded rectangular area
The Vertical stress, dz
, for point ‘A’ below the corner of the
rectangular area at a depth ‘z’, due dp
can be obtained by
replacing P by dp
and r2
by x2
+ y2
in the Bousinesq’s Eq.
Thus.
(5)
)
(x
2
z
dy
dx
3q
2
/
5
2
2
2
3
z
y
d z





(6)
)
(
2
dy)
(
3
3
2
/
5
2
2
2
3
0
0
qI
z
y
x
dx
qz
d
L
x
B
y
z
z 



 

 
 


(7)
1
1
2
tan
1
2
1
1
2
4
1
2
2
2
2
2
2
1
2
2
2
2
2
2
2
2
2
2
3





































 
n
m
n
m
n
m
mm
n
m
n
m
n
m
n
m
n
m
mm
I

The stress z
at A due to the entire loaded area can be
determined by integrating the above equation.
Where,
z
B
m 
z
L
n 
The variation of I3 with m and n is shown in figure-5.
The stress at any point below a rectangular loaded area can be
found by Eq-6 or the figure.
Application of the method
Increase of stress at any point below a rectangularly loaded flexible
area
Fig: 5. Variation
of I3 with m and n
The Eq-6 can be used to calculate stress distribution under a
strip footing at various grid points. From those grid points,
stress isobars can be plotted.
The following fig-6 shows stress isobars for a uniformly loaded
square area.
Figure-6: Vertical pressure isobars under a uniformly loaded square area
Fig: 7. shows the variation of z
/q below the CENTER of a
rectangular loaded area with L/B = 1, 1.5, 2, and ∞, which has
been calculated by using Eq-6.
Figure-7: Stress increase under CENTER of a
uniformly loaded rectangular flexible area
Average Vertical Stress Increase Due to a Rectangular Loaded Area
The variation of vertical stress below the corner of a
uniformly loaded rectangular area (using Eq., z
= qI3
) is
shown in Fig: 8.
For the settlement calculation of a compressible layer, it is
always required to determine the average stress increase, z (av),
below the comer of a uniformly loaded area within the
influence zone, most commonly with limits of z = 0 (from
footing level) to z = H (generally = 2B) as shown in Fig-8. This
can be calculated as follows:
4
3
)
(
)
(
1
qI
dz
qI
H
H
o
av
z 
 

H
B
m 
/
(9)
Wh
ere I4
= f (m’
, n’
)
H
L
n 
/
Figure 8- Average vertical stress increase due to
a rectangular loaded flexible area
The variation of I4 is shown in Figure 9 as proposed by Griffiths 1984
9
Sometimes for the estimation of consolidation settlement, it is
required to determine the average vertical stress in a given
layer, that is between z = H1 to z = H2 as shown in Figure-10.
Griffiths, 1984, gave the following equation.









1
2
)
(
4
1
)
(
4
2
)
/
)(
(
1
2
1
2
H
H
I
H
I
H
q
H
H
H
H
av
z
 (10)
WESTERGAARD'S METHOD:
 Boussinesq’s equation has been developed for homogenous
soil.
 Sedimentary soil deposits are generally stratified and
anisotropic.
 They commonly have alternating layers of sandy and
silt/clay soil. For such conditions Westergaard’s (1938)
presented an equation for subsurface stresses.
Fig: (a) Assumed soil model for development of
equation
2
/
3
2
2
]
)
/
(
)
2
2
/(
)
2
1
[
2
)
2
2
/(
)
2
1
(
z
r
z
p
z












2
/
3
2
2
]
)
/
(
[
2
)
(
z
r
a
z
a
p
z




1
or
2
Where
z = vertical stress at depth z
p = concentrated load
 = Poisson's ratio (ratio of the strain in a direction normal to an
applied stress to the strain parallel to the applied stress)
z = depth
r = horizontal distance from point of application of p to point at
which q is desired
a = (1-2)/(2-2)
If Poisson's ratio is taken to be zero, Eq. (1) changes to
3
2
/
3
2
2
]
)
/
(
2
1
[( z
r
z
p
z




COMPARISON OF WESTERGAARD'S AND BOUSSINESQ’S
EQUATIONS
Sr.
No.
WESTERGAARD'S
EQUATION
BOUSSINESQ’S EQUATION
1
The equation gives the stress
as a function of depth (z)
below the point of
application of load and the
horizontal distance (r) from
the load axis.
The equation also gives the
stress as a function of depth
(z) below the point of
application of load and the
horizontal distance (r) from
the load axis.
Sr.
No.
WESTERGAARD'S
EQUATION
BOUSSINESQ’S
EQUATION
2
For low r/z ratio the
Westergaard’s equation
gives lower values of stress
as compared to
Boussinesq’s equation,
when () is assumed to be
zero.
Using higher poisson’s
ratio (  0.3),
Westergaard’s values of
stress are higher than
Boussinesq’s values.
For low r/z ratio the
Boussinesq’s equation gives
higher values of stress as
compared to Westergaard’s
equation.
Sr.
No.
WESTERGAARD'S
EQUATION
BOUSSINESQ’S
EQUATION
3
Westergaard’s equation is
based on alternating thin
layers of elastic material
between layers of inelastic
material.
Boussinesq’s equation is
developed for homogenous
material.
4
Westergaard’s equation
includes poisson’s ratio
().
For Boussinesq’s equation
() is taken as zero.
5
Westergaard’s equation is
not widely used.
For most practical problems
in geotechnical engineering,
Boussinesq’s equation is
preferred.
APPROXIMATE METHOD
 The method assumes that the area affected by applied load
gradually increases with depth.
 Although the method is not accurate, yet it is used to
estimate the stress for preliminary design.
 Some of the assumptions made for the distribution of load
with depth are given below:
1. The area of stress spreads with 2:1 slope as shown in
the figure.3
2. The area of stress spreads within lines making an angle
of 300
with the vertical
Fig: 11 Stress distribution with 2:1 slope,
(dotted lines indicate distribution of stress at 300 angle)
)
)(
( z
L
z
B
p
z



 4
5
Where
z = Stress at depth z
P = Applied load
B = Width
L = Length
z = Depth
Comparison of the two equations indicates that the
application of first equation is quite simple.
)
30
tan
2
)(
30
tan
2
( z
L
z
B
p
z




NEWMARK’S INFLUENCE CHART
The Boussinesq’s and Westergaard’s theories have been
developed for point loads.
Newmark developed chart based on Boussinesq’s equation
for the determination of stress under the centre of a circular
loaded area.
Consider a circular foundation subjected to loading as in the
figure.
Foundation area = A,
Radius of the area = R,
Uniformly distributed applied load per unit area.= 0
The total load P can be written as, A
A
d
P 0
0



Consider an elementary area dA, within the loaded area as shown
in figure.
The load dp on this elementary area can be written as, dp = 0 dA
=0 (r d dr) Where dA = r d dr
This load dp can be considered as a point load. The stress at point
O caused by this load, can be determined by using Boussinesq’s
eq.
2
/
5
2
2
1
2
3
















z
r
z
d
d
p
z


Putting the value of dp in the above equation
2
/
5
2
2
0
1
2
)
(
3
















z
r
z
dr
rd
d z




Thus the total stress caused by the entire loaded area A can
be obtained by integration of the above equation, or
2
/
5
2
2
0
1
2
)
(
3
















z
r
z
dr
rd
d z




Where 0 = load per unit area on the foundation or the contact stress.
dr
d
r
r
R
z
)
(z
z
2
3
2
/
5
2
2
3
0
2
0
0






 


















2
/
3
2
0
)
/
(
1
1
1
z
R
z 


















2
/
3
2
0 )
/
(
1
1
1
z
R
z


The above equation can be rewritten as follows:
After integration and simplifying we get as follows
2
/
1
3
/
2
0
1
1



















z
z
R
Table: Values of R/z for various values of σz /0
σz
/0
R/z
0
0.1
0.2
0.3
0.4
0.5
0.6
0.7
0.8
0.9
1.0
0
0.2698
0.4005
0.5181
0.6370
0.7664
0.9174
1.1097
1.3871
1.9084
∞
Concentric circles can be drawn using non-dimensional
values of R/z as shown in figure below.
These circles have been divided by suitable number of equally
spaced radial lines to form orthogonal mesh.
This is referred as the Newmark’s chart.
chart
on the
meshes
of
number
1

 IV
value
e
Influenc
rays
of
number
x
circles
of
number
1

 IV
value
e
Influenc
For the Influence Chart shown in the figure,
Iv = 1/10x20 = 1/200 = 0.005
z
= (Iv)(n)(0
)
Figure: Newmark’s
influence chart for
computing vertical
pressure.
Find the intensity of vertical pressure at 10’ of a square footing having
dimensions 10’x10’ and a load of 2 T/ft2
act on the footing. Find vertical
pressure at centre of footing?
Solution.
1. Boussinesq Equation
We have to find vertical pressure at center of
footing of dimensions 10’x10’ at 10’ depth.
i.e z = 10 ft
we consider the footing as a whole i.e.
footing
app A
P 
  T
200
100
2 


0

r
according to Boussinesq Equation 2
/
5
2
2
2
2
1
2
3









r
Z
P
z


By putting values
  2
/
5
2
1
2
3
10
200

 

Z
2
T/ft
955
.
0

10-ft
10-ft
2 T/ft2
200 T
2. Distributing the load on 4-areas (each 5’ x 5’)
Now we have to find vertical stress at
center of footing of dimensions 10’x10’ at
10’ depth.
i.e z = 10 ft
but considering the 4 loads as shown, it is
more close to realistic situation
1.a. Boussinesq’s Equation
footing
app A
P 
 
1 T
50
5
5
2 



5355
.
3
5
.
2
5
.
2 2
2



r
according to the Equation stress due to one load
2
/
5
2
2
2
1
2
3









Z
r
Z
P
z


By putting values
  2
/
5
2
125
.
1
2
3
10
50

 

Z
2
T/ft
178
.
0

5’
5’
50 T 50 T
50 T
2 T/ft2
5’
5’
r
50 T
Stress due to four loads
2
T/ft
0.712
4
178
.
0 


The true stress will be determined by considering 100 loads each of 2-tons applied on
1-square foot area.
3. Westergaard’s Equation
 
  2
/
3
2
2
/
2
1
Z z
r
P
z




where
T
200
10
2 2




 A
P  ft
Z 10
 0

r
By putting values
 
 
2
2
/
3
2
2
T/ft
637
.
0
0
2
1
10
200




Z
The method is applicable to find stress
under the corner of a loaded area.
Footing is divided into 4 small square
footings of 5’ x 5’.
The centre of the actual footing under
which the stress is required becomes the
corner of the area of 5 x5.
The relation for finding stress at centre of
given footing is given by
4. Stress due to uniformly loaded rectangular area.
5’
5’ 2 T/ft2
5’
5’
2 T/ft2
2 T/ft2 2 T/ft2
 
  3
0 0
2
/
5
2
2
2
3
2
2
.
3
qI
z
y
x
dy
dx
qz
d
B
r
L
x
z 



  
   


where





































 
1
1
2
tan
1
1
1
1
2
4
1
2
2
2
2
2
2
1
2
2
2
2
2
2
2
2
2
2
3
n
m
n
m
n
m
mn
n
m
n
m
n
m
n
m
n
m
mn
x
I
As given footing has same length L and B. So
  3
)
4
(
3
)
3
(
3
)
2
(
3
)
1
(
3 4
or
Z
L
n
and qI
I
I
I
I
q
Z
B
m Z 





 
5
.
0
10
5


 n
m
Therefore from graph of I3 with m and n, we have I3 = 0.084
2
10
T/ft
672
.
0
084
.
0
2
4
'
'




 
I3 can be determined from the above equation, but it is very laborious,
It can be easily found by the graph or table on next pages
Fig: Variation of
I3 with m and n
5. NEWMARK’S INFLUENCE CHART.
005
.
0
20
10
1
Rays
of
No.
circles
of
No.
1
IV
Value
Influence 





66
n
footing
given
for
meshes
of
. 

No
2
0 T/ft
66
.
0
2
66
005
.
0
)
)(
)(
1
( 



 
 n
V
z
6. APPROXIMATE METHOD
)
)(
( z
L
z
B
p
z




2
/
5
.
0
)
10
10
)(
10
10
(
200
ft
T
z 




Result:-
2
T/ft
995
.
0
Method
Boussinesq
From
-
1 
z

2
T/ft
637
.
0
Equation
rds
Westergaa
From
-
3 
z

2
T/ft
50
.
0
Analysis
e
Approximat
From
-
4 
z

2
T/ft
66
.
0
Chart
Influence
Newmarks
From
-
5 
z

2
T/ft
712
.
0
loads
4
using
Method,
Boussinesq
From
-
2 
z

2
3 T/ft
672
.
0
,
I
factor
influence
From
-
3 
z

Determine vertical soil pressure under footing
2 to 1 method
Assume stresses distributes in a 2 to 1 slope under footing.
Vertical stress at a depth z under a rectangular footing is
p= P /[(B+Z)(L+Z) [1.17]
Example 10: Determine vertical soil pressure using 2:1 method
Given:
Footing: 8 feet x 4 feet rectangular footing
Column load = 25 kips
Requirement:
Determine vertical soil pressure at 6’ below bottom of footing
Solution:
q =P /[(B+Z)(L+Z)] = 25000 / [(8+6)(4+6)] = 178.6 lbs/ft2
.
Newmark’s influence chart
Boussinesq equation
Newmark’s influence chart is developed
from Boussinesq’s equation. Boussinesq’s
equation considers a point load on a semi-
infinite, homogeneous, isotropic,
weightless, elastic half-space as shown
below
By integrating Boussineq’s equation over a circular area of radius R, one obtains a
relationship between P/P and R/D as
P/P = 1-{1/[1+(R/D)2
]3/2
} [1.18]
Newmark’s chart is constructed by rewriting Equation 1.18 as
R/D = [(1-P/P)-2/3
-1]1/2
[1.19]
Or
P/P 0.1 0.2 0.3 0.4 0.5 0.6 0.7 0.8 0.9 1.0
R/D 0.27 0.40 0.52 0.64 0.77 0.92 1.1 1.39 1.91 
In Newmark’s chart, if the length of one unit equals to D, then the radius of the ring
is equal to R. The area inside each circle is the ratio of P/P. The area inside the
first inside circle is 0.1, and the area inside the second circle is 0.2, etc. To be
able to measure the area inside the circle, the area is divided in to a number of
pieces. Each piece between the circle and radical lines is a unit. The number of
units multiplied by an influence value should be equal to the ratio of P/P of the
circle. Therefore,
P=P I N
Where, I is an influence of Newmark’s chart and N is the number of units inside the
circle.
For the chart shown below, there are 200 pieces in the total area. Then, the influence
value of the chart is 1/200= 0.005. Therefore, the ratio of P/P for the first circle is 20
units x 0.005 = 0.1. Although, the chart is developed based on circular area, it can be
extended to other shape of footing by placing a scaled footing area on top of the
chart.
Example 11: Determine vertical soil
pressure using Newmark’s chart
Given:
Footing: 6 feet square footing
Column load = 25 kips including weight of
footing
Requirement:
Determine vertical soil pressure at 6’ below
bottom of footing at center of footing and at a
corner of the footing
Solution:
The footing is draw to scale according to a
depth of 6’. Square #1 is placed on the chart
with center of the footing at the center of circle.
Square #2 is placed on the chart with corner of
footing at the center of the circle.
Pressure at the bottom of footing, P = 25000/36=694 lbs/ft2.
The influence value of the chart is 0.005
The number of unit inside Square #1 is about 68.
The vertical at 6’ below the center of the footing P = 694*0.005*68 =236 lbs/ft2.
The number of unit inside Square #2 is about 35.
The vertical at 6’ below the corner of the footing P = 694*0.005*35 =121 lbs/ft2.

More Related Content

What's hot

ppt of consolidation and settlement of soil
ppt of consolidation and settlement of soilppt of consolidation and settlement of soil
ppt of consolidation and settlement of soilSAMRAT CHODHURY
 
Lateral Earth Pressure
Lateral Earth PressureLateral Earth Pressure
Lateral Earth PressureFast-NU Lahore
 
Geotechnical Engineering-II [Lec #11: Settlement Computation]
Geotechnical Engineering-II [Lec #11: Settlement Computation]Geotechnical Engineering-II [Lec #11: Settlement Computation]
Geotechnical Engineering-II [Lec #11: Settlement Computation]Muhammad Irfan
 
Soil compaction and effects on soil properties
Soil compaction and effects on soil propertiesSoil compaction and effects on soil properties
Soil compaction and effects on soil propertiespremsai05
 
Geotechnical Engineering-II [Lec #9+10: Westergaard Theory]
Geotechnical Engineering-II [Lec #9+10: Westergaard Theory]Geotechnical Engineering-II [Lec #9+10: Westergaard Theory]
Geotechnical Engineering-II [Lec #9+10: Westergaard Theory]Muhammad Irfan
 
Geotechnical Engineering-II [Lec #23: Rankine Earth Pressure Theory]
Geotechnical Engineering-II [Lec #23: Rankine Earth Pressure Theory]Geotechnical Engineering-II [Lec #23: Rankine Earth Pressure Theory]
Geotechnical Engineering-II [Lec #23: Rankine Earth Pressure Theory]Muhammad Irfan
 
Lecture 3 stresses in soil mass
Lecture 3 stresses in soil massLecture 3 stresses in soil mass
Lecture 3 stresses in soil massELIASASSEFA3
 
TERZAGHI’S BEARING CAPACITY THEORY
TERZAGHI’S BEARING CAPACITY THEORYTERZAGHI’S BEARING CAPACITY THEORY
TERZAGHI’S BEARING CAPACITY THEORYSANJEEV Wazir
 
Lateral earth pressure theories by abhishek sharma
Lateral earth pressure theories by abhishek sharmaLateral earth pressure theories by abhishek sharma
Lateral earth pressure theories by abhishek sharmaABHISHEK SHARMA
 
Chapter 3 -consolidation notes
Chapter 3 -consolidation notesChapter 3 -consolidation notes
Chapter 3 -consolidation notesDYPCET
 
Earth pressure( soil mechanics)
Earth pressure( soil mechanics)Earth pressure( soil mechanics)
Earth pressure( soil mechanics)Darshil Vekaria
 
Geotechnical Engineering-I [Lec #13: Soil Compaction]
Geotechnical Engineering-I [Lec #13: Soil Compaction]Geotechnical Engineering-I [Lec #13: Soil Compaction]
Geotechnical Engineering-I [Lec #13: Soil Compaction]Muhammad Irfan
 
Goetech. engg. Ch# 03 settlement analysis signed
Goetech. engg. Ch# 03 settlement analysis signedGoetech. engg. Ch# 03 settlement analysis signed
Goetech. engg. Ch# 03 settlement analysis signedIrfan Malik
 
Consolidation settlement
Consolidation settlementConsolidation settlement
Consolidation settlementParth Joshi
 

What's hot (20)

ppt of consolidation and settlement of soil
ppt of consolidation and settlement of soilppt of consolidation and settlement of soil
ppt of consolidation and settlement of soil
 
Lateral Earth Pressure
Lateral Earth PressureLateral Earth Pressure
Lateral Earth Pressure
 
Geotechnical Engineering-II [Lec #11: Settlement Computation]
Geotechnical Engineering-II [Lec #11: Settlement Computation]Geotechnical Engineering-II [Lec #11: Settlement Computation]
Geotechnical Engineering-II [Lec #11: Settlement Computation]
 
Unit3 hbn
Unit3 hbnUnit3 hbn
Unit3 hbn
 
Soil compaction and effects on soil properties
Soil compaction and effects on soil propertiesSoil compaction and effects on soil properties
Soil compaction and effects on soil properties
 
Geotechnical Engineering-II [Lec #9+10: Westergaard Theory]
Geotechnical Engineering-II [Lec #9+10: Westergaard Theory]Geotechnical Engineering-II [Lec #9+10: Westergaard Theory]
Geotechnical Engineering-II [Lec #9+10: Westergaard Theory]
 
Geotechnical Engineering-II [Lec #23: Rankine Earth Pressure Theory]
Geotechnical Engineering-II [Lec #23: Rankine Earth Pressure Theory]Geotechnical Engineering-II [Lec #23: Rankine Earth Pressure Theory]
Geotechnical Engineering-II [Lec #23: Rankine Earth Pressure Theory]
 
Chapter 11
Chapter 11Chapter 11
Chapter 11
 
Bearing failure
Bearing failureBearing failure
Bearing failure
 
Lecture 3 stresses in soil mass
Lecture 3 stresses in soil massLecture 3 stresses in soil mass
Lecture 3 stresses in soil mass
 
TERZAGHI’S BEARING CAPACITY THEORY
TERZAGHI’S BEARING CAPACITY THEORYTERZAGHI’S BEARING CAPACITY THEORY
TERZAGHI’S BEARING CAPACITY THEORY
 
Lateral earth pressure theories by abhishek sharma
Lateral earth pressure theories by abhishek sharmaLateral earth pressure theories by abhishek sharma
Lateral earth pressure theories by abhishek sharma
 
Soil Compaction
Soil CompactionSoil Compaction
Soil Compaction
 
Chapter 3 -consolidation notes
Chapter 3 -consolidation notesChapter 3 -consolidation notes
Chapter 3 -consolidation notes
 
Lecture 3 foundation settlement
Lecture 3 foundation settlementLecture 3 foundation settlement
Lecture 3 foundation settlement
 
Earth pressure( soil mechanics)
Earth pressure( soil mechanics)Earth pressure( soil mechanics)
Earth pressure( soil mechanics)
 
Geotechnical Engineering-I [Lec #13: Soil Compaction]
Geotechnical Engineering-I [Lec #13: Soil Compaction]Geotechnical Engineering-I [Lec #13: Soil Compaction]
Geotechnical Engineering-I [Lec #13: Soil Compaction]
 
Goetech. engg. Ch# 03 settlement analysis signed
Goetech. engg. Ch# 03 settlement analysis signedGoetech. engg. Ch# 03 settlement analysis signed
Goetech. engg. Ch# 03 settlement analysis signed
 
Consolidation settlement
Consolidation settlementConsolidation settlement
Consolidation settlement
 
Consolidation
ConsolidationConsolidation
Consolidation
 

Similar to 326027186-Stresses-in-Soil.pdf

Lecture 3 stresses in soil mass
Lecture 3 stresses in soil massLecture 3 stresses in soil mass
Lecture 3 stresses in soil massELIASASSEFA3
 
Unit 5 BEARING CAPACITY AND SLOPE STABILITY.ppt
Unit 5 BEARING CAPACITY AND SLOPE STABILITY.pptUnit 5 BEARING CAPACITY AND SLOPE STABILITY.ppt
Unit 5 BEARING CAPACITY AND SLOPE STABILITY.pptsatheeshkumarcivil
 
Section 2-gte-i
Section  2-gte-iSection  2-gte-i
Section 2-gte-iDYPCET
 
BEARING CAPASITY OFSOIL.ppt
BEARING CAPASITY OFSOIL.pptBEARING CAPASITY OFSOIL.ppt
BEARING CAPASITY OFSOIL.pptSamuelGetiye
 
BEARING CAPASITY OFSOIL.ppt
BEARING CAPASITY OFSOIL.pptBEARING CAPASITY OFSOIL.ppt
BEARING CAPASITY OFSOIL.pptsjshukla
 
BEARING CAPASITY OFSOIL.ppt
BEARING CAPASITY OFSOIL.pptBEARING CAPASITY OFSOIL.ppt
BEARING CAPASITY OFSOIL.pptjamvantsolanki
 
SOIL STRENGTH AND SOIL FORCES
SOIL STRENGTH AND SOIL FORCESSOIL STRENGTH AND SOIL FORCES
SOIL STRENGTH AND SOIL FORCESAfendiAriff
 
12._stresses_in_a_soil_mass_fall_36-37.pptx
12._stresses_in_a_soil_mass_fall_36-37.pptx12._stresses_in_a_soil_mass_fall_36-37.pptx
12._stresses_in_a_soil_mass_fall_36-37.pptxSadafQasim3
 
Stresses in soil
Stresses in soilStresses in soil
Stresses in soilrajini24
 
EARTH PRESSURE - REVISED for backlog.pptx
EARTH PRESSURE - REVISED for backlog.pptxEARTH PRESSURE - REVISED for backlog.pptx
EARTH PRESSURE - REVISED for backlog.pptxathars248
 
Bearing capasity ofsoil vandana miss
Bearing capasity ofsoil vandana missBearing capasity ofsoil vandana miss
Bearing capasity ofsoil vandana missSHAMJITH KM
 
Geotechnical Engineering-II [Lec #7: Soil Stresses due to External Load]
Geotechnical Engineering-II [Lec #7: Soil Stresses due to External Load]Geotechnical Engineering-II [Lec #7: Soil Stresses due to External Load]
Geotechnical Engineering-II [Lec #7: Soil Stresses due to External Load]Muhammad Irfan
 
Geotechnical Engineering-II [Lec #7A: Boussinesq Method]
Geotechnical Engineering-II [Lec #7A: Boussinesq Method]Geotechnical Engineering-II [Lec #7A: Boussinesq Method]
Geotechnical Engineering-II [Lec #7A: Boussinesq Method]Muhammad Irfan
 
ASM-1 stress & displacement.pptx.PDF
ASM-1 stress & displacement.pptx.PDFASM-1 stress & displacement.pptx.PDF
ASM-1 stress & displacement.pptx.PDFAdityaPatel210981
 
7 vertical stresses below applied loads (1)
7 vertical stresses below applied loads (1)7 vertical stresses below applied loads (1)
7 vertical stresses below applied loads (1)Saurabh Kumar
 

Similar to 326027186-Stresses-in-Soil.pdf (20)

Geotechnical vertical stress
Geotechnical vertical stressGeotechnical vertical stress
Geotechnical vertical stress
 
Lecture 3 stresses in soil mass
Lecture 3 stresses in soil massLecture 3 stresses in soil mass
Lecture 3 stresses in soil mass
 
Unit 5 BEARING CAPACITY AND SLOPE STABILITY.ppt
Unit 5 BEARING CAPACITY AND SLOPE STABILITY.pptUnit 5 BEARING CAPACITY AND SLOPE STABILITY.ppt
Unit 5 BEARING CAPACITY AND SLOPE STABILITY.ppt
 
Section 2-gte-i
Section  2-gte-iSection  2-gte-i
Section 2-gte-i
 
stress distribution in soils
stress distribution in soilsstress distribution in soils
stress distribution in soils
 
BEARING CAPASITY OFSOIL.ppt
BEARING CAPASITY OFSOIL.pptBEARING CAPASITY OFSOIL.ppt
BEARING CAPASITY OFSOIL.ppt
 
BEARING CAPASITY OFSOIL.ppt
BEARING CAPASITY OFSOIL.pptBEARING CAPASITY OFSOIL.ppt
BEARING CAPASITY OFSOIL.ppt
 
BEARING CAPASITY OFSOIL.ppt
BEARING CAPASITY OFSOIL.pptBEARING CAPASITY OFSOIL.ppt
BEARING CAPASITY OFSOIL.ppt
 
SOIL STRENGTH AND SOIL FORCES
SOIL STRENGTH AND SOIL FORCESSOIL STRENGTH AND SOIL FORCES
SOIL STRENGTH AND SOIL FORCES
 
Bearing capasity of soil
Bearing capasity of soilBearing capasity of soil
Bearing capasity of soil
 
12._stresses_in_a_soil_mass_fall_36-37.pptx
12._stresses_in_a_soil_mass_fall_36-37.pptx12._stresses_in_a_soil_mass_fall_36-37.pptx
12._stresses_in_a_soil_mass_fall_36-37.pptx
 
Ly thuyet ALD_Geo 5.pdf
Ly thuyet ALD_Geo 5.pdfLy thuyet ALD_Geo 5.pdf
Ly thuyet ALD_Geo 5.pdf
 
Stresses in soil
Stresses in soilStresses in soil
Stresses in soil
 
EARTH PRESSURE - REVISED for backlog.pptx
EARTH PRESSURE - REVISED for backlog.pptxEARTH PRESSURE - REVISED for backlog.pptx
EARTH PRESSURE - REVISED for backlog.pptx
 
Bearing capasity ofsoil vandana miss
Bearing capasity ofsoil vandana missBearing capasity ofsoil vandana miss
Bearing capasity ofsoil vandana miss
 
Geotechnical Engineering-II [Lec #7: Soil Stresses due to External Load]
Geotechnical Engineering-II [Lec #7: Soil Stresses due to External Load]Geotechnical Engineering-II [Lec #7: Soil Stresses due to External Load]
Geotechnical Engineering-II [Lec #7: Soil Stresses due to External Load]
 
Geotechnical Engineering-II [Lec #7A: Boussinesq Method]
Geotechnical Engineering-II [Lec #7A: Boussinesq Method]Geotechnical Engineering-II [Lec #7A: Boussinesq Method]
Geotechnical Engineering-II [Lec #7A: Boussinesq Method]
 
ASM-1 stress & displacement.pptx.PDF
ASM-1 stress & displacement.pptx.PDFASM-1 stress & displacement.pptx.PDF
ASM-1 stress & displacement.pptx.PDF
 
7 vertical stresses below applied loads (1)
7 vertical stresses below applied loads (1)7 vertical stresses below applied loads (1)
7 vertical stresses below applied loads (1)
 
Earth pressure
Earth pressureEarth pressure
Earth pressure
 

Recently uploaded

Work-Permit-Receiver-in-Saudi-Aramco.pptx
Work-Permit-Receiver-in-Saudi-Aramco.pptxWork-Permit-Receiver-in-Saudi-Aramco.pptx
Work-Permit-Receiver-in-Saudi-Aramco.pptxJuliansyahHarahap1
 
Computer Lecture 01.pptxIntroduction to Computers
Computer Lecture 01.pptxIntroduction to ComputersComputer Lecture 01.pptxIntroduction to Computers
Computer Lecture 01.pptxIntroduction to ComputersMairaAshraf6
 
Tamil Call Girls Bhayandar WhatsApp +91-9930687706, Best Service
Tamil Call Girls Bhayandar WhatsApp +91-9930687706, Best ServiceTamil Call Girls Bhayandar WhatsApp +91-9930687706, Best Service
Tamil Call Girls Bhayandar WhatsApp +91-9930687706, Best Servicemeghakumariji156
 
Computer Networks Basics of Network Devices
Computer Networks  Basics of Network DevicesComputer Networks  Basics of Network Devices
Computer Networks Basics of Network DevicesChandrakantDivate1
 
Online food ordering system project report.pdf
Online food ordering system project report.pdfOnline food ordering system project report.pdf
Online food ordering system project report.pdfKamal Acharya
 
Double Revolving field theory-how the rotor develops torque
Double Revolving field theory-how the rotor develops torqueDouble Revolving field theory-how the rotor develops torque
Double Revolving field theory-how the rotor develops torqueBhangaleSonal
 
Hazard Identification (HAZID) vs. Hazard and Operability (HAZOP): A Comparati...
Hazard Identification (HAZID) vs. Hazard and Operability (HAZOP): A Comparati...Hazard Identification (HAZID) vs. Hazard and Operability (HAZOP): A Comparati...
Hazard Identification (HAZID) vs. Hazard and Operability (HAZOP): A Comparati...soginsider
 
Bhubaneswar🌹Call Girls Bhubaneswar ❤Komal 9777949614 💟 Full Trusted CALL GIRL...
Bhubaneswar🌹Call Girls Bhubaneswar ❤Komal 9777949614 💟 Full Trusted CALL GIRL...Bhubaneswar🌹Call Girls Bhubaneswar ❤Komal 9777949614 💟 Full Trusted CALL GIRL...
Bhubaneswar🌹Call Girls Bhubaneswar ❤Komal 9777949614 💟 Full Trusted CALL GIRL...Call Girls Mumbai
 
Kuwait City MTP kit ((+919101817206)) Buy Abortion Pills Kuwait
Kuwait City MTP kit ((+919101817206)) Buy Abortion Pills KuwaitKuwait City MTP kit ((+919101817206)) Buy Abortion Pills Kuwait
Kuwait City MTP kit ((+919101817206)) Buy Abortion Pills Kuwaitjaanualu31
 
DC MACHINE-Motoring and generation, Armature circuit equation
DC MACHINE-Motoring and generation, Armature circuit equationDC MACHINE-Motoring and generation, Armature circuit equation
DC MACHINE-Motoring and generation, Armature circuit equationBhangaleSonal
 
Introduction to Serverless with AWS Lambda
Introduction to Serverless with AWS LambdaIntroduction to Serverless with AWS Lambda
Introduction to Serverless with AWS LambdaOmar Fathy
 
Learn the concepts of Thermodynamics on Magic Marks
Learn the concepts of Thermodynamics on Magic MarksLearn the concepts of Thermodynamics on Magic Marks
Learn the concepts of Thermodynamics on Magic MarksMagic Marks
 
Minimum and Maximum Modes of microprocessor 8086
Minimum and Maximum Modes of microprocessor 8086Minimum and Maximum Modes of microprocessor 8086
Minimum and Maximum Modes of microprocessor 8086anil_gaur
 
+97470301568>> buy weed in qatar,buy thc oil qatar,buy weed and vape oil in d...
+97470301568>> buy weed in qatar,buy thc oil qatar,buy weed and vape oil in d...+97470301568>> buy weed in qatar,buy thc oil qatar,buy weed and vape oil in d...
+97470301568>> buy weed in qatar,buy thc oil qatar,buy weed and vape oil in d...Health
 
kiln thermal load.pptx kiln tgermal load
kiln thermal load.pptx kiln tgermal loadkiln thermal load.pptx kiln tgermal load
kiln thermal load.pptx kiln tgermal loadhamedmustafa094
 
"Lesotho Leaps Forward: A Chronicle of Transformative Developments"
"Lesotho Leaps Forward: A Chronicle of Transformative Developments""Lesotho Leaps Forward: A Chronicle of Transformative Developments"
"Lesotho Leaps Forward: A Chronicle of Transformative Developments"mphochane1998
 
Air Compressor reciprocating single stage
Air Compressor reciprocating single stageAir Compressor reciprocating single stage
Air Compressor reciprocating single stageAbc194748
 
HOA1&2 - Module 3 - PREHISTORCI ARCHITECTURE OF KERALA.pptx
HOA1&2 - Module 3 - PREHISTORCI ARCHITECTURE OF KERALA.pptxHOA1&2 - Module 3 - PREHISTORCI ARCHITECTURE OF KERALA.pptx
HOA1&2 - Module 3 - PREHISTORCI ARCHITECTURE OF KERALA.pptxSCMS School of Architecture
 
Hostel management system project report..pdf
Hostel management system project report..pdfHostel management system project report..pdf
Hostel management system project report..pdfKamal Acharya
 

Recently uploaded (20)

Work-Permit-Receiver-in-Saudi-Aramco.pptx
Work-Permit-Receiver-in-Saudi-Aramco.pptxWork-Permit-Receiver-in-Saudi-Aramco.pptx
Work-Permit-Receiver-in-Saudi-Aramco.pptx
 
Computer Lecture 01.pptxIntroduction to Computers
Computer Lecture 01.pptxIntroduction to ComputersComputer Lecture 01.pptxIntroduction to Computers
Computer Lecture 01.pptxIntroduction to Computers
 
Tamil Call Girls Bhayandar WhatsApp +91-9930687706, Best Service
Tamil Call Girls Bhayandar WhatsApp +91-9930687706, Best ServiceTamil Call Girls Bhayandar WhatsApp +91-9930687706, Best Service
Tamil Call Girls Bhayandar WhatsApp +91-9930687706, Best Service
 
FEA Based Level 3 Assessment of Deformed Tanks with Fluid Induced Loads
FEA Based Level 3 Assessment of Deformed Tanks with Fluid Induced LoadsFEA Based Level 3 Assessment of Deformed Tanks with Fluid Induced Loads
FEA Based Level 3 Assessment of Deformed Tanks with Fluid Induced Loads
 
Computer Networks Basics of Network Devices
Computer Networks  Basics of Network DevicesComputer Networks  Basics of Network Devices
Computer Networks Basics of Network Devices
 
Online food ordering system project report.pdf
Online food ordering system project report.pdfOnline food ordering system project report.pdf
Online food ordering system project report.pdf
 
Double Revolving field theory-how the rotor develops torque
Double Revolving field theory-how the rotor develops torqueDouble Revolving field theory-how the rotor develops torque
Double Revolving field theory-how the rotor develops torque
 
Hazard Identification (HAZID) vs. Hazard and Operability (HAZOP): A Comparati...
Hazard Identification (HAZID) vs. Hazard and Operability (HAZOP): A Comparati...Hazard Identification (HAZID) vs. Hazard and Operability (HAZOP): A Comparati...
Hazard Identification (HAZID) vs. Hazard and Operability (HAZOP): A Comparati...
 
Bhubaneswar🌹Call Girls Bhubaneswar ❤Komal 9777949614 💟 Full Trusted CALL GIRL...
Bhubaneswar🌹Call Girls Bhubaneswar ❤Komal 9777949614 💟 Full Trusted CALL GIRL...Bhubaneswar🌹Call Girls Bhubaneswar ❤Komal 9777949614 💟 Full Trusted CALL GIRL...
Bhubaneswar🌹Call Girls Bhubaneswar ❤Komal 9777949614 💟 Full Trusted CALL GIRL...
 
Kuwait City MTP kit ((+919101817206)) Buy Abortion Pills Kuwait
Kuwait City MTP kit ((+919101817206)) Buy Abortion Pills KuwaitKuwait City MTP kit ((+919101817206)) Buy Abortion Pills Kuwait
Kuwait City MTP kit ((+919101817206)) Buy Abortion Pills Kuwait
 
DC MACHINE-Motoring and generation, Armature circuit equation
DC MACHINE-Motoring and generation, Armature circuit equationDC MACHINE-Motoring and generation, Armature circuit equation
DC MACHINE-Motoring and generation, Armature circuit equation
 
Introduction to Serverless with AWS Lambda
Introduction to Serverless with AWS LambdaIntroduction to Serverless with AWS Lambda
Introduction to Serverless with AWS Lambda
 
Learn the concepts of Thermodynamics on Magic Marks
Learn the concepts of Thermodynamics on Magic MarksLearn the concepts of Thermodynamics on Magic Marks
Learn the concepts of Thermodynamics on Magic Marks
 
Minimum and Maximum Modes of microprocessor 8086
Minimum and Maximum Modes of microprocessor 8086Minimum and Maximum Modes of microprocessor 8086
Minimum and Maximum Modes of microprocessor 8086
 
+97470301568>> buy weed in qatar,buy thc oil qatar,buy weed and vape oil in d...
+97470301568>> buy weed in qatar,buy thc oil qatar,buy weed and vape oil in d...+97470301568>> buy weed in qatar,buy thc oil qatar,buy weed and vape oil in d...
+97470301568>> buy weed in qatar,buy thc oil qatar,buy weed and vape oil in d...
 
kiln thermal load.pptx kiln tgermal load
kiln thermal load.pptx kiln tgermal loadkiln thermal load.pptx kiln tgermal load
kiln thermal load.pptx kiln tgermal load
 
"Lesotho Leaps Forward: A Chronicle of Transformative Developments"
"Lesotho Leaps Forward: A Chronicle of Transformative Developments""Lesotho Leaps Forward: A Chronicle of Transformative Developments"
"Lesotho Leaps Forward: A Chronicle of Transformative Developments"
 
Air Compressor reciprocating single stage
Air Compressor reciprocating single stageAir Compressor reciprocating single stage
Air Compressor reciprocating single stage
 
HOA1&2 - Module 3 - PREHISTORCI ARCHITECTURE OF KERALA.pptx
HOA1&2 - Module 3 - PREHISTORCI ARCHITECTURE OF KERALA.pptxHOA1&2 - Module 3 - PREHISTORCI ARCHITECTURE OF KERALA.pptx
HOA1&2 - Module 3 - PREHISTORCI ARCHITECTURE OF KERALA.pptx
 
Hostel management system project report..pdf
Hostel management system project report..pdfHostel management system project report..pdf
Hostel management system project report..pdf
 

326027186-Stresses-in-Soil.pdf

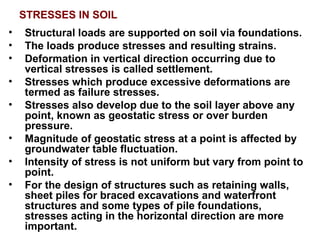
  • 1. STRESSES IN SOIL • Structural loads are supported on soil via foundations. • The loads produce stresses and resulting strains. • Deformation in vertical direction occurring due to vertical stresses is called settlement. • Stresses which produce excessive deformations are termed as failure stresses. • Stresses also develop due to the soil layer above any point, known as geostatic stress or over burden pressure. • Magnitude of geostatic stress at a point is affected by groundwater table fluctuation. • Intensity of stress is not uniform but vary from point to point. • For the design of structures such as retaining walls, sheet piles for braced excavations and waterfront structures and some types of pile foundations, stresses acting in the horizontal direction are more important.
  • 2. • The knowledge of stress distribution along a soil cross section is important to analyse the problems such as, a- Settlement of foundations b- Stability (bearing capacity) of foundations c- Stability of slopes d- Stability of retaining structures
  • 3. • Soil mass is a skeleton of solid particles enclosing voids. • Voids may contain water (saturated soil), air (dry soil) or both (partially saturated soil). • When stress is applied, volume of soil reduces due to rearrangement of solid particles. • Volume reduction brings particles close, forces acting at inter-particle contacts increase • Forces acting between the particles remain unchanged if the rearrangement of particles does not occur. • In fully saturated soil, reduction in volume in not possible, unless some water escapes • Water within the voids can also withstand stresses by an increase in pressure when the soil is fully saturated. • In a saturated soil mass, the following three types of stresses are generally considered while dealing with soil engineering problems. TYPES OF STRESSES
  • 4. The stress developed at any point in a soil mass due any applied loading and/or weight of soil lying above that point is known as the total stress. a- Total stress: Total stress at section XX in Fig:-1 & 2 is written as follows; σ = γb D + γsatZ (1)
  • 5. σ = γwD + γsat.1Z1 + γsat.2Z2 (2)
  • 6. • It is termed as neutral stress since it acts equally in all directions. • The neutral stress reduces the inter-particle stress and the strength of soil is reduced. b- Neutral stress (pore water pressure): • It is the pressure of water filling the voids between solid particles.
  • 7. Neutral stress or hydrostatic pressure at sec. XX for Fig:-1 & 2 • u = w Z (3) • u = w D + w Z1 + w Z2 (4) c- Effective stress: •The stress carried by solid particles at their points of contact (Fig.3). •It is the sum of vertical components of forces developed at points of contact between the soil particles divided the cross- sectional are
  • 8. Fig:-3 • It is the effective stress due to which frictional resistance against particle movement such as rolling, slipping, sliding, etc., develops. • When effective stress is zero, the soil is in a critical condition. • Effective stress is expressed as follows; σ/ = σ – u (5)  The effective stress at section XX for Fig. 1, is given below;
  • 9. σ/ = γb D + γsatZ – γwZ (6) σ/ = γb D + Z(γsat -γw) (7) = γb D + γsubZ (8) Where, γsub or γ/ is submerged or buoyant unit weight of the soil. Consider Fig. 1, • If water table rises to ground surface, the effective stress will be equal to “γsub(Z+D)”, • If water table lowers down to XX, then the effective stress will be equal to “γb(Z+D)”. • Hence it can be said that the lowering of water table causes an increase in the effective stress, because γb > γsub, • The effective stress at section XX for Fig. 2 is as follows;
  • 10. σ/ = γwD + γsat.1Z1 + γsat.2Z2 – (γwD + γwZ1 + γwZ2) (9) = Z1(γsat.1 -γw) + Z2(γsat.2 -γw) (10) = γsub.1Z1+ γsub.2Z2 (11) • Equation 11 shows that effective stress is independent of depth of water above the ground surface.
  • 11. SIGNIFICANCE OF EFFECTIVE STRESS • Whenever load is applied to a soil stratum, major principal stresses on horizontal planes within the soil layer increase. • For sustained load, soil settles and consolidates, reaching a new state of equilibrium due to changes in effective stress. • Changes in total stress, with effective stress unchanged, do not cause soil to consolidate • Whatever the depth of water ‘D’ (Fig. 2), the effective stress at XX remains constant. • If water level falls below ground level, effective stress will increase and consolidation will occur. • The changes in effective stresses may be brought about by;
  • 12. 1. Increases in applied loading, 2. Lowering of the ground water table, 3. Reduction in the neutral stresses due to other reasons. The frictional component of shear strength (σ tan φ), changes with effective stress, so the designer must always consider the effective stresses, and not the total stresses, when working with saturated soils.
  • 13. RESPONSE OF EFFECTIVE STRESS TO CHANGES IN TOTAL STRESS • Consider a saturated soil mass subjected to an increase in total stress, • Initial static pore water pressure before increase in total stress = us • Since pore water is resisting particle rearrangement, pore water pressure is increased above the static value immediately after increase in total stress. • This increase in pore water pressure will be equal to the increase in total vertical stress, u = us + ue (13) • The soil is said to be in drained condition when ue = 0. • The term ‘drained’ does not mean that all water has left the soil pores. • It simply means that excess pore water pressure has dissipated. • The soil remains fully saturated throughout the process of drainage
  • 14. • As drainage from the pores takes place, soil particles get closer and inter-particle or effective stress increases. • With complete dissipation of excess pore pressure, the increase of total vertical stress is carried entirely by the solid particles. • For low permeability soils, long time is required for drainage to occur, resulting in gradual transfer of increase in total stress from neutral stress (pore water pressure) to the effective stress (inter-particle stress). The process is known as consolidation. • Let increase in the total stress due a load applied = ∆σ • Short-term effect of ∆σ is the increase in pore pressure (us) to a new value of (us +ue). • Immediately after application of stress, ue = ∆σ. • Before application of stress ∆σ, the total stress is expressed as under, σ = σ/ + us (14)
  • 15. Short-term effect of stress increase can be expressed: σ + ∆σ = σ/ + (us + ue) = σ/ + (us + ∆σ) since, ue = ∆σ (15) Where, ue = ∆σ is the initial ‘excess hydrostatic pressure’. With completion of drainage, the transfer from neutral stress to effective stress gives the equation: σ + ∆σ = (σ/ + ∆σ⁄ ) + us (16)
  • 16. U = Us = w z U = Us + Ue = w z +
  • 17. STRESSES DUE TO APPLIED LOADING • Whenever loads are applied to soil, additional stresses are induced • These stresses are distributed throughout the soil mass. • The distribution of stress depends on the following properties. 1. Modulus of elasticity or the stress-strain behaviour 2. Poisson’s ratio 3. Stratification • For analysis of engineering problem, intensity of stress at different points within the influence zone is required. • Methods to determine subsurface stresses are mostly based on the theory of elasticity. • Stress-strain behaviour of soil is very complex, simplifying assumptions are generally made the stresses thus computed are approximate. • Fortunately, the results are good enough for the soil problems commonly encountered in practice.
  • 18. BOUSSINESQ’S METHOD • Boussinesq’s theory for stress distribution (1885) is based on the theory of elasticity. • It is used to estimate stress in soil due to point load applied at the ground surface. Boussinesq’s made the following assumptions. 1. The soil mass is an elastic, homogeneous1 , isotropic2 and semi- infinite3 medium which extends infinitely in all directions from a level surface. 2. The soil is weightless. 3. The soil is not subjected to any other stress before the application of point load. 4. The stress distribution due to point load is independent of the type of soil. 5. The law of linear stress distribution is valid. 6. There exists a continuity of stress. 7. The change in soil volume due to loading is neglected. 8. The stress distribution is symmetrical with respect to z-axis.
  • 19. 1- Homogeneous- same material properties (e.g. e, m, γ, structure, etc.) through the soil mass 2- Isotropic- same elastic properties in all directions 3-Semi-infinite- a medium bounded on one side with a horizontal boundary. In case of soil, ground surface is the boundary and semi-infinite medium means the soil mass below the ground surface. Consider system as shown.
  • 20. (17) Where, P, is the applied loading Z, is the depth where stress is required r, is the radial distance and kb is Boussinesq’s stress coefficient and is given below 2 5 2 2 1 2 3         z r kb  2 5 2 2 1 478 . 0         z r  2 5 2 2 3 478 . 0 z r z   (18) kb can be determined from the given values of r/z from the Eq-18. When the point ‘A’ lies on the z-axis i.e., r = 0 And ‘σz’ for such a condition is maximum kb = 0.478 (19) b z k z p 2  
  • 21. Boussinesq’s equation has the following important points worth noting, 1. The vertical stress does not depend on the modulus of elasticity (E) and the poisson’s ratio (). 2. It only depends on magnitude of load and the coordinates (r , z). 3. At the ground surface (z = 0), the vertical stress is theoretically infinite. However, in actual case only finite stress develops. 4. The vertical stress (z) decreases rapidly with an increase in r/z ratio. 5. Theoretically, the vertical stress would be zero only at an infinite distance. But actually the vertical stress becomes negligible when r/z = 5 or more. 6. In actual practice, foundation loads are never applied on the ground surface. 7. The field observations reveal that the actual stresses are generally smaller than the theoretical values calculated by Boussinesq’s equation, especially at shallow depths. Thus, the Boussinesq’s equation, gives conservative values and is commonly used in soil engineering problems.
  • 22. LIMITATIONS OF BOUSSINESQ’S EQUATION 1. The equation was developed for stresses in elastic solids. Its application to soils may be questionable. However, experience indicates that the results obtained are satisfactory. 2. The application of Boussinesq’s equation can be justified when there is a stress increase (a loading case, which is in soil). The real requirement of the equation is that the soil should have a constant stress-strain ratio, which is almost true for load ranges applied to the soil. For the unloading case, when there is a stress decrease the relation between stress and strain is not linear and, therefore, the equation is not applicable. Therefore if stresses in soil are small in comparison with shear strength, soil behaves somewhat elastically and Boussinesq,s equation can be used.
  • 23. 3. For practical cases, the Boussinesq’s equation can be safely used for homogeneous deposits of clay, man-made fills and for limited thickness of uniform sand deposits. In deep sand deposits, the modulus of elasticity increases with increase in depth and, therefore, Boussinesq’s equation does not give satisfactory results. 4. The point loads applied below ground surface induce somewhat smaller stresses than those caused by surface loads, and, therefore, the Boussinesq’s equation is not reliably applicable. However, the equation is frequently used for shallow footings, in which z is measured below the base of the footing.
  • 24.
  • 25. Vertical Stress under Center of a Uniformly Loaded Circular Area Boussinesq's method is applied to find vertical stress under the center of a uniformly loaded flexible circular area. Let ‘q’ be the pressure intensity on circular area of radius ‘R’. Total load on the elementary area dA =dp = q (r d.) dr (1) Where, dA = length x width of elementary area = (dr ) (r d) Vertical stress, dz , for point ‘A’at a depth ‘z’, due dp (2) ) ( 2 ) d dr ( 3 2 / 5 2 2 3 z r z qr d z     
  • 26. The stress at A due to entire loaded area can be found by integrating Eq-2 (3) d ) ( 2 3 2 / 5 2 2 3 0 2 0        dr z r r z q d R r r z z           (4) ] 1 ) / [( 1 1 2 / 3 2          z R q z 
  • 27. Vertical stress under center of uniformly loaded flexible circular area
  • 28. The variation of z/q with z/R. is given in Table, and also shown in Figure. The value of z decreases rapidly with depth; and, at z = 5R, it is about 6% of q, Intensity of stress under the center of a uniformly loaded flexible area
  • 29. Vertical Stress Due to Rectangular Loaded Area Boussinesq's Theory is used to find vertical stress under a rectangular loaded area. Area (L x B) at the ground surface is subjected to an applied pressure = q Consider a small elementary area dA = dx dy The load on the area dA = dp = q dx dy Vertical stress below corner of a uniformly loaded rectangular area
  • 30. The Vertical stress, dz , for point ‘A’ below the corner of the rectangular area at a depth ‘z’, due dp can be obtained by replacing P by dp and r2 by x2 + y2 in the Bousinesq’s Eq. Thus. (5) ) (x 2 z dy dx 3q 2 / 5 2 2 2 3 z y d z      (6) ) ( 2 dy) ( 3 3 2 / 5 2 2 2 3 0 0 qI z y x dx qz d L x B y z z              (7) 1 1 2 tan 1 2 1 1 2 4 1 2 2 2 2 2 2 1 2 2 2 2 2 2 2 2 2 2 3                                        n m n m n m mm n m n m n m n m n m mm I  The stress z at A due to the entire loaded area can be determined by integrating the above equation. Where, z B m  z L n 
  • 31. The variation of I3 with m and n is shown in figure-5. The stress at any point below a rectangular loaded area can be found by Eq-6 or the figure. Application of the method Increase of stress at any point below a rectangularly loaded flexible area
  • 32. Fig: 5. Variation of I3 with m and n
  • 33. The Eq-6 can be used to calculate stress distribution under a strip footing at various grid points. From those grid points, stress isobars can be plotted. The following fig-6 shows stress isobars for a uniformly loaded square area. Figure-6: Vertical pressure isobars under a uniformly loaded square area
  • 34. Fig: 7. shows the variation of z /q below the CENTER of a rectangular loaded area with L/B = 1, 1.5, 2, and ∞, which has been calculated by using Eq-6. Figure-7: Stress increase under CENTER of a uniformly loaded rectangular flexible area
  • 35. Average Vertical Stress Increase Due to a Rectangular Loaded Area The variation of vertical stress below the corner of a uniformly loaded rectangular area (using Eq., z = qI3 ) is shown in Fig: 8. For the settlement calculation of a compressible layer, it is always required to determine the average stress increase, z (av), below the comer of a uniformly loaded area within the influence zone, most commonly with limits of z = 0 (from footing level) to z = H (generally = 2B) as shown in Fig-8. This can be calculated as follows: 4 3 ) ( ) ( 1 qI dz qI H H o av z     H B m  / (9) Wh ere I4 = f (m’ , n’ ) H L n  /
  • 36. Figure 8- Average vertical stress increase due to a rectangular loaded flexible area
  • 37. The variation of I4 is shown in Figure 9 as proposed by Griffiths 1984 9
  • 38. Sometimes for the estimation of consolidation settlement, it is required to determine the average vertical stress in a given layer, that is between z = H1 to z = H2 as shown in Figure-10.
  • 39. Griffiths, 1984, gave the following equation.          1 2 ) ( 4 1 ) ( 4 2 ) / )( ( 1 2 1 2 H H I H I H q H H H H av z  (10)
  • 40. WESTERGAARD'S METHOD:  Boussinesq’s equation has been developed for homogenous soil.  Sedimentary soil deposits are generally stratified and anisotropic.  They commonly have alternating layers of sandy and silt/clay soil. For such conditions Westergaard’s (1938) presented an equation for subsurface stresses. Fig: (a) Assumed soil model for development of equation
  • 41. 2 / 3 2 2 ] ) / ( ) 2 2 /( ) 2 1 [ 2 ) 2 2 /( ) 2 1 ( z r z p z             2 / 3 2 2 ] ) / ( [ 2 ) ( z r a z a p z     1 or 2 Where z = vertical stress at depth z p = concentrated load  = Poisson's ratio (ratio of the strain in a direction normal to an applied stress to the strain parallel to the applied stress) z = depth r = horizontal distance from point of application of p to point at which q is desired a = (1-2)/(2-2) If Poisson's ratio is taken to be zero, Eq. (1) changes to 3 2 / 3 2 2 ] ) / ( 2 1 [( z r z p z    
  • 42. COMPARISON OF WESTERGAARD'S AND BOUSSINESQ’S EQUATIONS Sr. No. WESTERGAARD'S EQUATION BOUSSINESQ’S EQUATION 1 The equation gives the stress as a function of depth (z) below the point of application of load and the horizontal distance (r) from the load axis. The equation also gives the stress as a function of depth (z) below the point of application of load and the horizontal distance (r) from the load axis.
  • 43. Sr. No. WESTERGAARD'S EQUATION BOUSSINESQ’S EQUATION 2 For low r/z ratio the Westergaard’s equation gives lower values of stress as compared to Boussinesq’s equation, when () is assumed to be zero. Using higher poisson’s ratio (  0.3), Westergaard’s values of stress are higher than Boussinesq’s values. For low r/z ratio the Boussinesq’s equation gives higher values of stress as compared to Westergaard’s equation.
  • 44. Sr. No. WESTERGAARD'S EQUATION BOUSSINESQ’S EQUATION 3 Westergaard’s equation is based on alternating thin layers of elastic material between layers of inelastic material. Boussinesq’s equation is developed for homogenous material. 4 Westergaard’s equation includes poisson’s ratio (). For Boussinesq’s equation () is taken as zero. 5 Westergaard’s equation is not widely used. For most practical problems in geotechnical engineering, Boussinesq’s equation is preferred.
  • 45. APPROXIMATE METHOD  The method assumes that the area affected by applied load gradually increases with depth.  Although the method is not accurate, yet it is used to estimate the stress for preliminary design.  Some of the assumptions made for the distribution of load with depth are given below: 1. The area of stress spreads with 2:1 slope as shown in the figure.3 2. The area of stress spreads within lines making an angle of 300 with the vertical
  • 46. Fig: 11 Stress distribution with 2:1 slope, (dotted lines indicate distribution of stress at 300 angle)
  • 47. ) )( ( z L z B p z     4 5 Where z = Stress at depth z P = Applied load B = Width L = Length z = Depth Comparison of the two equations indicates that the application of first equation is quite simple. ) 30 tan 2 )( 30 tan 2 ( z L z B p z    
  • 48. NEWMARK’S INFLUENCE CHART The Boussinesq’s and Westergaard’s theories have been developed for point loads. Newmark developed chart based on Boussinesq’s equation for the determination of stress under the centre of a circular loaded area. Consider a circular foundation subjected to loading as in the figure.
  • 49. Foundation area = A, Radius of the area = R, Uniformly distributed applied load per unit area.= 0 The total load P can be written as, A A d P 0 0   
  • 50. Consider an elementary area dA, within the loaded area as shown in figure. The load dp on this elementary area can be written as, dp = 0 dA =0 (r d dr) Where dA = r d dr This load dp can be considered as a point load. The stress at point O caused by this load, can be determined by using Boussinesq’s eq. 2 / 5 2 2 1 2 3                 z r z d d p z   Putting the value of dp in the above equation
  • 51. 2 / 5 2 2 0 1 2 ) ( 3                 z r z dr rd d z     Thus the total stress caused by the entire loaded area A can be obtained by integration of the above equation, or 2 / 5 2 2 0 1 2 ) ( 3                 z r z dr rd d z     Where 0 = load per unit area on the foundation or the contact stress. dr d r r R z ) (z z 2 3 2 / 5 2 2 3 0 2 0 0         
  • 52.                  2 / 3 2 0 ) / ( 1 1 1 z R z                    2 / 3 2 0 ) / ( 1 1 1 z R z   The above equation can be rewritten as follows: After integration and simplifying we get as follows 2 / 1 3 / 2 0 1 1                    z z R
  • 53. Table: Values of R/z for various values of σz /0 σz /0 R/z 0 0.1 0.2 0.3 0.4 0.5 0.6 0.7 0.8 0.9 1.0 0 0.2698 0.4005 0.5181 0.6370 0.7664 0.9174 1.1097 1.3871 1.9084 ∞
  • 54. Concentric circles can be drawn using non-dimensional values of R/z as shown in figure below. These circles have been divided by suitable number of equally spaced radial lines to form orthogonal mesh. This is referred as the Newmark’s chart. chart on the meshes of number 1   IV value e Influenc rays of number x circles of number 1   IV value e Influenc
  • 55. For the Influence Chart shown in the figure, Iv = 1/10x20 = 1/200 = 0.005 z = (Iv)(n)(0 ) Figure: Newmark’s influence chart for computing vertical pressure.
  • 56.
  • 57.
  • 58.
  • 59. Find the intensity of vertical pressure at 10’ of a square footing having dimensions 10’x10’ and a load of 2 T/ft2 act on the footing. Find vertical pressure at centre of footing? Solution. 1. Boussinesq Equation We have to find vertical pressure at center of footing of dimensions 10’x10’ at 10’ depth. i.e z = 10 ft we consider the footing as a whole i.e. footing app A P    T 200 100 2    0  r according to Boussinesq Equation 2 / 5 2 2 2 2 1 2 3          r Z P z   By putting values   2 / 5 2 1 2 3 10 200     Z 2 T/ft 955 . 0  10-ft 10-ft 2 T/ft2 200 T
  • 60. 2. Distributing the load on 4-areas (each 5’ x 5’) Now we have to find vertical stress at center of footing of dimensions 10’x10’ at 10’ depth. i.e z = 10 ft but considering the 4 loads as shown, it is more close to realistic situation 1.a. Boussinesq’s Equation footing app A P    1 T 50 5 5 2     5355 . 3 5 . 2 5 . 2 2 2    r according to the Equation stress due to one load 2 / 5 2 2 2 1 2 3          Z r Z P z   By putting values   2 / 5 2 125 . 1 2 3 10 50     Z 2 T/ft 178 . 0  5’ 5’ 50 T 50 T 50 T 2 T/ft2 5’ 5’ r 50 T Stress due to four loads 2 T/ft 0.712 4 178 . 0    The true stress will be determined by considering 100 loads each of 2-tons applied on 1-square foot area.
  • 61. 3. Westergaard’s Equation     2 / 3 2 2 / 2 1 Z z r P z     where T 200 10 2 2      A P  ft Z 10  0  r By putting values     2 2 / 3 2 2 T/ft 637 . 0 0 2 1 10 200     Z
  • 62. The method is applicable to find stress under the corner of a loaded area. Footing is divided into 4 small square footings of 5’ x 5’. The centre of the actual footing under which the stress is required becomes the corner of the area of 5 x5. The relation for finding stress at centre of given footing is given by 4. Stress due to uniformly loaded rectangular area. 5’ 5’ 2 T/ft2 5’ 5’ 2 T/ft2 2 T/ft2 2 T/ft2
  • 63.     3 0 0 2 / 5 2 2 2 3 2 2 . 3 qI z y x dy dx qz d B r L x z              where                                        1 1 2 tan 1 1 1 1 2 4 1 2 2 2 2 2 2 1 2 2 2 2 2 2 2 2 2 2 3 n m n m n m mn n m n m n m n m n m mn x I As given footing has same length L and B. So   3 ) 4 ( 3 ) 3 ( 3 ) 2 ( 3 ) 1 ( 3 4 or Z L n and qI I I I I q Z B m Z         5 . 0 10 5    n m Therefore from graph of I3 with m and n, we have I3 = 0.084 2 10 T/ft 672 . 0 084 . 0 2 4 ' '       I3 can be determined from the above equation, but it is very laborious, It can be easily found by the graph or table on next pages
  • 64. Fig: Variation of I3 with m and n
  • 65.
  • 66. 5. NEWMARK’S INFLUENCE CHART. 005 . 0 20 10 1 Rays of No. circles of No. 1 IV Value Influence       66 n footing given for meshes of .   No 2 0 T/ft 66 . 0 2 66 005 . 0 ) )( )( 1 (        n V z
  • 67. 6. APPROXIMATE METHOD ) )( ( z L z B p z     2 / 5 . 0 ) 10 10 )( 10 10 ( 200 ft T z     
  • 68. Result:- 2 T/ft 995 . 0 Method Boussinesq From - 1  z  2 T/ft 637 . 0 Equation rds Westergaa From - 3  z  2 T/ft 50 . 0 Analysis e Approximat From - 4  z  2 T/ft 66 . 0 Chart Influence Newmarks From - 5  z  2 T/ft 712 . 0 loads 4 using Method, Boussinesq From - 2  z  2 3 T/ft 672 . 0 , I factor influence From - 3  z 
  • 69. Determine vertical soil pressure under footing 2 to 1 method Assume stresses distributes in a 2 to 1 slope under footing. Vertical stress at a depth z under a rectangular footing is p= P /[(B+Z)(L+Z) [1.17]
  • 70. Example 10: Determine vertical soil pressure using 2:1 method Given: Footing: 8 feet x 4 feet rectangular footing Column load = 25 kips Requirement: Determine vertical soil pressure at 6’ below bottom of footing Solution: q =P /[(B+Z)(L+Z)] = 25000 / [(8+6)(4+6)] = 178.6 lbs/ft2 . Newmark’s influence chart Boussinesq equation Newmark’s influence chart is developed from Boussinesq’s equation. Boussinesq’s equation considers a point load on a semi- infinite, homogeneous, isotropic, weightless, elastic half-space as shown below
  • 71. By integrating Boussineq’s equation over a circular area of radius R, one obtains a relationship between P/P and R/D as P/P = 1-{1/[1+(R/D)2 ]3/2 } [1.18] Newmark’s chart is constructed by rewriting Equation 1.18 as R/D = [(1-P/P)-2/3 -1]1/2 [1.19] Or P/P 0.1 0.2 0.3 0.4 0.5 0.6 0.7 0.8 0.9 1.0 R/D 0.27 0.40 0.52 0.64 0.77 0.92 1.1 1.39 1.91  In Newmark’s chart, if the length of one unit equals to D, then the radius of the ring is equal to R. The area inside each circle is the ratio of P/P. The area inside the first inside circle is 0.1, and the area inside the second circle is 0.2, etc. To be able to measure the area inside the circle, the area is divided in to a number of pieces. Each piece between the circle and radical lines is a unit. The number of units multiplied by an influence value should be equal to the ratio of P/P of the circle. Therefore, P=P I N
  • 72. Where, I is an influence of Newmark’s chart and N is the number of units inside the circle. For the chart shown below, there are 200 pieces in the total area. Then, the influence value of the chart is 1/200= 0.005. Therefore, the ratio of P/P for the first circle is 20 units x 0.005 = 0.1. Although, the chart is developed based on circular area, it can be extended to other shape of footing by placing a scaled footing area on top of the chart.
  • 73. Example 11: Determine vertical soil pressure using Newmark’s chart Given: Footing: 6 feet square footing Column load = 25 kips including weight of footing Requirement: Determine vertical soil pressure at 6’ below bottom of footing at center of footing and at a corner of the footing Solution: The footing is draw to scale according to a depth of 6’. Square #1 is placed on the chart with center of the footing at the center of circle. Square #2 is placed on the chart with corner of footing at the center of the circle.
  • 74. Pressure at the bottom of footing, P = 25000/36=694 lbs/ft2. The influence value of the chart is 0.005 The number of unit inside Square #1 is about 68. The vertical at 6’ below the center of the footing P = 694*0.005*68 =236 lbs/ft2. The number of unit inside Square #2 is about 35. The vertical at 6’ below the corner of the footing P = 694*0.005*35 =121 lbs/ft2.