More Related Content
Similar to 2 time based animation 2020 linked in (20)
2 time based animation 2020 linked in
- 1. - Negative Non Value Adding Activity
+ Positive Value Adding Activity
Supply Chain Inputs Value Adding Operations
Costs of Adding Value
Overhead and Non Value Adding Costs
Accumulated
Total Amount of Throughput Time Consumed
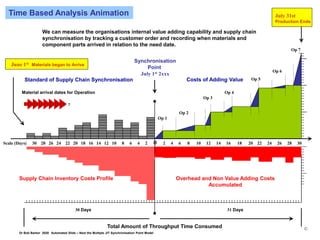
Time Based Analysis Animation
Standard of Supply Chain Synchronisation
Supply Chain Inventory Costs Profile
We can measure the organisations internal value adding capability and supply chain
synchronisation by tracking a customer order and recording when materials and
component parts arrived in relation to the need date.
June 1st Materials began to Arrive
Synchronisation
Point
July 1st 2xxx
Dr Bob Barker 2020
July 31st
Production Ends
30 Days 31 Days
Automated Slide – Next the Multiple JIT Synchronisation Point Model
Op 1
Op 2
Op 3
Op 4
Op 5
Op 6
Op 7
Material arrival dates for Operation
1 2 3 4 5 6 7
Scale (Days) 30 28 26 24 22 20 18 16 14 12 10 8 6 4 2 0 2 4 6 8 10 12 14 16 18 20 22 24 26 28 30
©
- 2. - Negative Non Value Adding Activity
+ Positive Value Adding Activity
Supply Chain Inputs =
Value Adding Operations
Costs of Adding Value
Overhead and Non Value Adding Costs
Accumulated
Total Amount of Throughput Time Consumed
Time Based Analysis – JIT
We can measure the organisations internal
value adding capability and supply chain
synchronisation by tracking a customer
order and recording when materials and
component parts arrived in relation to the
time needed in Auto and Aerospace production
plants.
June 1st Materials began to Arrive
Dr Bob Barker 2020
Production Ends
15 Hours
Automated Slide – Click Slide Show to Start
Op 1
Op 2
Op 3
Op 4
Op 5
Op 6
Op 7
Material arrival dates for Operation
1 2 3 4 5 6 7
Scale (Hours) 4 3 2 1 0 1 2 3 4 5 6 7 8 9 10 11
Multiple Synchronisation Points
©