DEMONSTRATION LESSON IN ENGLISH 4 MATATAG CURRICULUM
Interpretation new
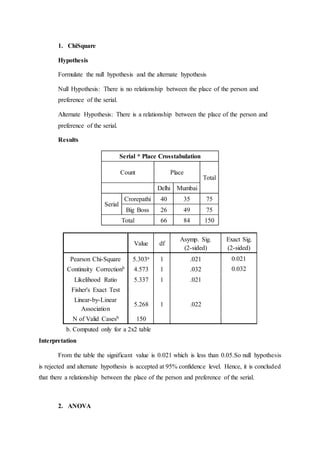
1. 1. ChiSquare
Hypothesis
Formulate the null hypothesis and the alternate hypothesis
Null Hypothesis: There is no relationship between the place of the person and
preference of the serial.
Alternate Hypothesis: There is a relationship between the place of the person and
preference of the serial.
Results
Serial * Place Crosstabulation
Count Place
Total
Delhi Mumbai
Serial
Crorepathi 40 35 75
Big Boss 26 49 75
Total 66 84 150
Value df
Asymp. Sig.
(2-sided)
Exact Sig.
(2-sided)
Pearson Chi-Square 5.303a 1 .021 0.021
Continuity Correctionb 4.573 1 .032 0.032
Likelihood Ratio 5.337 1 .021
Fisher's Exact Test
Linear-by-Linear
Association
5.268 1 .022
N of Valid Casesb 150
b. Computed only for a 2x2 table
Interpretation
From the table the significant value is 0.021 which is less than 0.05.So null hypothesis
is rejected and alternate hypothesis is accepted at 95% confidence level. Hence, it is concluded
that there a relationship between the place of the person and preference of the serial.
2. ANOVA
2. Hypothesis
Null hypothesis: There is no significant difference in scores between different metro
Cities of India.
Alternate hypothesis: There is significant difference in scores between differentmetro cities of
India.
Result
ANOVA
Scores of CBSE Students
Sum of Squares df Mean Square F Sig.
Between Groups 4872.200 3 1624.067 .358 .784
Within Groups 163522.200 36 4542.283
Total 168394.400 39
Interpretation
From the table, the significant value is 0.784 which is greater than 0.05. So null
hypothesis is accepted at 95% confidence level .Hence, it is concluded that there is no
significant difference in scores between different metro cities of India.
3. Correlation
Hypothesis
Null Hypothesis: There is no correlation between the scores of CET and percentage achieved
in graduation.
Alternate Hypothesis: There is a correlation between the scores of CET and percentage
achieved in graduation.
Result
3. Correlations
CET Scores
percentage in
UG Degree
CET Scores
Pearson
Correlation
1 .539*
Sig. (2-tailed) .038
N 15 15
Percentage in UG
Degree
Pearson
Correlation
.539* 1
Sig. (2-tailed) .038
N 15 15
*. Correlation is significant at the 0.05 level (2-tailed).
Interpretation
From the table, the significant value is 0.038 which is less than 0.05. Since, the null
hypothesis is rejected and alternate hypothesis is accepted. Hence it is concluded that there is
a correlation between the scores of CET and percentage achieved in graduation. The correlation
co-efficient of 0.539 shows that there is a moderate positive correlation between two variables.
4. Meanscore Analysis
Table 1: Opinion of employee about course Evaluation –
Mean analysis and Rank scores
Course Evaluation variables Mean Rank
E-learning content, learning outcomes, activities,
assessments well-aligned with organization quality
standards
4.38 I
Regular expert evaluation of the e-learning course to be
needed to ensure its objectives are defended
4.03 III
it’s important to give learners an outline of tasks /
activities to be carried out
4.13 II
It can be inferred from the Table 1 that the mean is high for “E-learning content, learning
outcomes, activities, assessments well-aligned with organization quality standards” with a
score of 4.38 followed by the variable “it’s important to give learners an outline of tasks /
4. activities to be carried out” with a mean value of 4.13. This indicates that the employees agree
that alignment of E-Learning with quality standards and prior.
Note:
All the tests, compare the significance value with 0.05. If the significance value is less than
0.05, Accept Alternate hypothesis. If the significance value is greater than 0.05, Accept Null
hypothesis.