SlideShare a Scribd company logo
1 of 15
CHAPTER 9: USER’S SATISFACTION: INTERPRETING THE
RESULTS
9.0 Introduction
This chapter describes the statistical relationships between two variables using chi-square
test techniques. The objectives are to find out whether or not any of the following attributes
have significance influence on users’ perceptions towards several satisfaction conditions. Is
there any relationship between the following attributes with satisfaction level towards certain
elements?
 Gender and Satisfaction
 Ethnic group and Satisfaction
 Job category and satisfaction
 Number of colleague working at the same room and satisfaction
 Zone level and satisfaction
9.1 Reliability test
Reliability analysis was used to study the properties of measurement scales and the items
that make them up. The Reliability Analysis procedure calculates a number of commonly
used measures of scale reliability and also provides information about the relationships
between individual items in the scale. Coefficient alpha measures internal consistency
reliability among a group of items combined to form a single scale as described in chapter 4.
In this study the alpha value was calculated by the software (SPSS Version 14) as 0.944.
Table 9.1 shows the internal consistency reliability test result. Levels of 0.70 or more are
generally accepted as representing good reliability. The closer alpha value to 1, the more
reliability the survey equipment (questionnaire) is. In other words the questionnaire used in
this study to determine users’ satisfaction is considered highly reliable.
Table 9.1: Internal consistency reliability test
Case Processing Summary N %
Cases
Valid 155 96.9
Excluded(a) 5 3.1
Total 160 100.0
Reliability Statistics
Cronbach's Alpha N of Items
0.944 91
Scale Statistics
Mean Variance Std. Deviation N of Items
310.32 1,242.140 35.244 91
9.2 Chi-Square Test
Test of statistical significance: Chi Square
After having produced a considerable number of contingency tables and selected the ones
that appeared to show a pattern of relationship between satisfaction and the variable being
tested, an important question remained, which is whether the pattern that emerged was due to
chance fluctuation or whether it could be considered as a reliable finding. Chi Square is a
way to measure the significance of an association between two variables. It tests whether the
null hypothesis is true or false, that is whether the two variables examined in a contingency
table are independent of each other in the population as mentioned in chapter 4. If the null
hypothesis is in fact not true, then the sample association reflects some actual degree of
association in the population. From the Chi square value a ‘p value’ is worked out in order to
estimate whether the relationship between two variables is statistically significant or not. It is
the generally accepted convention that a null hypothesis is not rejected unless there is less
than 5% chance that it is in fact true, that is p <0.05. The significance level p varies from
0.10 to 0.001. In the present study the null hypothesis is rejected at a p value smaller than
5%. Another way of saying this is that a null hypothesis will not be rejected unless there is at
least 95% chance that it is false.
However, a relationship between two variables can be significant in statistical terms without
being either strong or important. Chi Square is not useful as a measure of the magnitude of
an association. A significant result means only that the relationship in the population is
unlikely to be zero. For nominal and ordinal data, coefficients measuring the strength of an
association between two variables are derived from the Chi Square value. The measure of
association used in the present study is described below.
The Contingency coefficient
The contingency coefficient C is a long established and widely used index of relationship
where larger than 2x2 tables are involved. The contingency coefficient C is derived from the
Chi square and measures the strength of an association in two variables. Its value ranges
between 0 and 1 but can never reach the value of 1. The nearer to 1 the C coefficient, the
closer the association is between the two considered variables. In this study most variable are
tested (as shown in appendix 6) but after a lengthy process of testing, examination and re-
testing, a small number of tables were finally selected for discussion. Some of the variables
are discussed in previous chapters and some are discussed in the next sections. The selection
was made on the basis of the significance level (p < 0.05) as well as the magnitude of the
relationship (C Value) between the variable measuring one of the attributes of the building
environment and the two records of the expressed satisfaction. The variables that have been
found related to respondents’ satisfaction are presented in the next sections according to
whether they have been found associated with both records of satisfaction and according to
the strength of their relationship to satisfaction.
9.2.1 Gender and Satisfaction
This section presents cross tabulation between gender and satisfaction level towards all
architectural and environmental elements. The aim is to find significant relationships
between gender and satisfaction level for several elements.
Table 9.2: Cross tabulation between gender and satisfaction
Aspect Item Chi-square
Asymptotic
significance
(2-sided)
Significance Interpretation
a. Satisfaction with the window
available in office
χ2
= 13.68 p = 0.033 p < 0.05
Weak
Association
b. Difficulty to open/close windows at
office room
χ2
= 18.85 p = 0.009 p < 0.05
Strong
Association
c. Satisfaction with thermal condition
in the office
χ2
= 14.13 p = 0.015 p < 0.05
Strong
Association
Gender
BUILDING UMNO MESINIAGA IBM KOMTAR TIMA LUTH TOTAL
male 8 11 11 12 10 10 62
female 10 13 9 29 23 14 98
TOTAL 18 24 20 41 33 24 160
0
5
10
15
20
25
30
35
UMNO MESINIAGA IBM KOMTAR TIMA LUTH
male
female
The chi-square value and asymptotic significance (2-sided) for cross tabulation between
gender and satisfaction with the availability of a window in the office is (χ2
= 13.68, p =
0.033). There is a weak association between gender and satisfaction with the availability of a
window in the office (p < 0.05). The relationship between two variables is statistically
significant (see table 9.2) which means it does not happen by chance and therefore the null
hypothesis is rejected. Table 9.3 shows that male respondents have higher satisfaction levels
towards the window available in their office than the female. More than 50% of male
respondents are satisfied to highly satisfy whereas only around 42% females are. 80% of all
respondents rated the windows as quite difficult to very difficult to close/open. 50% of the
female respondents rated it as quite difficult to very difficult (see table 9.4).
Table 9.3: Satisfaction towards window available in the office and gender (cross tabulation)
Satisfaction Male Female Total
highly dissatisfied 3.2% 1.3%
very dissatisfied 4.8% 4.1% 4.4%
dissatisfied 4.8% 12.2% 9.4%
neutral 32.3% 38.8% 36.3%
satisfied 41.9% 36.7% 38.8%
very satisfied 11.3% 2.0% 5.6%
highly satisfied 1.6% 6.1% 4.4%
Total 100.0% 100.0% 100.0%
Table 9.4: Difficulty to open/close window in the office and gender (cross tabulation)
Satisfaction Male Female Total
no info 6.1% 3.8%
very difficult 17.7% 20.4% 19.4%
difficult 9.7% 10.2% 10.0%
quite difficult 3.2% 19.4% 13.1%
normal 45.2% 30.6% 36.3%
quite easy 8.1% 2.0% 4.4%
easy 9.7% 9.2% 9.4%
very easy 6.5% 2.0% 3.8%
Total 100.0% 100.0% 100.0%
Table 9.5: Gender and satisfaction towards thermal condition in the office (cross tabulation)
Satisfaction Male Female Total
highly dissatisfied 1.0% 0.6%
dissatisfied 3.2% 21.4% 14.4%
neutral 37.1% 22.4% 28.1%
satisfied 54.8% 46.9% 50.0%
very satisfied 4.8% 6.1% 5.6%
highly satisfied 2.0% 1.3%
Total 100.0% 100.0% 100.0%
There is also a strong association between gender and difficulty to open/close windows at
office room (χ2
= 18.85, p = 0.009). Since p < 0.05, the relationships between two variables
are statistically significant and do not happen by chance the null hypothesis is rejected. The
chi-square value and asymptotic significance (2-sided) for cross tabulation between gender
and satisfaction with thermal condition in the office is (χ2
= 14.13, p = 0.015). There is a
strong association (p < 0.05) between gender and satisfaction towards thermal condition in
the office. With regard to thermal condition satisfaction, female respondents have lower
satisfaction level than the males where around 22% of them are dissatisfied with the thermal
condition in their office (see figure 9.5).
9.2.2 Ethnic Group and Satisfaction
The cross tabulations between ethnic group and satisfaction for several features show there
are strong relationships between ethnic group and satisfaction with the natural and artificial
lighting in the office, natural ventilation in the office and the overall building maintenance.
The cross tabulations also show that ethnic group and satisfaction with the window in the
office, overall lift services and overall housekeeping in the building have weak relationships
The chi-square test for those cross tabulations are shown in table 9.6. Since the p value for
the cross tabulations is less than 0.05, it can be said that the relationships between those
variables are statistically significant and do not happen by chance.
Table 9.6: Chi-square tests for ethnic group & satisfaction
Aspect Item Chi-square
Asymptotic
significance
(2-sided)
Significance Interpretation
Satisfaction with the natural lighting in
the office
χ2
= 59.09 p = 0.000 p < 0.05
Strong
Association
Satisfaction with the artificial lighting
in the office
χ2
= 38.74 p = 0.001 p < 0.05
Strong
Association
Satisfaction with the natural
ventilation in the office
χ2
= 67.21 p = 0.000 p < 0.05
Strong
Association
Satisfaction with the building
maintenance
χ2
= 30.98 p = 0.009 p < 0.05
Strong
Association
Satisfaction with the window available
in your office
χ2
= 31.52 p = 0.025 p < 0.05
Weak
Association
Satisfaction with the overall lift
services in the building
χ2
= 31.01 p = 0.029 P < 0.05
Weak
Association
Satisfaction with the overall
housekeeping in the building
χ2
= 26.06 p = 0.037 p < 0.05
Weak
Association
Ethnic group
BUILDING UMNO MESINIAGA IBM KOMTAR TIMA LUTH TOTAL
Malay 7 20 5 39 31 24 126
Chinese 8 1 4 0 1 0 14
Indian 2 2 11 2 0 0 17
others 1 1 0 0 1 0 3
TOTAL 18 24 20 41 33 24 160
0
5
10
15
20
25
30
35
40
45
UMNO MESINIAGA IBM KOMTAR TIMA LUTH
Malay
Chinese
Indian
others
Table 9.7: Cross tabulation between ethnic group & satisfaction with the natural lighting
available in office
Malay Chinese Indian others Total
no info 1.6% 1.3%
dissatisfied 9.5% 7.1% 17.6% 33.3% 10.6%
neutral 33.3% 42.9% 23.5% 33.3% 33.1%
satisfied 43.7% 35.7% 52.9% 43.1%
very satisfied 11.9% 14.3% 5.9% 11.3%
highly satisfied 33.3% .6%
Total 100.0% 100.0% 100.0% 100.0% 100.0%
Table 9.8: Cross tabulation between ethnic group & satisfaction with the artificial lighting
available in the office
Malay Chinese Indian others Total
highly dissatisfied 1.6% 7.1% 1.9%
dissatisfied 3.2% 2.5%
neutral 18.3% 14.3% 64.7% 33.3% 23.1%
satisfied 68.3% 64.3% 23.5% 61.9%
very satisfied 6.3% 14.3% 11.8% 66.7% 8.8%
highly satisfied 2.4% 1.9%
Total 100.0% 100.0% 100.0% 100.0% 100.0%
There are no major differences between Malay, Chinese and Indians in terms of satisfaction
towards the natural lighting in the office. About half of the respondents in each ethnic group
are satisfied to very satisfied (see table 9.7) with the natural lighting available in the office.
However, when it comes to artificial lighting, the Indian respondents are quite neutral (see
table 9.8) whereas the Malay and Chinese are highly satisfied where more than 70% of the
respondents in each group being satisfied to highly satisfied. In terms of the natural
ventilation available in the office, the Indian respondents are much more satisfied than the
Malay and the Chinese respondents (see table 9.9).
The Chinese respondents rated their satisfaction with the available window in the office
higher than the Malay and the Indian respondents (see table 9.10). The Chinese respondents
are more satisfied than the Malay and the Indian respondents in terms of the overall
maintenance in the building where more than 60% of the Chinese respondents rated it as
satisfied to very satisfied (table 9.11). The Chinese also gave higher satisfaction levels as
compared to the Malays and Indians for the overall house keeping in the building as shown
in table 9.12. The Malay respondents are more satisfied than the Chinese and the Indian
respondents in terms of the overall lift service in the building where 40% of them rated it as
satisfied to highly satisfied (see table 9.13).
Table 9.9: Cross tabulation between ethnic group & satisfaction with the natural ventilation
available in the office
Malay Chinese Indian others Total
no info 0.8% 0.6%
highly dissatisfied 0.8% 0.6%
very dissatisfied 3.2% 7.1% 3.1%
dissatisfied 23.2% 14.3% 5.9% 20.1%
neutral 25.6% 57.1% 41.2% 33.3% 30.2%
satisfied 40.0% 21.4% 35.3% 33.3% 37.7%
very satisfied 6.4% 17.6% 6.9%
highly satisfied 33.3% .6%
Total 100.0% 100.0% 100.0% 100.0% 100.0%
Table 9.10: Cross tabulation ethnic group & satisfaction with the window in the office
Malay Chinese Indian others Total
highly dissatisfied 0.8% 5.9% 1.3%
very dissatisfied 4.0% 7.1% 5.9% 4.4%
dissatisfied 7.1% 21.4% 5.9% 66.7% 9.4%
neutral 38.9% 14.3% 41.2% 36.3%
satisfied 39.7% 42.9% 35.3% 38.8%
very satisfied 5.6% 14.3% 5.6%
highly satisfied 4.0% 5.9% 33.3% 4.4%
Total 100.0% 100.0% 100.0% 100.0% 100.0%
Table 9.11: Cross tabulation between ethnic group & satisfaction with the overall
maintenance in the building
Malay Chinese Indian others Total
highly dissatisfied 1.6% 1.3%
dissatisfied 7.1% 5.9% 6.3%
neutral 45.2% 35.7% 41.2% 33.3% 43.8%
satisfied 37.3% 57.1% 52.9% 33.3% 40.6%
very satisfied 7.9% 7.1% 6.9%
highly satisfied 0.8% 33.3% 1.3%
Total 100.0% 100.0% 100.0% 100.0% 100.0%
Table 9.12: Cross tabulation between ethnic group & satisfaction with the overall
housekeeping in the building
Malay Chinese Indian others Total
very dissatisfied 0.8% 0.6%
dissatisfied 10.3% 5.9% 8.8%
neutral 37.3% 21.4% 47.1% 36.3%
satisfied 46.8% 71.4% 35.3% 66.7% 48.1%
very satisfied 4.0% 7.1% 5.9% 4.4%
highly satisfied 0.8% 5.9% 33.3% 1.9%
Total 100.0% 100.0% 100.0% 100.0% 100.0%
Table 9.13: Cross tabulation ethnic group & satisfaction with the overall lift services in the
building
Malay Chinese Indian others Total
highly dissatisfied 12.7% 5.9% 10.6%
very dissatisfied 5.6% 7.1% 5.0%
dissatisfied 15.1% 57.1% 11.8% 33.3% 18.8%
neutral 25.4% 21.4% 58.8% 28.1%
satisfied 32.5% 14.3% 23.5% 33.3% 30.0%
very satisfied 7.9% 33.3% 6.9%
highly satisfied 0.8% 0.6%
Total 100.0% 100.0% 100.0% 100.0% 100.0%
9.2.3 Job Category and Satisfaction
Table 9.14 shows that administrators are highly satisfied with the natural lighting available
in the office. However, the chi-square value and asymptotic significance (2-sided) for cross
tabulation between job category and satisfaction towards the natural lighting available in
office is (χ2
= 28.57, p = 0.097). Since the p value for both cross tabulation is more than 0.05,
the relationships between those variables are statistically not significant and might happen by
chance (see table 9.15).
Table 9.14: Cross tabulation between job category & natural lighting in the office
Satisfaction Administrative Management Executive Secretarial Technical Total
no info 5.4% 1.3%
dissatisfied 5.6% 27.3% 20.0% 13.5% 7.0% 10.6%
neutral 24.1% 18.2% 40.0% 40.5% 39.5% 33.1%
satisfied 59.3% 27.3% 33.3% 29.7% 41.9% 43.1%
very satisfied 11.1% 27.3% 6.7% 8.1% 11.6% 11.3%
highly satisfied 2.7% 0.6%
Total 100.0% 100.0% 100.0% 100.0% 100.0% 100.0%
Table 9.15: Cross tabulation between job category and satisfaction
Aspect Item Chi-square
Asymptotic
significance
(2-sided)
Significance Interpretation
a. Satisfaction towards the natural
lighting level in the office.
χ2
= 28.57; p = 0.097. p > 0.05 No Association
b. Satisfaction towards the thermal
condition in the office.
χ2
= 23.14; p = 0.282 p > 0.05 No Association
c. Satisfaction towards the natural
ventilation available in the office.
χ2
= 42.49; p = 0.039 p < 0.05
Weak
Association
d. Satisfaction towards the noise
level in the office.
χ2
= 38.64; p = 0.001. p < 0.05
Strong
Association
Job descriptions
BUILDING UMNO MESINIAGA IBM KOMTAR TIMA LUTH TOTAL
administrative 8 7 8 17 6 8 54
management 0 4 1 0 4 2 11
executive 3 7 3 1 0 1 15
secretarial 2 2 1 19 3 10 37
technical 5 4 7 4 20 3 43
TOTAL 18 24 20 41 33 24 160
0
5
10
15
20
25
UMNO MESINIAGA IBM KOMTAR TIMA LUTH
administrative
management
executive
secretarial
technical
Respondents with technical background are highly satisfied with the thermal condition in the
office (see table 9.16). The chi-square value and asymptotic significance (2-sided) for cross
tabulation between job category and satisfaction towards the thermal condition in the office
is (χ2
= 23.14, p = 0.282). Again the p value for both cross tabulation is more than 0.05 (see
table 9.15). The relationships between those variables are statistically not significant and
might happen by chance.
Table 9.17 shows that administrators are highly satisfied with the natural ventilation
available in the office. There is a weak association between job category and satisfaction
with the natural ventilation available in office (χ2
= 42.49, p = 0.039) and between job
category and level of happiness working in the building (χ2
= 26.31, p = 0.010). The p value
is less than 0.05 (see table 9.15) for both cross tabulations and therefore the null hypothesis
is rejected.
Table 9.16: Cross tabulation between job category & thermal condition in the office
Satisfaction Administrative Management Executive Secretarial Technical Total
highly dissatisfied 2.3% 0.6%
dissatisfied 16.7% 9.1% 6.7% 24.3% 7.0% 14.4%
neutral 33.3% 45.5% 33.3% 21.6% 20.9% 28.1%
satisfied 46.3% 27.3% 46.7% 45.9% 65.1% 50.0%
very satisfied 1.9% 18.2% 13.3% 8.1% 2.3% 5.6%
highly satisfied 1.9% 2.3% 1.3%
Total 100.0% 100.0% 100.0% 100.0% 100.0% 100.0%
Table 9.17: Cross tabulation between job category & natural ventilation in the office
Satisfaction Administrative Management Executive Secretarial Technical Total
no info 2.8% 0.6%
highly dissatisfied 2.3% 0.6%
very dissatisfied 8.3% 4.7% 3.1%
dissatisfied 3.7% 36.4% 20.0% 38.9% 20.9% 20.1%
neutral 37.0% 18.2% 46.7% 13.9% 32.6% 30.2%
satisfied 51.9% 36.4% 33.3% 27.8% 30.2% 37.7%
very satisfied 7.4% 9.1% 5.6% 9.3% 6.9%
highly satisfied 2.8% 0.6%
Total 100.0% 100.0% 100.0% 100.0% 100.0% 100.0%
Table 9.18: Cross tabulation between job category & noise level in the office
Satisfaction Administrative Management Executive Secretarial Technical Total
dissatisfied 7.4% 2.7% 4.7% 4.4%
neutral 25.9% 54.5% 20.0% 59.5% 27.9% 35.6%
satisfied 64.8% 36.4% 66.7% 18.9% 58.1% 50.6%
very satisfied 1.9% 9.1% 6.7% 18.9% 4.7% 7.5%
highly satisfied 6.7% 4.7% 1.9%
Total 100.0% 100.0% 100.0% 100.0% 100.0% 100.0%
Executive are among the most satisfied respondents towards the noise level in the office as
shown in table 9.18. Strong associations were found between job category and satisfaction
with the noise level in office (χ2
= 38.64, p = 0.001). The test is significant since p is far less
than 0.05 and the null hypothesis are therefore rejected for this cross tabulation. The
relationships between these variables are statistically significant and do not happen by
chance (see table 9.15).
9.2.4 Number of Colleague and Satisfaction
This section presents chi-square test result for cross tabulation between number of colleagues
working in the same room and satisfaction levels towards several architectural and
environmental features asked in the questionnaires. The aim is to find a significant
relationship between number of colleague and satisfaction level for all elements. Several
satisfaction elements (table 9.19) were found to have a significant relationship with number
of colleagues working in the same room.
Table 9.19: Cross tabulation between number of colleague in the same room and satisfaction
Aspect Item Chi-square
Asymptotic
significance
(2-sided)
Significance Interpretation
a. Satisfaction with thermal
condition in the office
χ2
= 60.14 p = 0.001 p < 0.05
Strong
Association
b. Satisfaction level with the overall
lift services in building
χ2
= 68.72 p = 0.001. p < 0.05
Strong
Association
c. Satisfaction towards the public
area spaces in the building
χ2
= 56.33 p = 0.017 p < 0.05
Weak
Association
d. Level of happiness working in the
building
χ2
= 34.75 p = 0.010. p < 0.05
Weak
Association
Table 9.20, shows that respondents with more colleagues working in the same area are quite
dissatisfied with the thermal condition in the office. The chi-square value and asymptotic
significance (χ2
= 60.14, p = 0.001). The test shows that there is strong association between
number of colleagues working in the same areas and satisfaction with thermal condition in
the office since p is far less than 0.05. It did not happen by chance and therefore the null
hypothesis is rejected for this cross tabulations.
Table 9.21 shows that respondents that have a higher number of colleagues working in the
same room are more dissatisfied with the public spaces in the building than those who have a
lower number of colleagues working in the same room. The chi-square test shows that there
is an association between number of colleagues and satisfaction with the building public area
spaces. The chi-square value and asymptotic significance (2-sided) for cross tabulation
between number of colleagues and satisfaction with the building public area spaces is (χ2
=
56.33, p = 0.017). Since p < 0.05, therefore the null hypothesis is rejected.
However, table 9.22 shows that respondents with a higher number of colleagues working in
the same room are happier than those who have a lower number of colleagues working in the
same area. The chi-square test for this cross tabulation shows that the asymptotic
significance (2-sided) for the cross tabulation is (χ2
= 34.75, p = 0.010). There is an
association between these two variables since p < 0.05. It des not happen by chance and
therefore the null hypothesis is rejected.
Table 9.20: Satisfaction towards thermal condition in the office and number of colleagues
working in the same area (cross tabulation)
Satisfaction no info 0-5 6-10 11-15 16-20 21-25 >25 Total
highly dissatisfied 14.3% 0.6%
dissatisfied 7.7% 8.0% 19.6% 14.3% 27.3% 14.4%
neutral 53.8% 36.0% 15.7% 26.1% 28.6% 62.5% 24.2% 28.1%
satisfied 38.5% 48.0% 58.8% 65.2% 28.6% 37.5% 39.4% 50.0%
very satisfied 8.0% 5.9% 8.7% 6.1% 5.6%
highly satisfied 14.3% 3.0% 1.3%
Total 100.0% 100.0% 100.0% 100.0% 100.0% 100.0% 100.0% 100.0%
Table 9.21: Satisfaction towards public area spaces in the building and number of colleagues
working in the same area (cross tabulation)
Satisfaction no info 0-5 6-10 11-15 16-20 21-25 >25 Total
highly dissatisfied 4.0% 12.5% 1.3%
very dissatisfied 14.3% 0.6%
dissatisfied 15.4% 4.0% 7.8% 8.7% 12.5% 12.1% 8.8%
neutral 46.2% 40.0% 45.1% 30.4% 42.9% 50.0% 27.3% 38.8%
satisfied 30.8% 36.0% 29.4% 39.1% 28.6% 54.5% 35.6%
very satisfied 16.0% 15.7% 13.0% 14.3% 25.0% 6.1% 12.5%
highly satisfied 7.7% 2.0% 8.7% 2.5%
Total 100.0% 100.0% 100.0% 100.0% 100.0% 100.0% 100.0% 100.0%
Table 9.22: Level of happiness working in the building and number of colleagues working in
the same area (cross tabulation)
Satisfaction no info 0-5 6-10 11-15 16-20 21-25 >25 Total
unhappy 8.0% 3.9% 14.3% 37.5% 3.0% 5.6%
neutral 38.5% 60.0% 43.1% 34.8% 57.1% 12.5% 51.5% 45.0%
happy 61.5% 24.0% 45.1% 52.2% 14.3% 50.0% 27.3% 39.4%
very happy 8.0% 7.8% 13.0% 14.3% 18.2% 10.0%
Total 100.0% 100.0% 100.0% 100.0% 100.0% 100.0% 100.0% 100.0%
9.2.5 Zone Level and Satisfaction
Table 9.23 shows that respondents in higher zone are more dissatisfied with the thermal
condition than those in the middle and lower zones whereas table 9.24 shows that
respondents in lower zone are more satisfied with the overall office environment that those
in the middle and upper zones. The chi-square test shows that there is an association for
cross tabulations between zone level and satisfaction with thermal condition in the office.
The chi-square test for this cross tabulation shows that the asymptotic significance (2-sided)
for the cross tabulation is (χ2
= 19.23, p = 0.037). Since p < 0.05, the association is
statistically significant and it does not happen by chance. Therefore the null hypothesis is
rejected. There is also an association between zone level and satisfaction with the overall
office environment. The chi-square test for this cross tabulation shows that the asymptotic
significance (2-sided) for the cross tabulation is (χ2
= 20.24, p = 0.027) and p < 0.05. The
association is statistically significant and it does not happen by chance, therefore the null
hypothesis is rejected (see table 9.25).
Table 9.23: Satisfaction towards thermal condition in the office by zone level
Satisfaction Lower Zone Middle Zone Higher Zone Total
highly dissatisfied 1.5% 0.6%
dissatisfied 12.3% 9.1% 25.0% 14.4%
neutral 23.1% 25.5% 40.0% 28.1%
satisfied 53.8% 63.6% 25.0% 50.0%
very satisfied 7.7% 1.8% 7.5% 5.6%
highly satisfied 1.5% 2.5% 1.3%
Total 100.0% 100.0% 100.0% 100.0%
Table 9.24: Satisfaction with overall office environment by zone level
Satisfaction Lower Zone Middle Zone Higher Zone Total
highly dissatisfied 1.8% 0.6%
dissatisfied 4.6% 5.5% 3.8%
neutral 46.2% 20.0% 30.0% 33.1%
satisfied 23.1% 50.9% 52.5% 40.0%
very satisfied 21.5% 14.5% 15.0% 17.5%
highly satisfied 4.6% 7.3% 2.5% 5.0%
Total 100.0% 100.0% 100.0% 100.0%
Table 9.25: Cross tabulation between zone level and satisfaction
Aspect Item Chi-square
Asymptotic
significance
(2-sided)
Significance Interpretation
Satisfaction with thermal condition in
the office
χ2
=19.23 p = 0.037 p < 0.05
Weak
Association
Satisfaction with the overall office
environment
χ2
= 20.24 p = 0.027 p < 0.05
Weak
Association
9.3 Summary and Conclusion
All the relationships between tested variables are shown in figure 9.1. The statistical analyses
for various cross tabulation in this chapter show the following results:
 Male respondents have higher satisfaction level towards the window available in their
office than the female. The relationship between two variables is statistically significant
which means it does not happen by chance and the null hypothesis is rejected. There is a
weak association between gender and satisfaction with the availability of a window in
the office.
 There is a strong association between gender and satisfaction with thermal condition in
the office. Female respondents have lower satisfaction levels than the males.
 The chi-square test shows that there is an association between job category and
satisfaction with the natural ventilation available in office and between job category and
level of happiness working in the building. Administrators are highly satisfied with the
natural ventilation in the office space.
 Executives are among the most satisfied respondents towards the noise level in the
office. The relationships between these variables are statistically significant and do not
happen by chance. The relationship between the two variables is strong.
 Respondents with more colleagues working in the same area are quite dissatisfied with
the thermal condition in the office. The chi-square test shows that there is strong
association between number of colleagues working in the same areas and satisfaction
towards thermal condition in the office. This association does not happen by chance and
the null hypothesis is rejected for this cross tabulations.
 Respondents who have a higher number of colleagues working in the same room are
more dissatisfied with the public spaces in the building than those who have a lower
number of colleagues working in the same room. The chi-square test shows that there is
an association between number of colleagues and satisfaction with the building public
area spaces.
Figure 9.1: Statistical significant diagram for respondents and satisfactions
 Respondents with a higher number of colleagues working in the same room are happier
than those who have a lower number of colleagues working in the same area. The chi-
square test for this cross tabulation shows that there is an association between these two
variables. It is statistically significant and does not happen by chance.
 Respondents in higher zone are more dissatisfied with the thermal condition than those
in the middle and lower zones. The chi-square test shows that there is an association for
cross tabulations between zone level and satisfaction with thermal condition in the
office. The chi-square test for this cross tabulation shows that the association is
statistically significant and it does not happen by chance.
 Respondents in lower zone are more satisfied with the overall office environment than
those in the middle and upper zones. The chi-square test for this cross tabulation shows
that it is statistically significant and it does not happen by chance. Therefore the null
hypothesis is rejected.

More Related Content

What's hot

Chi Square Worked Example
Chi Square Worked ExampleChi Square Worked Example
Chi Square Worked ExampleJohn Barlow
 
Statistical inference: Estimation
Statistical inference: EstimationStatistical inference: Estimation
Statistical inference: EstimationParag Shah
 
Chi square and t tests, Neelam zafar & group
Chi square and t tests, Neelam zafar & groupChi square and t tests, Neelam zafar & group
Chi square and t tests, Neelam zafar & groupNeelam Zafar
 
Wilcoxon Rank-Sum Test
Wilcoxon Rank-Sum TestWilcoxon Rank-Sum Test
Wilcoxon Rank-Sum TestSahil Jain
 
Statistical analysis in analytical chemistry
Statistical analysis in analytical chemistryStatistical analysis in analytical chemistry
Statistical analysis in analytical chemistryJethro Masangkay
 
Hypothesis testing chi square goodness of fit test
Hypothesis testing chi square goodness of fit testHypothesis testing chi square goodness of fit test
Hypothesis testing chi square goodness of fit testNadeem Uddin
 
Increasing Power without Increasing Sample Size
Increasing Power without Increasing Sample SizeIncreasing Power without Increasing Sample Size
Increasing Power without Increasing Sample Sizesmackinnon
 
Correlation & Linear Regression
Correlation & Linear RegressionCorrelation & Linear Regression
Correlation & Linear RegressionHammad Waseem
 
Introduction to Mediation using SPSS
Introduction to Mediation using SPSSIntroduction to Mediation using SPSS
Introduction to Mediation using SPSSsmackinnon
 
Association between-variables
Association between-variablesAssociation between-variables
Association between-variablesBorhan Uddin
 
Test of hypothesis test of significance
Test of hypothesis test of significanceTest of hypothesis test of significance
Test of hypothesis test of significanceDr. Jayesh Vyas
 
Ash bus 308 week 4 quiz
Ash bus 308 week 4 quizAsh bus 308 week 4 quiz
Ash bus 308 week 4 quizFaarooqkhaann
 
Representing and generating uncertainty effectively presentatıon
Representing and generating uncertainty effectively presentatıonRepresenting and generating uncertainty effectively presentatıon
Representing and generating uncertainty effectively presentatıonAzdeen Najah
 

What's hot (20)

Chi Square Worked Example
Chi Square Worked ExampleChi Square Worked Example
Chi Square Worked Example
 
Test of significance
Test of significanceTest of significance
Test of significance
 
Statistical inference: Estimation
Statistical inference: EstimationStatistical inference: Estimation
Statistical inference: Estimation
 
Chi square and t tests, Neelam zafar & group
Chi square and t tests, Neelam zafar & groupChi square and t tests, Neelam zafar & group
Chi square and t tests, Neelam zafar & group
 
Wilcoxon Rank-Sum Test
Wilcoxon Rank-Sum TestWilcoxon Rank-Sum Test
Wilcoxon Rank-Sum Test
 
P1 Stroop
P1 StroopP1 Stroop
P1 Stroop
 
Statistical analysis in analytical chemistry
Statistical analysis in analytical chemistryStatistical analysis in analytical chemistry
Statistical analysis in analytical chemistry
 
Two-Way ANOVA
Two-Way ANOVATwo-Way ANOVA
Two-Way ANOVA
 
Seawell_Exam
Seawell_ExamSeawell_Exam
Seawell_Exam
 
Hypothesis testing chi square goodness of fit test
Hypothesis testing chi square goodness of fit testHypothesis testing chi square goodness of fit test
Hypothesis testing chi square goodness of fit test
 
Increasing Power without Increasing Sample Size
Increasing Power without Increasing Sample SizeIncreasing Power without Increasing Sample Size
Increasing Power without Increasing Sample Size
 
Correlation & Linear Regression
Correlation & Linear RegressionCorrelation & Linear Regression
Correlation & Linear Regression
 
Introduction to Mediation using SPSS
Introduction to Mediation using SPSSIntroduction to Mediation using SPSS
Introduction to Mediation using SPSS
 
One-Way ANOVA
One-Way ANOVAOne-Way ANOVA
One-Way ANOVA
 
Chapter 14
Chapter 14 Chapter 14
Chapter 14
 
Association between-variables
Association between-variablesAssociation between-variables
Association between-variables
 
Test of hypothesis test of significance
Test of hypothesis test of significanceTest of hypothesis test of significance
Test of hypothesis test of significance
 
Ash bus 308 week 4 quiz
Ash bus 308 week 4 quizAsh bus 308 week 4 quiz
Ash bus 308 week 4 quiz
 
T test
T testT test
T test
 
Representing and generating uncertainty effectively presentatıon
Representing and generating uncertainty effectively presentatıonRepresenting and generating uncertainty effectively presentatıon
Representing and generating uncertainty effectively presentatıon
 

Viewers also liked

Experts by Experience: Hands-on Experts in Poverty and their Added Value in I...
Experts by Experience: Hands-on Experts in Poverty and their Added Value in I...Experts by Experience: Hands-on Experts in Poverty and their Added Value in I...
Experts by Experience: Hands-on Experts in Poverty and their Added Value in I...FEANTSA
 
HIV AIDS Knowledge and Risk-taking Behaviors
HIV AIDS Knowledge and Risk-taking BehaviorsHIV AIDS Knowledge and Risk-taking Behaviors
HIV AIDS Knowledge and Risk-taking BehaviorsRyan Michael Oducado
 
Bring Down The Walls for Confusion - Agile and Beyond 2016
Bring Down The Walls for Confusion - Agile and Beyond 2016Bring Down The Walls for Confusion - Agile and Beyond 2016
Bring Down The Walls for Confusion - Agile and Beyond 2016Dana Pylayeva
 
Participants al concurs de fotografia filosofica
Participants al concurs de fotografia filosoficaParticipants al concurs de fotografia filosofica
Participants al concurs de fotografia filosoficaManuela Sard
 
UX Strategies: LEAN & MEAN
UX Strategies: LEAN & MEANUX Strategies: LEAN & MEAN
UX Strategies: LEAN & MEANwearelousy
 
Graficos taller 3 yenny listo
Graficos taller 3 yenny listoGraficos taller 3 yenny listo
Graficos taller 3 yenny listoYenny Martinez
 
CHT-G(XX)X-X-MOD-02-UOG-MOD-02
CHT-G(XX)X-X-MOD-02-UOG-MOD-02CHT-G(XX)X-X-MOD-02-UOG-MOD-02
CHT-G(XX)X-X-MOD-02-UOG-MOD-02Douglas Hart Snr
 
Planificación diagnostica
Planificación diagnosticaPlanificación diagnostica
Planificación diagnosticaLilia Garcia
 
Marine fish production in india and deep sea fisheries to increase the produc...
Marine fish production in india and deep sea fisheries to increase the produc...Marine fish production in india and deep sea fisheries to increase the produc...
Marine fish production in india and deep sea fisheries to increase the produc...ansumanpanda360
 

Viewers also liked (18)

Arpanet/Internet
Arpanet/InternetArpanet/Internet
Arpanet/Internet
 
Experts by Experience: Hands-on Experts in Poverty and their Added Value in I...
Experts by Experience: Hands-on Experts in Poverty and their Added Value in I...Experts by Experience: Hands-on Experts in Poverty and their Added Value in I...
Experts by Experience: Hands-on Experts in Poverty and their Added Value in I...
 
DP & Time Spirals
DP & Time SpiralsDP & Time Spirals
DP & Time Spirals
 
HIV AIDS Knowledge and Risk-taking Behaviors
HIV AIDS Knowledge and Risk-taking BehaviorsHIV AIDS Knowledge and Risk-taking Behaviors
HIV AIDS Knowledge and Risk-taking Behaviors
 
Unidad 1
Unidad 1Unidad 1
Unidad 1
 
Cine y vídeo
Cine y vídeoCine y vídeo
Cine y vídeo
 
Equipo3 PracticaPowerPoint
Equipo3 PracticaPowerPointEquipo3 PracticaPowerPoint
Equipo3 PracticaPowerPoint
 
1 a group 7 oral comm
1 a group 7 oral comm1 a group 7 oral comm
1 a group 7 oral comm
 
Kidney and scd
Kidney and scdKidney and scd
Kidney and scd
 
Bring Down The Walls for Confusion - Agile and Beyond 2016
Bring Down The Walls for Confusion - Agile and Beyond 2016Bring Down The Walls for Confusion - Agile and Beyond 2016
Bring Down The Walls for Confusion - Agile and Beyond 2016
 
Participants al concurs de fotografia filosofica
Participants al concurs de fotografia filosoficaParticipants al concurs de fotografia filosofica
Participants al concurs de fotografia filosofica
 
UX Strategies: LEAN & MEAN
UX Strategies: LEAN & MEANUX Strategies: LEAN & MEAN
UX Strategies: LEAN & MEAN
 
Metodo cientifico
Metodo cientificoMetodo cientifico
Metodo cientifico
 
Graficos taller 3 yenny listo
Graficos taller 3 yenny listoGraficos taller 3 yenny listo
Graficos taller 3 yenny listo
 
CHT-G(XX)X-X-MOD-02-UOG-MOD-02
CHT-G(XX)X-X-MOD-02-UOG-MOD-02CHT-G(XX)X-X-MOD-02-UOG-MOD-02
CHT-G(XX)X-X-MOD-02-UOG-MOD-02
 
Educacion 20 una proximacion a las experiencas educativas
Educacion 20 una proximacion a las experiencas educativasEducacion 20 una proximacion a las experiencas educativas
Educacion 20 una proximacion a las experiencas educativas
 
Planificación diagnostica
Planificación diagnosticaPlanificación diagnostica
Planificación diagnostica
 
Marine fish production in india and deep sea fisheries to increase the produc...
Marine fish production in india and deep sea fisheries to increase the produc...Marine fish production in india and deep sea fisheries to increase the produc...
Marine fish production in india and deep sea fisheries to increase the produc...
 

Similar to Chapter 9 user's satisfaction intepreting the results

Multiple regression to findout drivers of online satisfaction
Multiple regression to findout drivers of  online satisfactionMultiple regression to findout drivers of  online satisfaction
Multiple regression to findout drivers of online satisfactionSomdeep Sen
 
Poonam 20ahluwalia-131008015758-phpapp02
Poonam 20ahluwalia-131008015758-phpapp02Poonam 20ahluwalia-131008015758-phpapp02
Poonam 20ahluwalia-131008015758-phpapp02PMI_IREP_TP
 
Poonam ahluwalia
Poonam ahluwaliaPoonam ahluwalia
Poonam ahluwaliaPMI2011
 
Week 5 Lecture 14 The Chi Square TestQuite often, patterns of .docx
Week 5 Lecture 14 The Chi Square TestQuite often, patterns of .docxWeek 5 Lecture 14 The Chi Square TestQuite often, patterns of .docx
Week 5 Lecture 14 The Chi Square TestQuite often, patterns of .docxcockekeshia
 
cannonicalpresentation-110505114327-phpapp01.pdf
cannonicalpresentation-110505114327-phpapp01.pdfcannonicalpresentation-110505114327-phpapp01.pdf
cannonicalpresentation-110505114327-phpapp01.pdfJermaeDizon2
 
Assessment 3 – Hypothesis, Effect Size, Power, and t Tests.docx
Assessment 3 – Hypothesis, Effect Size, Power, and t Tests.docxAssessment 3 – Hypothesis, Effect Size, Power, and t Tests.docx
Assessment 3 – Hypothesis, Effect Size, Power, and t Tests.docxcargillfilberto
 
ScoreWeek 5 Correlation and Regressio.docx
ScoreWeek 5 Correlation and Regressio.docxScoreWeek 5 Correlation and Regressio.docx
ScoreWeek 5 Correlation and Regressio.docxpotmanandrea
 
Week 5 Lecture 14 The Chi Square Test Quite often, pat.docx
Week 5 Lecture 14 The Chi Square Test Quite often, pat.docxWeek 5 Lecture 14 The Chi Square Test Quite often, pat.docx
Week 5 Lecture 14 The Chi Square Test Quite often, pat.docxcockekeshia
 
Data Analysis for Graduate Studies Summary
Data Analysis for Graduate Studies SummaryData Analysis for Graduate Studies Summary
Data Analysis for Graduate Studies SummaryKelvinNMhina
 
You clearly understand the concepts of this assignment. You’ve don.docx
You clearly understand the concepts of this assignment. You’ve don.docxYou clearly understand the concepts of this assignment. You’ve don.docx
You clearly understand the concepts of this assignment. You’ve don.docxjeffevans62972
 
How to do ahp analysis in excel
How to do ahp analysis in excelHow to do ahp analysis in excel
How to do ahp analysis in excelJ.Roberto S.F
 
Lecture 5 practical_guidelines_assignments
Lecture 5 practical_guidelines_assignmentsLecture 5 practical_guidelines_assignments
Lecture 5 practical_guidelines_assignmentsDaria Bogdanova
 
Chi-square tests are great to show if distributions differ or i.docx
 Chi-square tests are great to show if distributions differ or i.docx Chi-square tests are great to show if distributions differ or i.docx
Chi-square tests are great to show if distributions differ or i.docxMARRY7
 
Multivariate data analysis regression, cluster and factor analysis on spss
Multivariate data analysis   regression, cluster and factor analysis on spssMultivariate data analysis   regression, cluster and factor analysis on spss
Multivariate data analysis regression, cluster and factor analysis on spssAditya Banerjee
 

Similar to Chapter 9 user's satisfaction intepreting the results (20)

Final report mkt
Final report mktFinal report mkt
Final report mkt
 
Multiple regression to findout drivers of online satisfaction
Multiple regression to findout drivers of  online satisfactionMultiple regression to findout drivers of  online satisfaction
Multiple regression to findout drivers of online satisfaction
 
Regression presentation
Regression presentationRegression presentation
Regression presentation
 
Poonam 20ahluwalia-131008015758-phpapp02
Poonam 20ahluwalia-131008015758-phpapp02Poonam 20ahluwalia-131008015758-phpapp02
Poonam 20ahluwalia-131008015758-phpapp02
 
Poonam ahluwalia
Poonam ahluwaliaPoonam ahluwalia
Poonam ahluwalia
 
Week 5 Lecture 14 The Chi Square TestQuite often, patterns of .docx
Week 5 Lecture 14 The Chi Square TestQuite often, patterns of .docxWeek 5 Lecture 14 The Chi Square TestQuite often, patterns of .docx
Week 5 Lecture 14 The Chi Square TestQuite often, patterns of .docx
 
cannonicalpresentation-110505114327-phpapp01.pdf
cannonicalpresentation-110505114327-phpapp01.pdfcannonicalpresentation-110505114327-phpapp01.pdf
cannonicalpresentation-110505114327-phpapp01.pdf
 
Assessment 3 – Hypothesis, Effect Size, Power, and t Tests.docx
Assessment 3 – Hypothesis, Effect Size, Power, and t Tests.docxAssessment 3 – Hypothesis, Effect Size, Power, and t Tests.docx
Assessment 3 – Hypothesis, Effect Size, Power, and t Tests.docx
 
ScoreWeek 5 Correlation and Regressio.docx
ScoreWeek 5 Correlation and Regressio.docxScoreWeek 5 Correlation and Regressio.docx
ScoreWeek 5 Correlation and Regressio.docx
 
Week 5 Lecture 14 The Chi Square Test Quite often, pat.docx
Week 5 Lecture 14 The Chi Square Test Quite often, pat.docxWeek 5 Lecture 14 The Chi Square Test Quite often, pat.docx
Week 5 Lecture 14 The Chi Square Test Quite often, pat.docx
 
Statistical analysis in SPSS_
Statistical analysis in SPSS_ Statistical analysis in SPSS_
Statistical analysis in SPSS_
 
Data Analysis for Graduate Studies Summary
Data Analysis for Graduate Studies SummaryData Analysis for Graduate Studies Summary
Data Analysis for Graduate Studies Summary
 
You clearly understand the concepts of this assignment. You’ve don.docx
You clearly understand the concepts of this assignment. You’ve don.docxYou clearly understand the concepts of this assignment. You’ve don.docx
You clearly understand the concepts of this assignment. You’ve don.docx
 
200994363
200994363200994363
200994363
 
Doutorado.Slides v5 - Rubens
Doutorado.Slides v5 - RubensDoutorado.Slides v5 - Rubens
Doutorado.Slides v5 - Rubens
 
How to do ahp analysis in excel
How to do ahp analysis in excelHow to do ahp analysis in excel
How to do ahp analysis in excel
 
Lecture 5 practical_guidelines_assignments
Lecture 5 practical_guidelines_assignmentsLecture 5 practical_guidelines_assignments
Lecture 5 practical_guidelines_assignments
 
Chi-square tests are great to show if distributions differ or i.docx
 Chi-square tests are great to show if distributions differ or i.docx Chi-square tests are great to show if distributions differ or i.docx
Chi-square tests are great to show if distributions differ or i.docx
 
Chapter 3
Chapter 3Chapter 3
Chapter 3
 
Multivariate data analysis regression, cluster and factor analysis on spss
Multivariate data analysis   regression, cluster and factor analysis on spssMultivariate data analysis   regression, cluster and factor analysis on spss
Multivariate data analysis regression, cluster and factor analysis on spss
 

More from Lokman Hakim Ismail

Student Development Center SDC@P3P 2017
Student Development Center SDC@P3P 2017Student Development Center SDC@P3P 2017
Student Development Center SDC@P3P 2017Lokman Hakim Ismail
 
Peranan Keselamatan Dalam Membangunkan Pelajar Holistik
Peranan Keselamatan Dalam Membangunkan Pelajar HolistikPeranan Keselamatan Dalam Membangunkan Pelajar Holistik
Peranan Keselamatan Dalam Membangunkan Pelajar HolistikLokman Hakim Ismail
 
Chapter 10 discussion and conclusion
Chapter 10   discussion and conclusionChapter 10   discussion and conclusion
Chapter 10 discussion and conclusionLokman Hakim Ismail
 
Chapter 8 perception on indoor environmental conditions
Chapter 8   perception on indoor environmental conditionsChapter 8   perception on indoor environmental conditions
Chapter 8 perception on indoor environmental conditionsLokman Hakim Ismail
 
Chapter 7 measurement of environmental conditions
Chapter 7   measurement of environmental conditionsChapter 7   measurement of environmental conditions
Chapter 7 measurement of environmental conditionsLokman Hakim Ismail
 
Chapter 6 perception of architectural elements in communal spaces
Chapter 6   perception of architectural elements in communal spacesChapter 6   perception of architectural elements in communal spaces
Chapter 6 perception of architectural elements in communal spacesLokman Hakim Ismail
 
Chapter 5 perception of architectural elements in office spaces
Chapter 5   perception of architectural elements in office spacesChapter 5   perception of architectural elements in office spaces
Chapter 5 perception of architectural elements in office spacesLokman Hakim Ismail
 
Chapter 4 case studies characteristics
Chapter 4   case studies characteristicsChapter 4   case studies characteristics
Chapter 4 case studies characteristicsLokman Hakim Ismail
 
Chapter 3 research design and methodology
Chapter 3   research design and methodologyChapter 3   research design and methodology
Chapter 3 research design and methodologyLokman Hakim Ismail
 
Chapter 2 environmental strategies for building design in tropical climates
Chapter 2   environmental strategies for building design in tropical climatesChapter 2   environmental strategies for building design in tropical climates
Chapter 2 environmental strategies for building design in tropical climatesLokman Hakim Ismail
 
Chapter 1 introduction and research background
Chapter 1 introduction and research background  Chapter 1 introduction and research background
Chapter 1 introduction and research background Lokman Hakim Ismail
 

More from Lokman Hakim Ismail (20)

Positive Power
Positive Power Positive Power
Positive Power
 
Student Development Center SDC@P3P 2017
Student Development Center SDC@P3P 2017Student Development Center SDC@P3P 2017
Student Development Center SDC@P3P 2017
 
Peranan Keselamatan Dalam Membangunkan Pelajar Holistik
Peranan Keselamatan Dalam Membangunkan Pelajar HolistikPeranan Keselamatan Dalam Membangunkan Pelajar Holistik
Peranan Keselamatan Dalam Membangunkan Pelajar Holistik
 
References
ReferencesReferences
References
 
Appendix1 questionaires v4
Appendix1 questionaires v4Appendix1 questionaires v4
Appendix1 questionaires v4
 
Chapter 10 discussion and conclusion
Chapter 10   discussion and conclusionChapter 10   discussion and conclusion
Chapter 10 discussion and conclusion
 
Chapter 8 perception on indoor environmental conditions
Chapter 8   perception on indoor environmental conditionsChapter 8   perception on indoor environmental conditions
Chapter 8 perception on indoor environmental conditions
 
Chapter 7 measurement of environmental conditions
Chapter 7   measurement of environmental conditionsChapter 7   measurement of environmental conditions
Chapter 7 measurement of environmental conditions
 
Chapter 6 perception of architectural elements in communal spaces
Chapter 6   perception of architectural elements in communal spacesChapter 6   perception of architectural elements in communal spaces
Chapter 6 perception of architectural elements in communal spaces
 
Chapter 5 perception of architectural elements in office spaces
Chapter 5   perception of architectural elements in office spacesChapter 5   perception of architectural elements in office spaces
Chapter 5 perception of architectural elements in office spaces
 
Chapter 4 case studies characteristics
Chapter 4   case studies characteristicsChapter 4   case studies characteristics
Chapter 4 case studies characteristics
 
Chapter 3 research design and methodology
Chapter 3   research design and methodologyChapter 3   research design and methodology
Chapter 3 research design and methodology
 
Chapter 2 environmental strategies for building design in tropical climates
Chapter 2   environmental strategies for building design in tropical climatesChapter 2   environmental strategies for building design in tropical climates
Chapter 2 environmental strategies for building design in tropical climates
 
Chapter 1 introduction and research background
Chapter 1 introduction and research background  Chapter 1 introduction and research background
Chapter 1 introduction and research background
 
PhD Viva LHI
PhD Viva LHIPhD Viva LHI
PhD Viva LHI
 
Sustainable Development
Sustainable DevelopmentSustainable Development
Sustainable Development
 
Career Department UTHM
Career Department UTHMCareer Department UTHM
Career Department UTHM
 
Dynamic and Pro Active Attitude
Dynamic and Pro Active AttitudeDynamic and Pro Active Attitude
Dynamic and Pro Active Attitude
 
Renewable Energy
Renewable EnergyRenewable Energy
Renewable Energy
 
50 Positive Thinking Tips
50 Positive Thinking Tips50 Positive Thinking Tips
50 Positive Thinking Tips
 

Recently uploaded

12 Week Weight Loss Planner to help with planning weight loss
12 Week Weight Loss Planner to help with planning weight loss12 Week Weight Loss Planner to help with planning weight loss
12 Week Weight Loss Planner to help with planning weight lossSimpleMoneyMaker
 
Love and Hate: Unveiling the Strongest Emotion
Love and Hate: Unveiling the Strongest EmotionLove and Hate: Unveiling the Strongest Emotion
Love and Hate: Unveiling the Strongest EmotionbluetroyvictorVinay
 
《QUT毕业文凭网-认证昆士兰科技大学毕业证成绩单》
《QUT毕业文凭网-认证昆士兰科技大学毕业证成绩单》《QUT毕业文凭网-认证昆士兰科技大学毕业证成绩单》
《QUT毕业文凭网-认证昆士兰科技大学毕业证成绩单》rnrncn29
 
Living in the Light_ A guide to personal transformation ( PDFDrive ).pdf
Living in the Light_ A guide to personal transformation ( PDFDrive ).pdfLiving in the Light_ A guide to personal transformation ( PDFDrive ).pdf
Living in the Light_ A guide to personal transformation ( PDFDrive ).pdfkalpana413121
 
Uttoxeter & Cheadle Voice, Issue 122.pdf
Uttoxeter & Cheadle Voice, Issue 122.pdfUttoxeter & Cheadle Voice, Issue 122.pdf
Uttoxeter & Cheadle Voice, Issue 122.pdfNoel Sergeant
 
Masjid Ishaq The Mosque of Babo Dehri Swabi
Masjid Ishaq The Mosque of Babo Dehri SwabiMasjid Ishaq The Mosque of Babo Dehri Swabi
Masjid Ishaq The Mosque of Babo Dehri SwabiAlhamdulillah 33
 
Dry and cracked heels foot cream in India
Dry and cracked heels foot cream in IndiaDry and cracked heels foot cream in India
Dry and cracked heels foot cream in IndiaUniqaya Lifestyle
 
Call In girls Delhi Safdarjung Enclave/WhatsApp 🔝 97111⇛⇛47426
Call In girls Delhi Safdarjung Enclave/WhatsApp 🔝  97111⇛⇛47426Call In girls Delhi Safdarjung Enclave/WhatsApp 🔝  97111⇛⇛47426
Call In girls Delhi Safdarjung Enclave/WhatsApp 🔝 97111⇛⇛47426jennyeacort
 
FUNDAMENTALS OF ARNIS ARNIS ARNIS ARNIS ARNIS
FUNDAMENTALS OF ARNIS ARNIS ARNIS ARNIS ARNISFUNDAMENTALS OF ARNIS ARNIS ARNIS ARNIS ARNIS
FUNDAMENTALS OF ARNIS ARNIS ARNIS ARNIS ARNISe98298697
 
Group Discussion and panel Discussion
Group Discussion  and   panel DiscussionGroup Discussion  and   panel Discussion
Group Discussion and panel DiscussionAbdulGhaffarGhori
 

Recently uploaded (10)

12 Week Weight Loss Planner to help with planning weight loss
12 Week Weight Loss Planner to help with planning weight loss12 Week Weight Loss Planner to help with planning weight loss
12 Week Weight Loss Planner to help with planning weight loss
 
Love and Hate: Unveiling the Strongest Emotion
Love and Hate: Unveiling the Strongest EmotionLove and Hate: Unveiling the Strongest Emotion
Love and Hate: Unveiling the Strongest Emotion
 
《QUT毕业文凭网-认证昆士兰科技大学毕业证成绩单》
《QUT毕业文凭网-认证昆士兰科技大学毕业证成绩单》《QUT毕业文凭网-认证昆士兰科技大学毕业证成绩单》
《QUT毕业文凭网-认证昆士兰科技大学毕业证成绩单》
 
Living in the Light_ A guide to personal transformation ( PDFDrive ).pdf
Living in the Light_ A guide to personal transformation ( PDFDrive ).pdfLiving in the Light_ A guide to personal transformation ( PDFDrive ).pdf
Living in the Light_ A guide to personal transformation ( PDFDrive ).pdf
 
Uttoxeter & Cheadle Voice, Issue 122.pdf
Uttoxeter & Cheadle Voice, Issue 122.pdfUttoxeter & Cheadle Voice, Issue 122.pdf
Uttoxeter & Cheadle Voice, Issue 122.pdf
 
Masjid Ishaq The Mosque of Babo Dehri Swabi
Masjid Ishaq The Mosque of Babo Dehri SwabiMasjid Ishaq The Mosque of Babo Dehri Swabi
Masjid Ishaq The Mosque of Babo Dehri Swabi
 
Dry and cracked heels foot cream in India
Dry and cracked heels foot cream in IndiaDry and cracked heels foot cream in India
Dry and cracked heels foot cream in India
 
Call In girls Delhi Safdarjung Enclave/WhatsApp 🔝 97111⇛⇛47426
Call In girls Delhi Safdarjung Enclave/WhatsApp 🔝  97111⇛⇛47426Call In girls Delhi Safdarjung Enclave/WhatsApp 🔝  97111⇛⇛47426
Call In girls Delhi Safdarjung Enclave/WhatsApp 🔝 97111⇛⇛47426
 
FUNDAMENTALS OF ARNIS ARNIS ARNIS ARNIS ARNIS
FUNDAMENTALS OF ARNIS ARNIS ARNIS ARNIS ARNISFUNDAMENTALS OF ARNIS ARNIS ARNIS ARNIS ARNIS
FUNDAMENTALS OF ARNIS ARNIS ARNIS ARNIS ARNIS
 
Group Discussion and panel Discussion
Group Discussion  and   panel DiscussionGroup Discussion  and   panel Discussion
Group Discussion and panel Discussion
 

Chapter 9 user's satisfaction intepreting the results

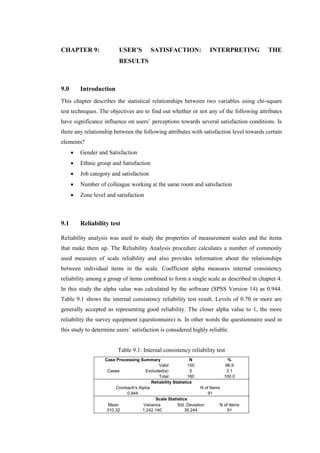
  • 1. CHAPTER 9: USER’S SATISFACTION: INTERPRETING THE RESULTS 9.0 Introduction This chapter describes the statistical relationships between two variables using chi-square test techniques. The objectives are to find out whether or not any of the following attributes have significance influence on users’ perceptions towards several satisfaction conditions. Is there any relationship between the following attributes with satisfaction level towards certain elements?  Gender and Satisfaction  Ethnic group and Satisfaction  Job category and satisfaction  Number of colleague working at the same room and satisfaction  Zone level and satisfaction 9.1 Reliability test Reliability analysis was used to study the properties of measurement scales and the items that make them up. The Reliability Analysis procedure calculates a number of commonly used measures of scale reliability and also provides information about the relationships between individual items in the scale. Coefficient alpha measures internal consistency reliability among a group of items combined to form a single scale as described in chapter 4. In this study the alpha value was calculated by the software (SPSS Version 14) as 0.944. Table 9.1 shows the internal consistency reliability test result. Levels of 0.70 or more are generally accepted as representing good reliability. The closer alpha value to 1, the more reliability the survey equipment (questionnaire) is. In other words the questionnaire used in this study to determine users’ satisfaction is considered highly reliable. Table 9.1: Internal consistency reliability test Case Processing Summary N % Cases Valid 155 96.9 Excluded(a) 5 3.1 Total 160 100.0 Reliability Statistics Cronbach's Alpha N of Items 0.944 91 Scale Statistics Mean Variance Std. Deviation N of Items 310.32 1,242.140 35.244 91
  • 2. 9.2 Chi-Square Test Test of statistical significance: Chi Square After having produced a considerable number of contingency tables and selected the ones that appeared to show a pattern of relationship between satisfaction and the variable being tested, an important question remained, which is whether the pattern that emerged was due to chance fluctuation or whether it could be considered as a reliable finding. Chi Square is a way to measure the significance of an association between two variables. It tests whether the null hypothesis is true or false, that is whether the two variables examined in a contingency table are independent of each other in the population as mentioned in chapter 4. If the null hypothesis is in fact not true, then the sample association reflects some actual degree of association in the population. From the Chi square value a ‘p value’ is worked out in order to estimate whether the relationship between two variables is statistically significant or not. It is the generally accepted convention that a null hypothesis is not rejected unless there is less than 5% chance that it is in fact true, that is p <0.05. The significance level p varies from 0.10 to 0.001. In the present study the null hypothesis is rejected at a p value smaller than 5%. Another way of saying this is that a null hypothesis will not be rejected unless there is at least 95% chance that it is false. However, a relationship between two variables can be significant in statistical terms without being either strong or important. Chi Square is not useful as a measure of the magnitude of an association. A significant result means only that the relationship in the population is unlikely to be zero. For nominal and ordinal data, coefficients measuring the strength of an association between two variables are derived from the Chi Square value. The measure of association used in the present study is described below. The Contingency coefficient The contingency coefficient C is a long established and widely used index of relationship where larger than 2x2 tables are involved. The contingency coefficient C is derived from the Chi square and measures the strength of an association in two variables. Its value ranges between 0 and 1 but can never reach the value of 1. The nearer to 1 the C coefficient, the closer the association is between the two considered variables. In this study most variable are tested (as shown in appendix 6) but after a lengthy process of testing, examination and re- testing, a small number of tables were finally selected for discussion. Some of the variables are discussed in previous chapters and some are discussed in the next sections. The selection was made on the basis of the significance level (p < 0.05) as well as the magnitude of the
  • 3. relationship (C Value) between the variable measuring one of the attributes of the building environment and the two records of the expressed satisfaction. The variables that have been found related to respondents’ satisfaction are presented in the next sections according to whether they have been found associated with both records of satisfaction and according to the strength of their relationship to satisfaction. 9.2.1 Gender and Satisfaction This section presents cross tabulation between gender and satisfaction level towards all architectural and environmental elements. The aim is to find significant relationships between gender and satisfaction level for several elements. Table 9.2: Cross tabulation between gender and satisfaction Aspect Item Chi-square Asymptotic significance (2-sided) Significance Interpretation a. Satisfaction with the window available in office χ2 = 13.68 p = 0.033 p < 0.05 Weak Association b. Difficulty to open/close windows at office room χ2 = 18.85 p = 0.009 p < 0.05 Strong Association c. Satisfaction with thermal condition in the office χ2 = 14.13 p = 0.015 p < 0.05 Strong Association Gender BUILDING UMNO MESINIAGA IBM KOMTAR TIMA LUTH TOTAL male 8 11 11 12 10 10 62 female 10 13 9 29 23 14 98 TOTAL 18 24 20 41 33 24 160 0 5 10 15 20 25 30 35 UMNO MESINIAGA IBM KOMTAR TIMA LUTH male female The chi-square value and asymptotic significance (2-sided) for cross tabulation between gender and satisfaction with the availability of a window in the office is (χ2 = 13.68, p = 0.033). There is a weak association between gender and satisfaction with the availability of a window in the office (p < 0.05). The relationship between two variables is statistically significant (see table 9.2) which means it does not happen by chance and therefore the null hypothesis is rejected. Table 9.3 shows that male respondents have higher satisfaction levels
  • 4. towards the window available in their office than the female. More than 50% of male respondents are satisfied to highly satisfy whereas only around 42% females are. 80% of all respondents rated the windows as quite difficult to very difficult to close/open. 50% of the female respondents rated it as quite difficult to very difficult (see table 9.4). Table 9.3: Satisfaction towards window available in the office and gender (cross tabulation) Satisfaction Male Female Total highly dissatisfied 3.2% 1.3% very dissatisfied 4.8% 4.1% 4.4% dissatisfied 4.8% 12.2% 9.4% neutral 32.3% 38.8% 36.3% satisfied 41.9% 36.7% 38.8% very satisfied 11.3% 2.0% 5.6% highly satisfied 1.6% 6.1% 4.4% Total 100.0% 100.0% 100.0% Table 9.4: Difficulty to open/close window in the office and gender (cross tabulation) Satisfaction Male Female Total no info 6.1% 3.8% very difficult 17.7% 20.4% 19.4% difficult 9.7% 10.2% 10.0% quite difficult 3.2% 19.4% 13.1% normal 45.2% 30.6% 36.3% quite easy 8.1% 2.0% 4.4% easy 9.7% 9.2% 9.4% very easy 6.5% 2.0% 3.8% Total 100.0% 100.0% 100.0% Table 9.5: Gender and satisfaction towards thermal condition in the office (cross tabulation) Satisfaction Male Female Total highly dissatisfied 1.0% 0.6% dissatisfied 3.2% 21.4% 14.4% neutral 37.1% 22.4% 28.1% satisfied 54.8% 46.9% 50.0% very satisfied 4.8% 6.1% 5.6% highly satisfied 2.0% 1.3% Total 100.0% 100.0% 100.0% There is also a strong association between gender and difficulty to open/close windows at office room (χ2 = 18.85, p = 0.009). Since p < 0.05, the relationships between two variables are statistically significant and do not happen by chance the null hypothesis is rejected. The chi-square value and asymptotic significance (2-sided) for cross tabulation between gender and satisfaction with thermal condition in the office is (χ2 = 14.13, p = 0.015). There is a strong association (p < 0.05) between gender and satisfaction towards thermal condition in the office. With regard to thermal condition satisfaction, female respondents have lower satisfaction level than the males where around 22% of them are dissatisfied with the thermal condition in their office (see figure 9.5).
  • 5. 9.2.2 Ethnic Group and Satisfaction The cross tabulations between ethnic group and satisfaction for several features show there are strong relationships between ethnic group and satisfaction with the natural and artificial lighting in the office, natural ventilation in the office and the overall building maintenance. The cross tabulations also show that ethnic group and satisfaction with the window in the office, overall lift services and overall housekeeping in the building have weak relationships The chi-square test for those cross tabulations are shown in table 9.6. Since the p value for the cross tabulations is less than 0.05, it can be said that the relationships between those variables are statistically significant and do not happen by chance. Table 9.6: Chi-square tests for ethnic group & satisfaction Aspect Item Chi-square Asymptotic significance (2-sided) Significance Interpretation Satisfaction with the natural lighting in the office χ2 = 59.09 p = 0.000 p < 0.05 Strong Association Satisfaction with the artificial lighting in the office χ2 = 38.74 p = 0.001 p < 0.05 Strong Association Satisfaction with the natural ventilation in the office χ2 = 67.21 p = 0.000 p < 0.05 Strong Association Satisfaction with the building maintenance χ2 = 30.98 p = 0.009 p < 0.05 Strong Association Satisfaction with the window available in your office χ2 = 31.52 p = 0.025 p < 0.05 Weak Association Satisfaction with the overall lift services in the building χ2 = 31.01 p = 0.029 P < 0.05 Weak Association Satisfaction with the overall housekeeping in the building χ2 = 26.06 p = 0.037 p < 0.05 Weak Association Ethnic group BUILDING UMNO MESINIAGA IBM KOMTAR TIMA LUTH TOTAL Malay 7 20 5 39 31 24 126 Chinese 8 1 4 0 1 0 14 Indian 2 2 11 2 0 0 17 others 1 1 0 0 1 0 3 TOTAL 18 24 20 41 33 24 160 0 5 10 15 20 25 30 35 40 45 UMNO MESINIAGA IBM KOMTAR TIMA LUTH Malay Chinese Indian others
  • 6. Table 9.7: Cross tabulation between ethnic group & satisfaction with the natural lighting available in office Malay Chinese Indian others Total no info 1.6% 1.3% dissatisfied 9.5% 7.1% 17.6% 33.3% 10.6% neutral 33.3% 42.9% 23.5% 33.3% 33.1% satisfied 43.7% 35.7% 52.9% 43.1% very satisfied 11.9% 14.3% 5.9% 11.3% highly satisfied 33.3% .6% Total 100.0% 100.0% 100.0% 100.0% 100.0% Table 9.8: Cross tabulation between ethnic group & satisfaction with the artificial lighting available in the office Malay Chinese Indian others Total highly dissatisfied 1.6% 7.1% 1.9% dissatisfied 3.2% 2.5% neutral 18.3% 14.3% 64.7% 33.3% 23.1% satisfied 68.3% 64.3% 23.5% 61.9% very satisfied 6.3% 14.3% 11.8% 66.7% 8.8% highly satisfied 2.4% 1.9% Total 100.0% 100.0% 100.0% 100.0% 100.0% There are no major differences between Malay, Chinese and Indians in terms of satisfaction towards the natural lighting in the office. About half of the respondents in each ethnic group are satisfied to very satisfied (see table 9.7) with the natural lighting available in the office. However, when it comes to artificial lighting, the Indian respondents are quite neutral (see table 9.8) whereas the Malay and Chinese are highly satisfied where more than 70% of the respondents in each group being satisfied to highly satisfied. In terms of the natural ventilation available in the office, the Indian respondents are much more satisfied than the Malay and the Chinese respondents (see table 9.9). The Chinese respondents rated their satisfaction with the available window in the office higher than the Malay and the Indian respondents (see table 9.10). The Chinese respondents are more satisfied than the Malay and the Indian respondents in terms of the overall maintenance in the building where more than 60% of the Chinese respondents rated it as satisfied to very satisfied (table 9.11). The Chinese also gave higher satisfaction levels as compared to the Malays and Indians for the overall house keeping in the building as shown in table 9.12. The Malay respondents are more satisfied than the Chinese and the Indian respondents in terms of the overall lift service in the building where 40% of them rated it as satisfied to highly satisfied (see table 9.13).
  • 7. Table 9.9: Cross tabulation between ethnic group & satisfaction with the natural ventilation available in the office Malay Chinese Indian others Total no info 0.8% 0.6% highly dissatisfied 0.8% 0.6% very dissatisfied 3.2% 7.1% 3.1% dissatisfied 23.2% 14.3% 5.9% 20.1% neutral 25.6% 57.1% 41.2% 33.3% 30.2% satisfied 40.0% 21.4% 35.3% 33.3% 37.7% very satisfied 6.4% 17.6% 6.9% highly satisfied 33.3% .6% Total 100.0% 100.0% 100.0% 100.0% 100.0% Table 9.10: Cross tabulation ethnic group & satisfaction with the window in the office Malay Chinese Indian others Total highly dissatisfied 0.8% 5.9% 1.3% very dissatisfied 4.0% 7.1% 5.9% 4.4% dissatisfied 7.1% 21.4% 5.9% 66.7% 9.4% neutral 38.9% 14.3% 41.2% 36.3% satisfied 39.7% 42.9% 35.3% 38.8% very satisfied 5.6% 14.3% 5.6% highly satisfied 4.0% 5.9% 33.3% 4.4% Total 100.0% 100.0% 100.0% 100.0% 100.0% Table 9.11: Cross tabulation between ethnic group & satisfaction with the overall maintenance in the building Malay Chinese Indian others Total highly dissatisfied 1.6% 1.3% dissatisfied 7.1% 5.9% 6.3% neutral 45.2% 35.7% 41.2% 33.3% 43.8% satisfied 37.3% 57.1% 52.9% 33.3% 40.6% very satisfied 7.9% 7.1% 6.9% highly satisfied 0.8% 33.3% 1.3% Total 100.0% 100.0% 100.0% 100.0% 100.0% Table 9.12: Cross tabulation between ethnic group & satisfaction with the overall housekeeping in the building Malay Chinese Indian others Total very dissatisfied 0.8% 0.6% dissatisfied 10.3% 5.9% 8.8% neutral 37.3% 21.4% 47.1% 36.3% satisfied 46.8% 71.4% 35.3% 66.7% 48.1% very satisfied 4.0% 7.1% 5.9% 4.4% highly satisfied 0.8% 5.9% 33.3% 1.9% Total 100.0% 100.0% 100.0% 100.0% 100.0% Table 9.13: Cross tabulation ethnic group & satisfaction with the overall lift services in the building Malay Chinese Indian others Total highly dissatisfied 12.7% 5.9% 10.6% very dissatisfied 5.6% 7.1% 5.0% dissatisfied 15.1% 57.1% 11.8% 33.3% 18.8% neutral 25.4% 21.4% 58.8% 28.1% satisfied 32.5% 14.3% 23.5% 33.3% 30.0% very satisfied 7.9% 33.3% 6.9% highly satisfied 0.8% 0.6% Total 100.0% 100.0% 100.0% 100.0% 100.0%
  • 8. 9.2.3 Job Category and Satisfaction Table 9.14 shows that administrators are highly satisfied with the natural lighting available in the office. However, the chi-square value and asymptotic significance (2-sided) for cross tabulation between job category and satisfaction towards the natural lighting available in office is (χ2 = 28.57, p = 0.097). Since the p value for both cross tabulation is more than 0.05, the relationships between those variables are statistically not significant and might happen by chance (see table 9.15). Table 9.14: Cross tabulation between job category & natural lighting in the office Satisfaction Administrative Management Executive Secretarial Technical Total no info 5.4% 1.3% dissatisfied 5.6% 27.3% 20.0% 13.5% 7.0% 10.6% neutral 24.1% 18.2% 40.0% 40.5% 39.5% 33.1% satisfied 59.3% 27.3% 33.3% 29.7% 41.9% 43.1% very satisfied 11.1% 27.3% 6.7% 8.1% 11.6% 11.3% highly satisfied 2.7% 0.6% Total 100.0% 100.0% 100.0% 100.0% 100.0% 100.0% Table 9.15: Cross tabulation between job category and satisfaction Aspect Item Chi-square Asymptotic significance (2-sided) Significance Interpretation a. Satisfaction towards the natural lighting level in the office. χ2 = 28.57; p = 0.097. p > 0.05 No Association b. Satisfaction towards the thermal condition in the office. χ2 = 23.14; p = 0.282 p > 0.05 No Association c. Satisfaction towards the natural ventilation available in the office. χ2 = 42.49; p = 0.039 p < 0.05 Weak Association d. Satisfaction towards the noise level in the office. χ2 = 38.64; p = 0.001. p < 0.05 Strong Association Job descriptions BUILDING UMNO MESINIAGA IBM KOMTAR TIMA LUTH TOTAL administrative 8 7 8 17 6 8 54 management 0 4 1 0 4 2 11 executive 3 7 3 1 0 1 15 secretarial 2 2 1 19 3 10 37 technical 5 4 7 4 20 3 43 TOTAL 18 24 20 41 33 24 160 0 5 10 15 20 25 UMNO MESINIAGA IBM KOMTAR TIMA LUTH administrative management executive secretarial technical
  • 9. Respondents with technical background are highly satisfied with the thermal condition in the office (see table 9.16). The chi-square value and asymptotic significance (2-sided) for cross tabulation between job category and satisfaction towards the thermal condition in the office is (χ2 = 23.14, p = 0.282). Again the p value for both cross tabulation is more than 0.05 (see table 9.15). The relationships between those variables are statistically not significant and might happen by chance. Table 9.17 shows that administrators are highly satisfied with the natural ventilation available in the office. There is a weak association between job category and satisfaction with the natural ventilation available in office (χ2 = 42.49, p = 0.039) and between job category and level of happiness working in the building (χ2 = 26.31, p = 0.010). The p value is less than 0.05 (see table 9.15) for both cross tabulations and therefore the null hypothesis is rejected. Table 9.16: Cross tabulation between job category & thermal condition in the office Satisfaction Administrative Management Executive Secretarial Technical Total highly dissatisfied 2.3% 0.6% dissatisfied 16.7% 9.1% 6.7% 24.3% 7.0% 14.4% neutral 33.3% 45.5% 33.3% 21.6% 20.9% 28.1% satisfied 46.3% 27.3% 46.7% 45.9% 65.1% 50.0% very satisfied 1.9% 18.2% 13.3% 8.1% 2.3% 5.6% highly satisfied 1.9% 2.3% 1.3% Total 100.0% 100.0% 100.0% 100.0% 100.0% 100.0% Table 9.17: Cross tabulation between job category & natural ventilation in the office Satisfaction Administrative Management Executive Secretarial Technical Total no info 2.8% 0.6% highly dissatisfied 2.3% 0.6% very dissatisfied 8.3% 4.7% 3.1% dissatisfied 3.7% 36.4% 20.0% 38.9% 20.9% 20.1% neutral 37.0% 18.2% 46.7% 13.9% 32.6% 30.2% satisfied 51.9% 36.4% 33.3% 27.8% 30.2% 37.7% very satisfied 7.4% 9.1% 5.6% 9.3% 6.9% highly satisfied 2.8% 0.6% Total 100.0% 100.0% 100.0% 100.0% 100.0% 100.0% Table 9.18: Cross tabulation between job category & noise level in the office Satisfaction Administrative Management Executive Secretarial Technical Total dissatisfied 7.4% 2.7% 4.7% 4.4% neutral 25.9% 54.5% 20.0% 59.5% 27.9% 35.6% satisfied 64.8% 36.4% 66.7% 18.9% 58.1% 50.6% very satisfied 1.9% 9.1% 6.7% 18.9% 4.7% 7.5% highly satisfied 6.7% 4.7% 1.9% Total 100.0% 100.0% 100.0% 100.0% 100.0% 100.0%
  • 10. Executive are among the most satisfied respondents towards the noise level in the office as shown in table 9.18. Strong associations were found between job category and satisfaction with the noise level in office (χ2 = 38.64, p = 0.001). The test is significant since p is far less than 0.05 and the null hypothesis are therefore rejected for this cross tabulation. The relationships between these variables are statistically significant and do not happen by chance (see table 9.15). 9.2.4 Number of Colleague and Satisfaction This section presents chi-square test result for cross tabulation between number of colleagues working in the same room and satisfaction levels towards several architectural and environmental features asked in the questionnaires. The aim is to find a significant relationship between number of colleague and satisfaction level for all elements. Several satisfaction elements (table 9.19) were found to have a significant relationship with number of colleagues working in the same room. Table 9.19: Cross tabulation between number of colleague in the same room and satisfaction Aspect Item Chi-square Asymptotic significance (2-sided) Significance Interpretation a. Satisfaction with thermal condition in the office χ2 = 60.14 p = 0.001 p < 0.05 Strong Association b. Satisfaction level with the overall lift services in building χ2 = 68.72 p = 0.001. p < 0.05 Strong Association c. Satisfaction towards the public area spaces in the building χ2 = 56.33 p = 0.017 p < 0.05 Weak Association d. Level of happiness working in the building χ2 = 34.75 p = 0.010. p < 0.05 Weak Association Table 9.20, shows that respondents with more colleagues working in the same area are quite dissatisfied with the thermal condition in the office. The chi-square value and asymptotic significance (χ2 = 60.14, p = 0.001). The test shows that there is strong association between number of colleagues working in the same areas and satisfaction with thermal condition in the office since p is far less than 0.05. It did not happen by chance and therefore the null hypothesis is rejected for this cross tabulations. Table 9.21 shows that respondents that have a higher number of colleagues working in the same room are more dissatisfied with the public spaces in the building than those who have a lower number of colleagues working in the same room. The chi-square test shows that there is an association between number of colleagues and satisfaction with the building public area spaces. The chi-square value and asymptotic significance (2-sided) for cross tabulation
  • 11. between number of colleagues and satisfaction with the building public area spaces is (χ2 = 56.33, p = 0.017). Since p < 0.05, therefore the null hypothesis is rejected. However, table 9.22 shows that respondents with a higher number of colleagues working in the same room are happier than those who have a lower number of colleagues working in the same area. The chi-square test for this cross tabulation shows that the asymptotic significance (2-sided) for the cross tabulation is (χ2 = 34.75, p = 0.010). There is an association between these two variables since p < 0.05. It des not happen by chance and therefore the null hypothesis is rejected. Table 9.20: Satisfaction towards thermal condition in the office and number of colleagues working in the same area (cross tabulation) Satisfaction no info 0-5 6-10 11-15 16-20 21-25 >25 Total highly dissatisfied 14.3% 0.6% dissatisfied 7.7% 8.0% 19.6% 14.3% 27.3% 14.4% neutral 53.8% 36.0% 15.7% 26.1% 28.6% 62.5% 24.2% 28.1% satisfied 38.5% 48.0% 58.8% 65.2% 28.6% 37.5% 39.4% 50.0% very satisfied 8.0% 5.9% 8.7% 6.1% 5.6% highly satisfied 14.3% 3.0% 1.3% Total 100.0% 100.0% 100.0% 100.0% 100.0% 100.0% 100.0% 100.0% Table 9.21: Satisfaction towards public area spaces in the building and number of colleagues working in the same area (cross tabulation) Satisfaction no info 0-5 6-10 11-15 16-20 21-25 >25 Total highly dissatisfied 4.0% 12.5% 1.3% very dissatisfied 14.3% 0.6% dissatisfied 15.4% 4.0% 7.8% 8.7% 12.5% 12.1% 8.8% neutral 46.2% 40.0% 45.1% 30.4% 42.9% 50.0% 27.3% 38.8% satisfied 30.8% 36.0% 29.4% 39.1% 28.6% 54.5% 35.6% very satisfied 16.0% 15.7% 13.0% 14.3% 25.0% 6.1% 12.5% highly satisfied 7.7% 2.0% 8.7% 2.5% Total 100.0% 100.0% 100.0% 100.0% 100.0% 100.0% 100.0% 100.0% Table 9.22: Level of happiness working in the building and number of colleagues working in the same area (cross tabulation) Satisfaction no info 0-5 6-10 11-15 16-20 21-25 >25 Total unhappy 8.0% 3.9% 14.3% 37.5% 3.0% 5.6% neutral 38.5% 60.0% 43.1% 34.8% 57.1% 12.5% 51.5% 45.0% happy 61.5% 24.0% 45.1% 52.2% 14.3% 50.0% 27.3% 39.4% very happy 8.0% 7.8% 13.0% 14.3% 18.2% 10.0% Total 100.0% 100.0% 100.0% 100.0% 100.0% 100.0% 100.0% 100.0%
  • 12. 9.2.5 Zone Level and Satisfaction Table 9.23 shows that respondents in higher zone are more dissatisfied with the thermal condition than those in the middle and lower zones whereas table 9.24 shows that respondents in lower zone are more satisfied with the overall office environment that those in the middle and upper zones. The chi-square test shows that there is an association for cross tabulations between zone level and satisfaction with thermal condition in the office. The chi-square test for this cross tabulation shows that the asymptotic significance (2-sided) for the cross tabulation is (χ2 = 19.23, p = 0.037). Since p < 0.05, the association is statistically significant and it does not happen by chance. Therefore the null hypothesis is rejected. There is also an association between zone level and satisfaction with the overall office environment. The chi-square test for this cross tabulation shows that the asymptotic significance (2-sided) for the cross tabulation is (χ2 = 20.24, p = 0.027) and p < 0.05. The association is statistically significant and it does not happen by chance, therefore the null hypothesis is rejected (see table 9.25). Table 9.23: Satisfaction towards thermal condition in the office by zone level Satisfaction Lower Zone Middle Zone Higher Zone Total highly dissatisfied 1.5% 0.6% dissatisfied 12.3% 9.1% 25.0% 14.4% neutral 23.1% 25.5% 40.0% 28.1% satisfied 53.8% 63.6% 25.0% 50.0% very satisfied 7.7% 1.8% 7.5% 5.6% highly satisfied 1.5% 2.5% 1.3% Total 100.0% 100.0% 100.0% 100.0% Table 9.24: Satisfaction with overall office environment by zone level Satisfaction Lower Zone Middle Zone Higher Zone Total highly dissatisfied 1.8% 0.6% dissatisfied 4.6% 5.5% 3.8% neutral 46.2% 20.0% 30.0% 33.1% satisfied 23.1% 50.9% 52.5% 40.0% very satisfied 21.5% 14.5% 15.0% 17.5% highly satisfied 4.6% 7.3% 2.5% 5.0% Total 100.0% 100.0% 100.0% 100.0% Table 9.25: Cross tabulation between zone level and satisfaction Aspect Item Chi-square Asymptotic significance (2-sided) Significance Interpretation Satisfaction with thermal condition in the office χ2 =19.23 p = 0.037 p < 0.05 Weak Association Satisfaction with the overall office environment χ2 = 20.24 p = 0.027 p < 0.05 Weak Association
  • 13. 9.3 Summary and Conclusion All the relationships between tested variables are shown in figure 9.1. The statistical analyses for various cross tabulation in this chapter show the following results:  Male respondents have higher satisfaction level towards the window available in their office than the female. The relationship between two variables is statistically significant which means it does not happen by chance and the null hypothesis is rejected. There is a weak association between gender and satisfaction with the availability of a window in the office.  There is a strong association between gender and satisfaction with thermal condition in the office. Female respondents have lower satisfaction levels than the males.  The chi-square test shows that there is an association between job category and satisfaction with the natural ventilation available in office and between job category and level of happiness working in the building. Administrators are highly satisfied with the natural ventilation in the office space.  Executives are among the most satisfied respondents towards the noise level in the office. The relationships between these variables are statistically significant and do not happen by chance. The relationship between the two variables is strong.  Respondents with more colleagues working in the same area are quite dissatisfied with the thermal condition in the office. The chi-square test shows that there is strong association between number of colleagues working in the same areas and satisfaction towards thermal condition in the office. This association does not happen by chance and the null hypothesis is rejected for this cross tabulations.  Respondents who have a higher number of colleagues working in the same room are more dissatisfied with the public spaces in the building than those who have a lower number of colleagues working in the same room. The chi-square test shows that there is an association between number of colleagues and satisfaction with the building public area spaces.
  • 14. Figure 9.1: Statistical significant diagram for respondents and satisfactions  Respondents with a higher number of colleagues working in the same room are happier than those who have a lower number of colleagues working in the same area. The chi- square test for this cross tabulation shows that there is an association between these two variables. It is statistically significant and does not happen by chance.
  • 15.  Respondents in higher zone are more dissatisfied with the thermal condition than those in the middle and lower zones. The chi-square test shows that there is an association for cross tabulations between zone level and satisfaction with thermal condition in the office. The chi-square test for this cross tabulation shows that the association is statistically significant and it does not happen by chance.  Respondents in lower zone are more satisfied with the overall office environment than those in the middle and upper zones. The chi-square test for this cross tabulation shows that it is statistically significant and it does not happen by chance. Therefore the null hypothesis is rejected.