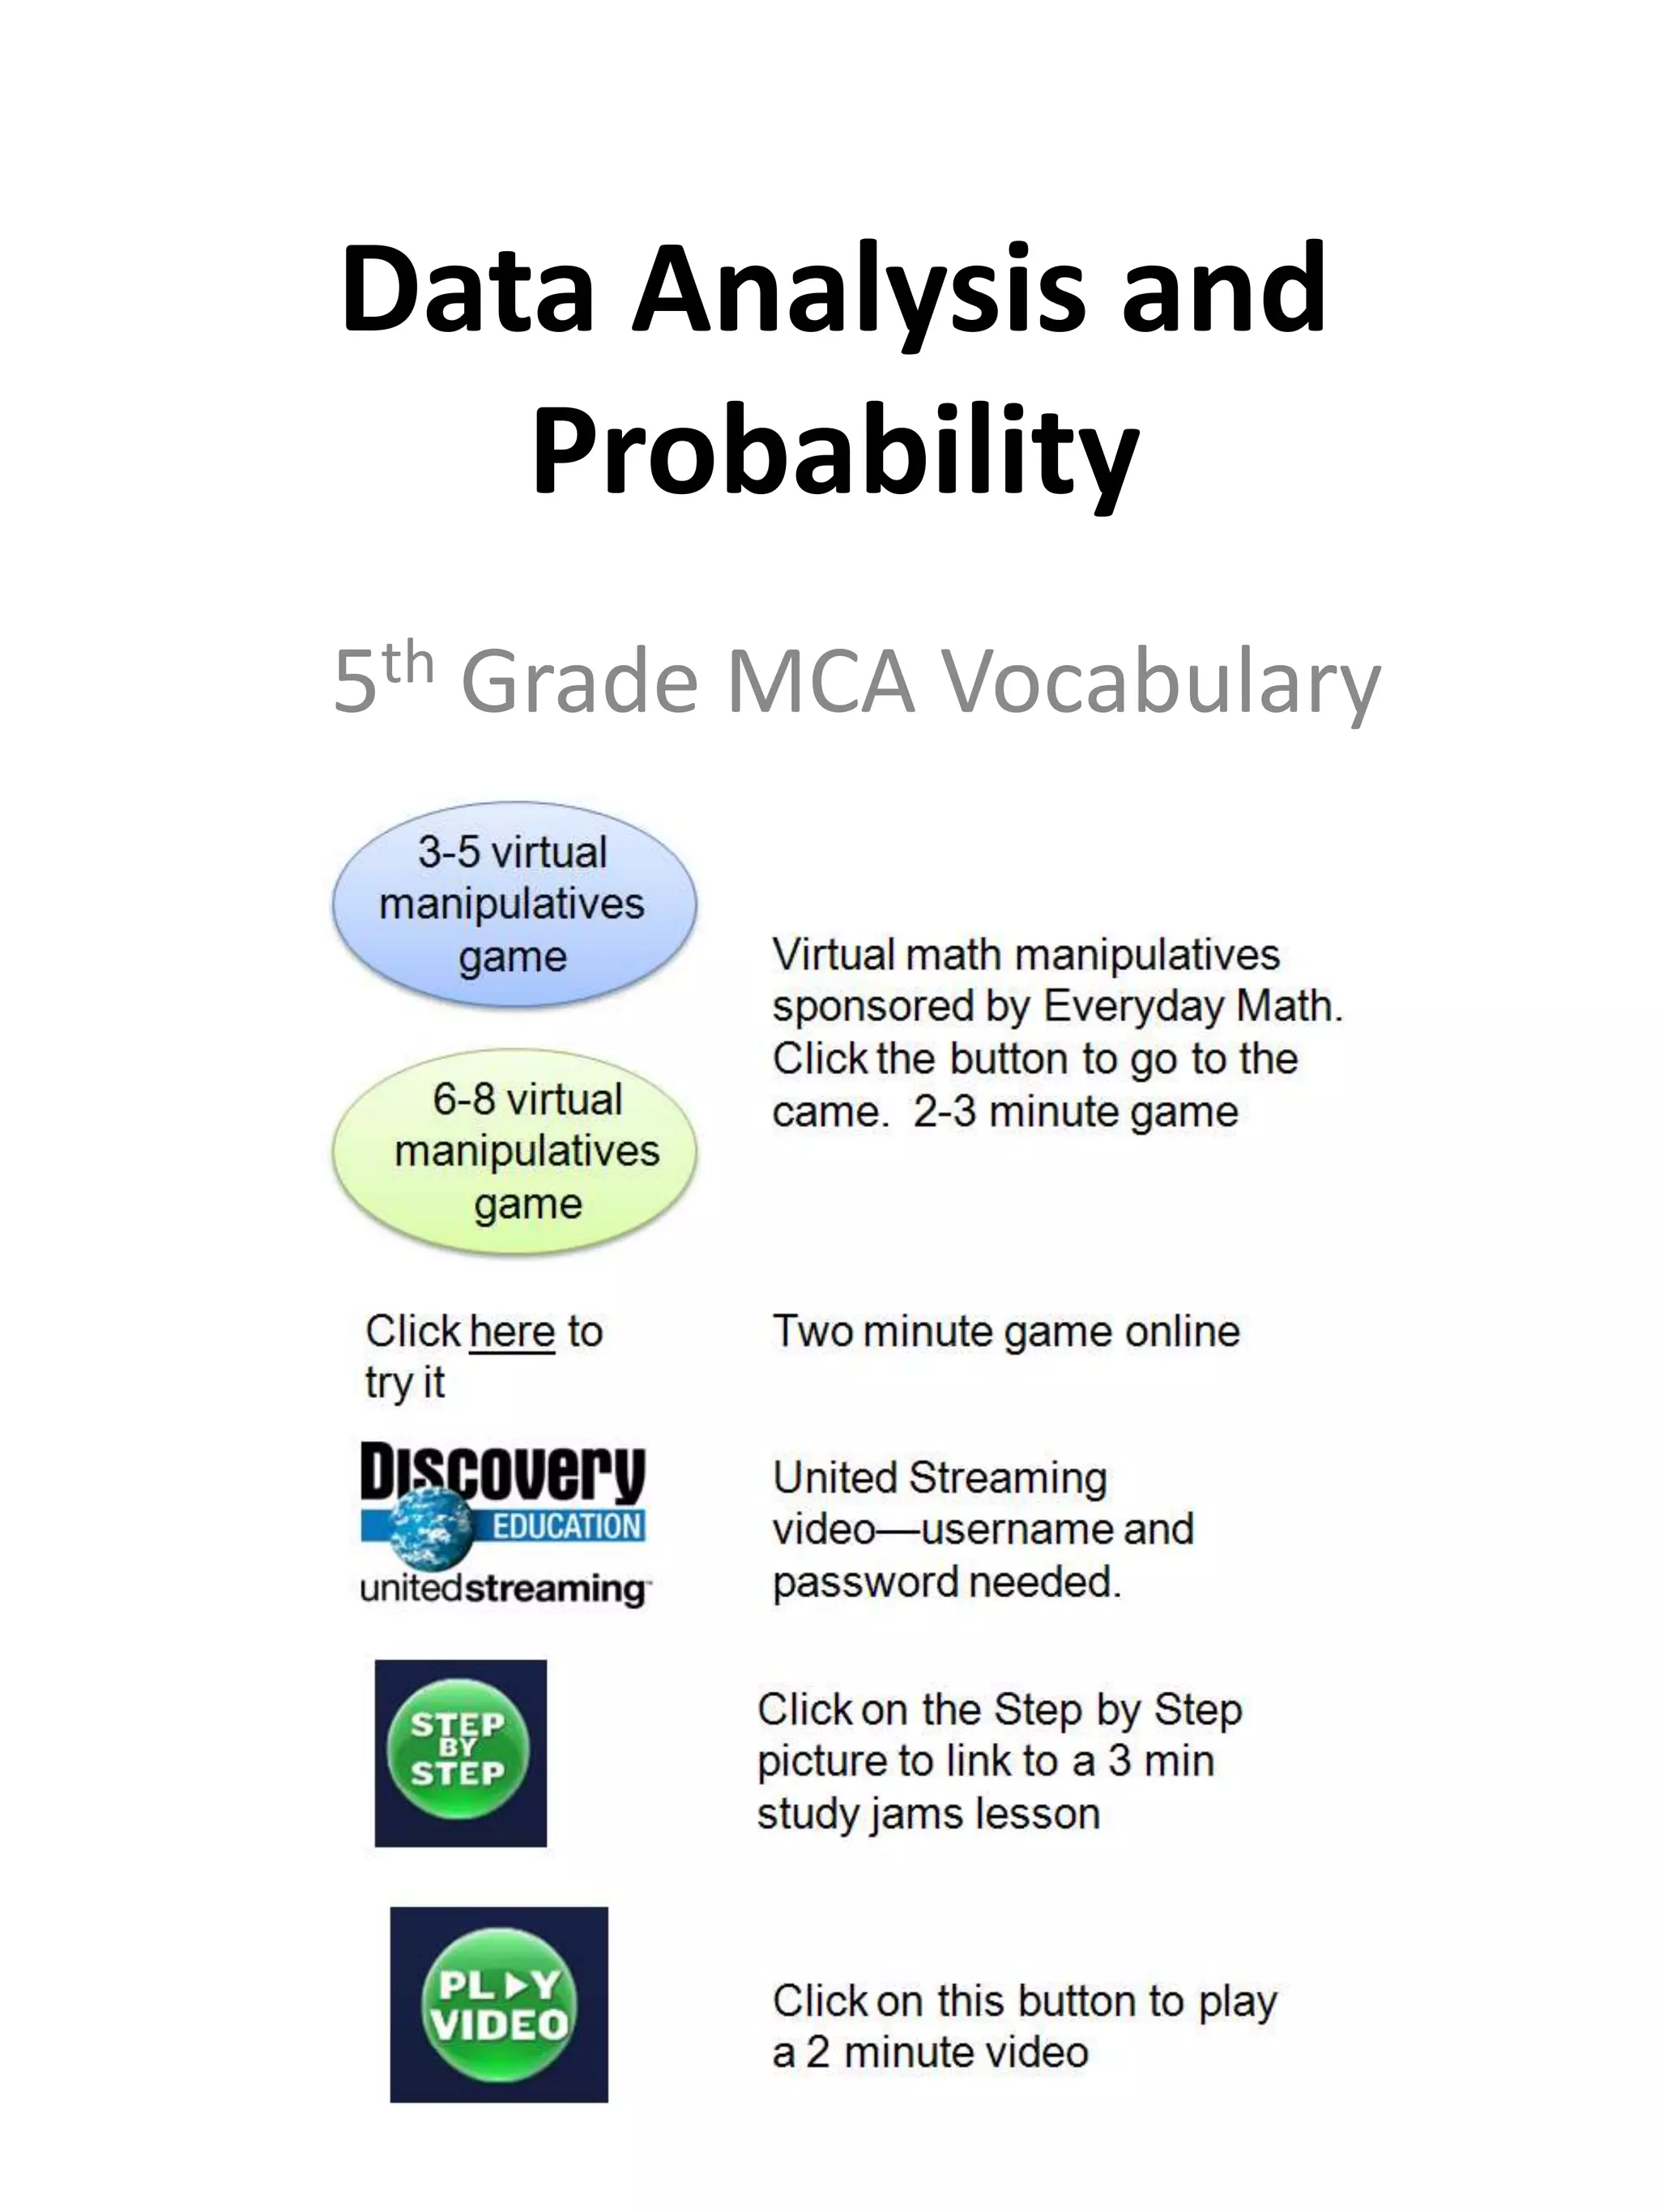
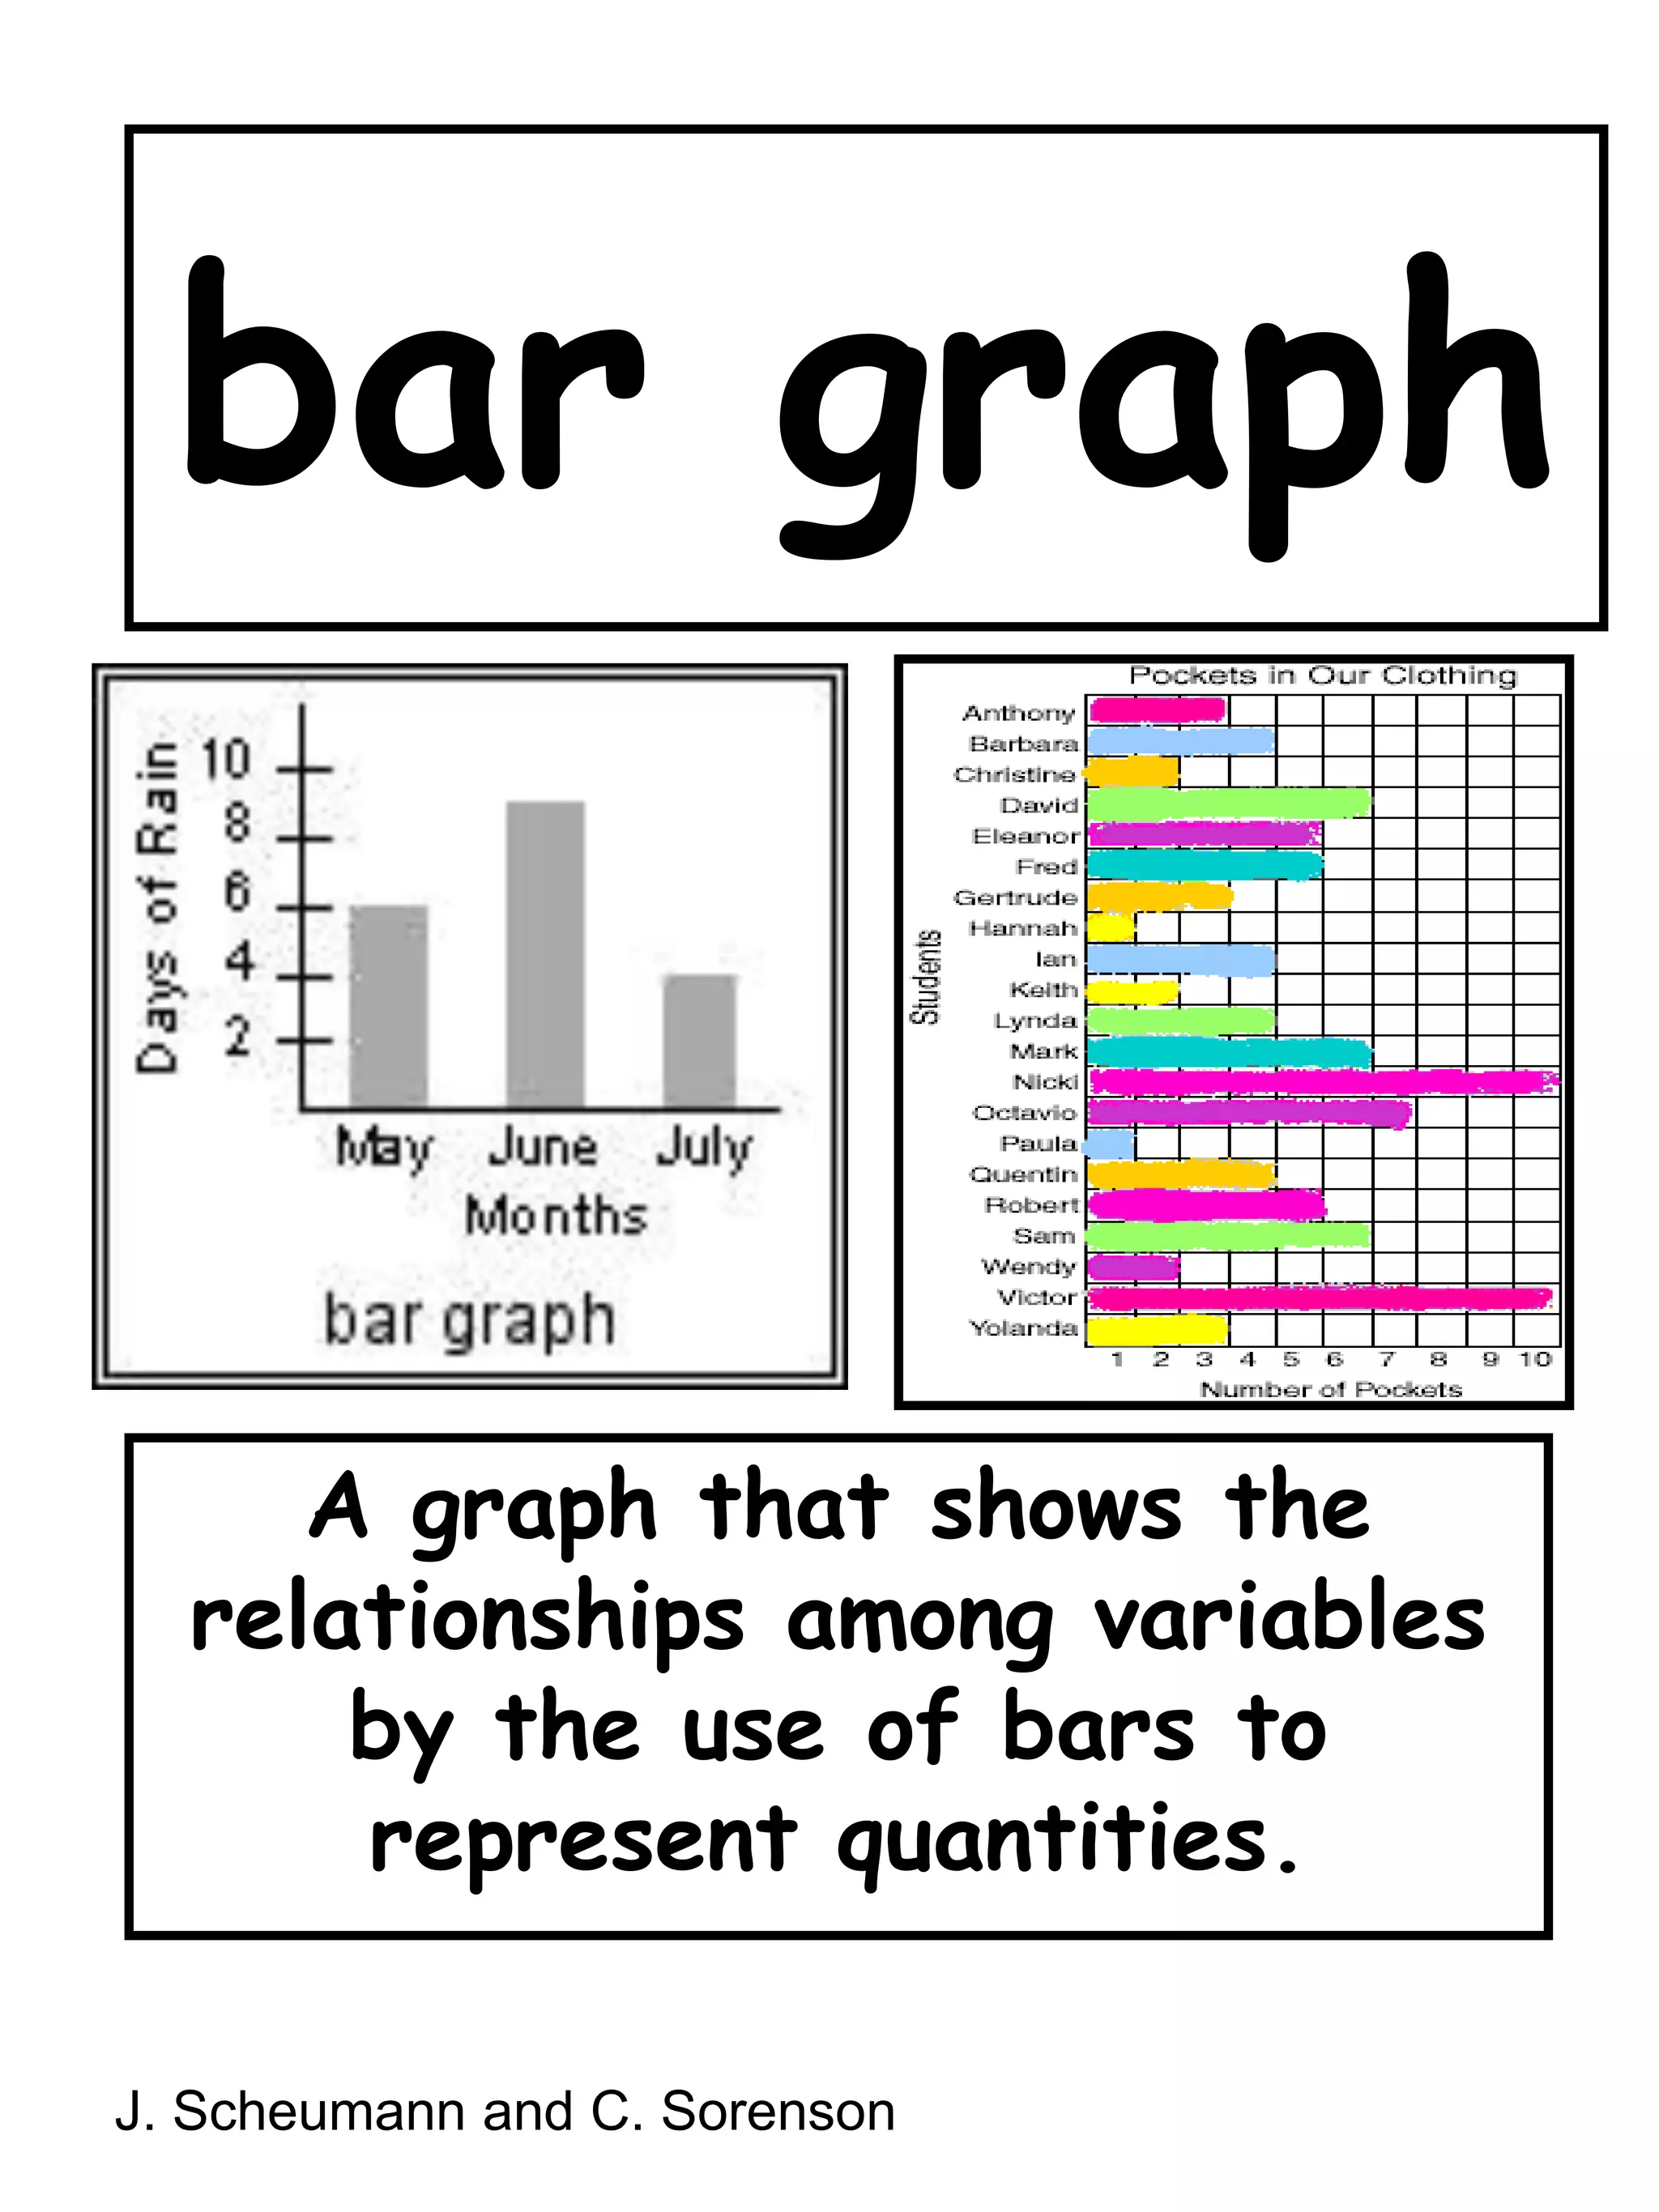
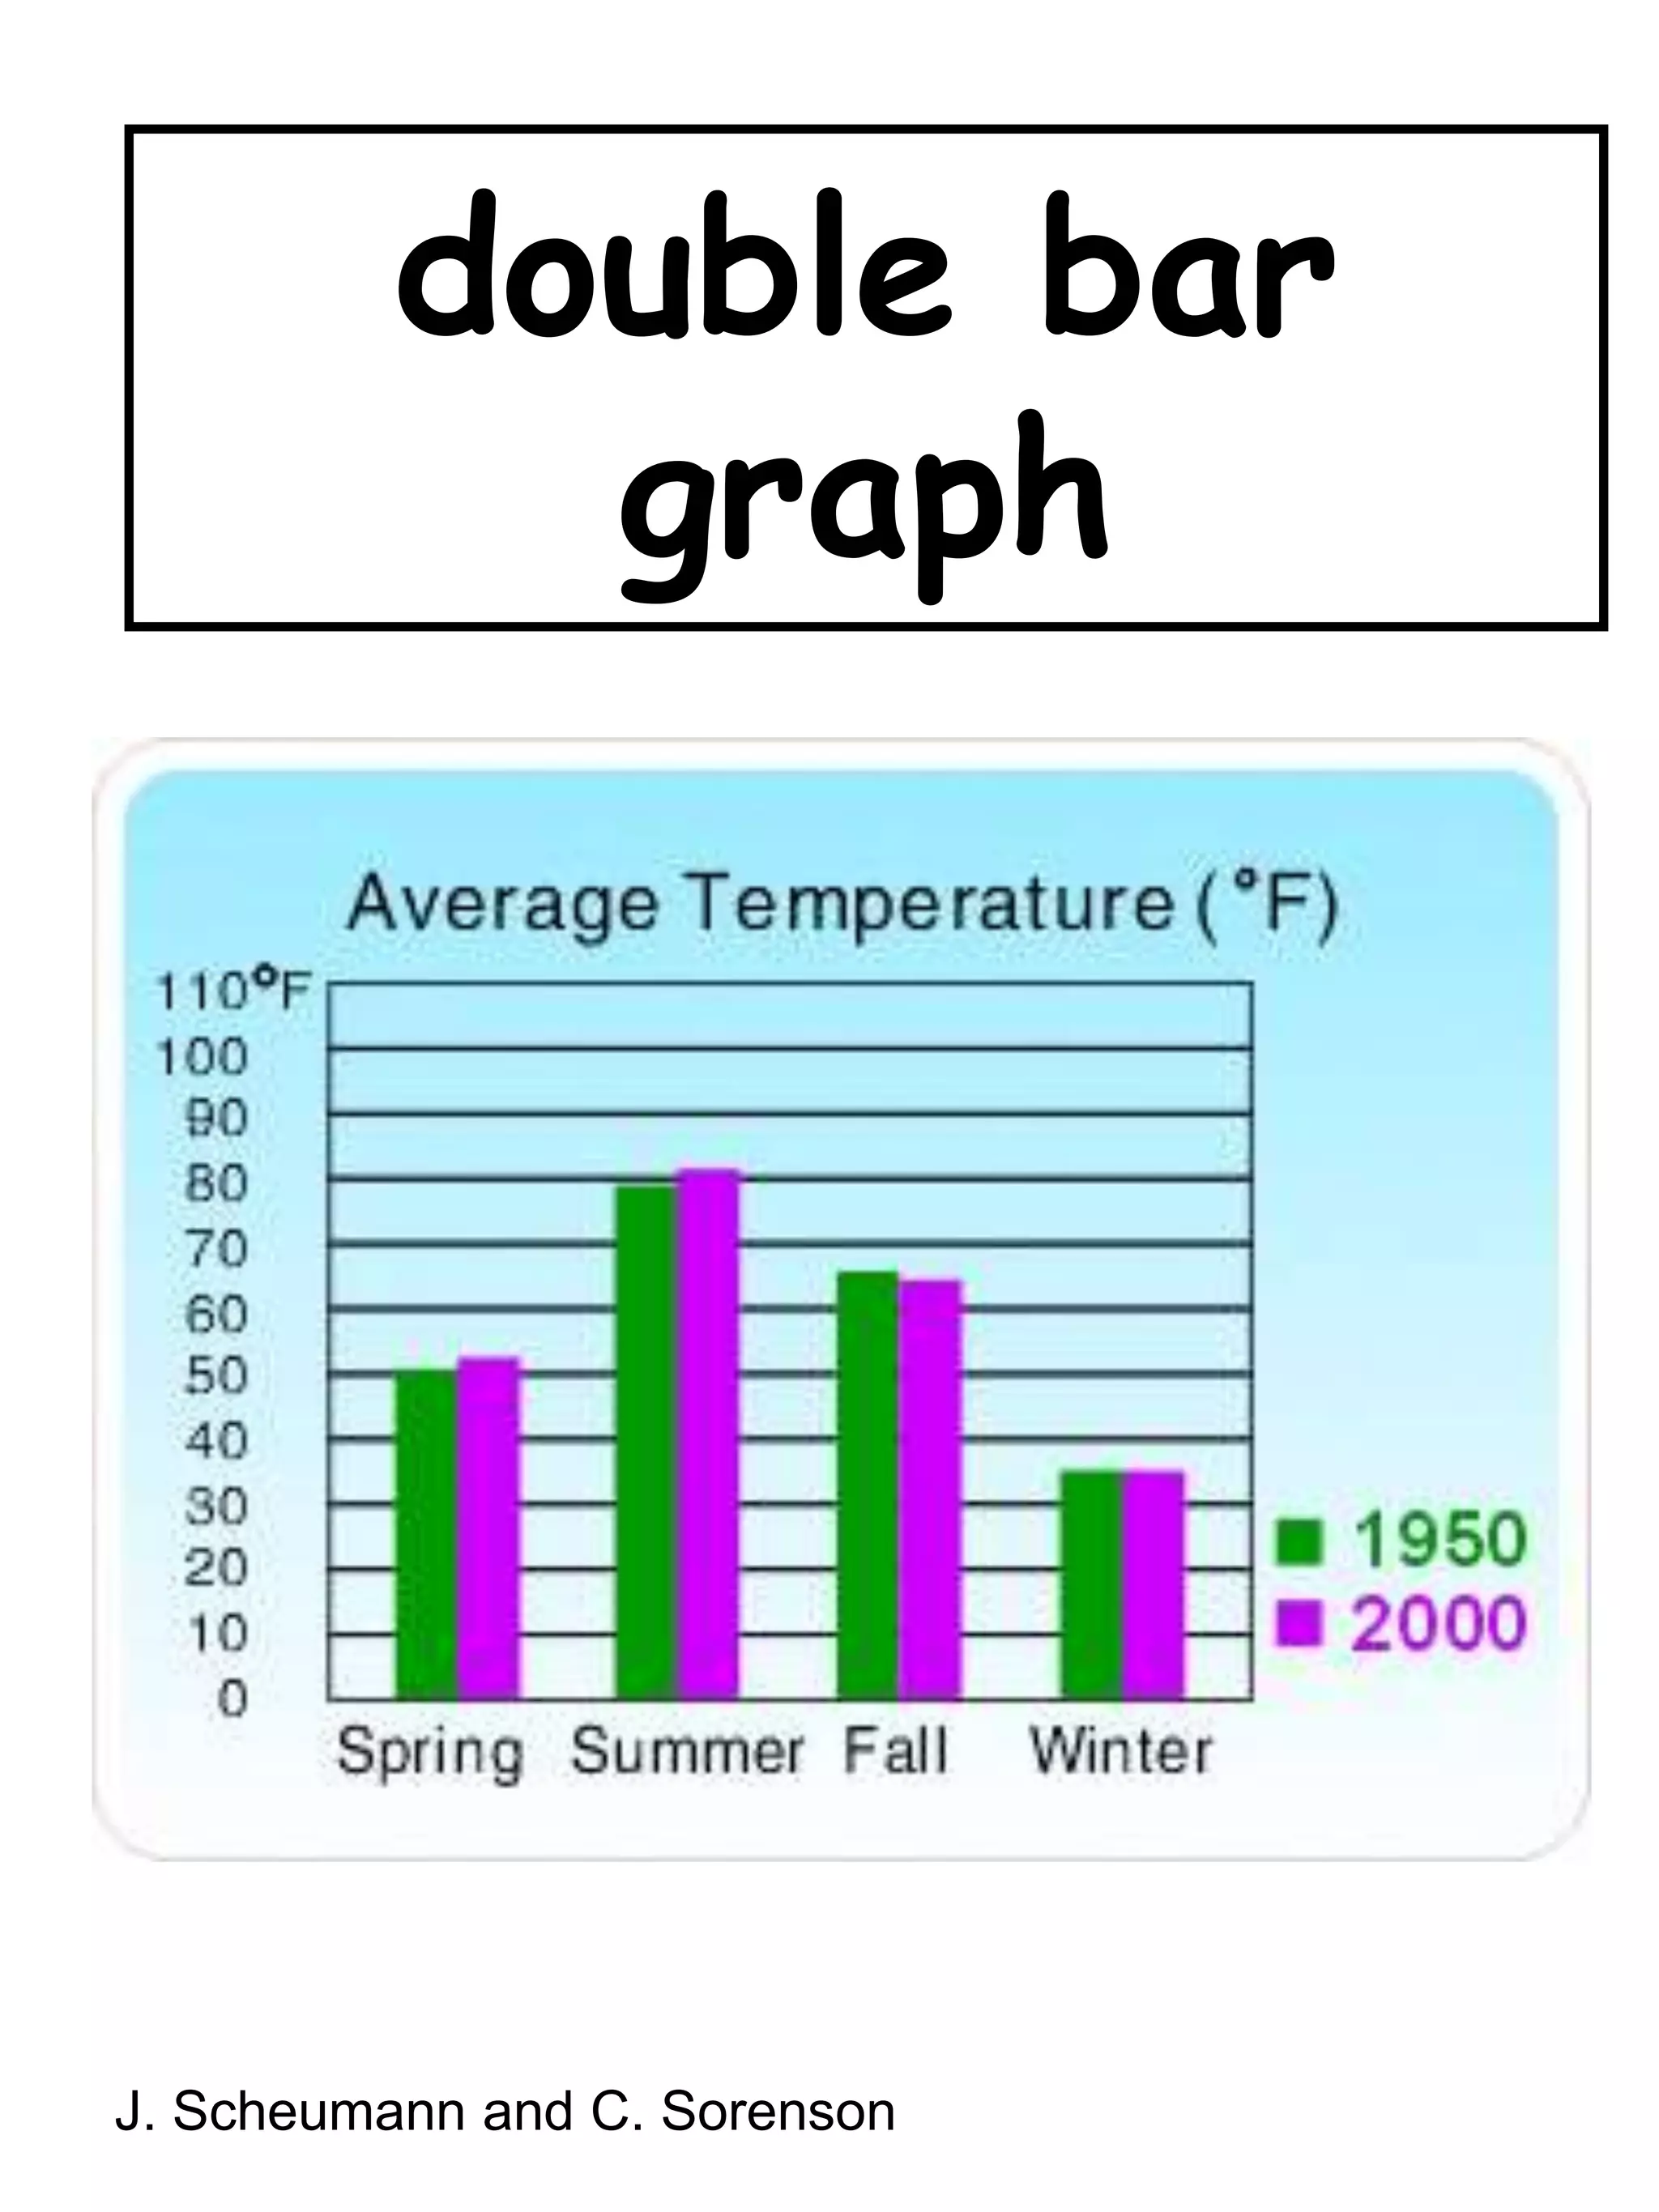
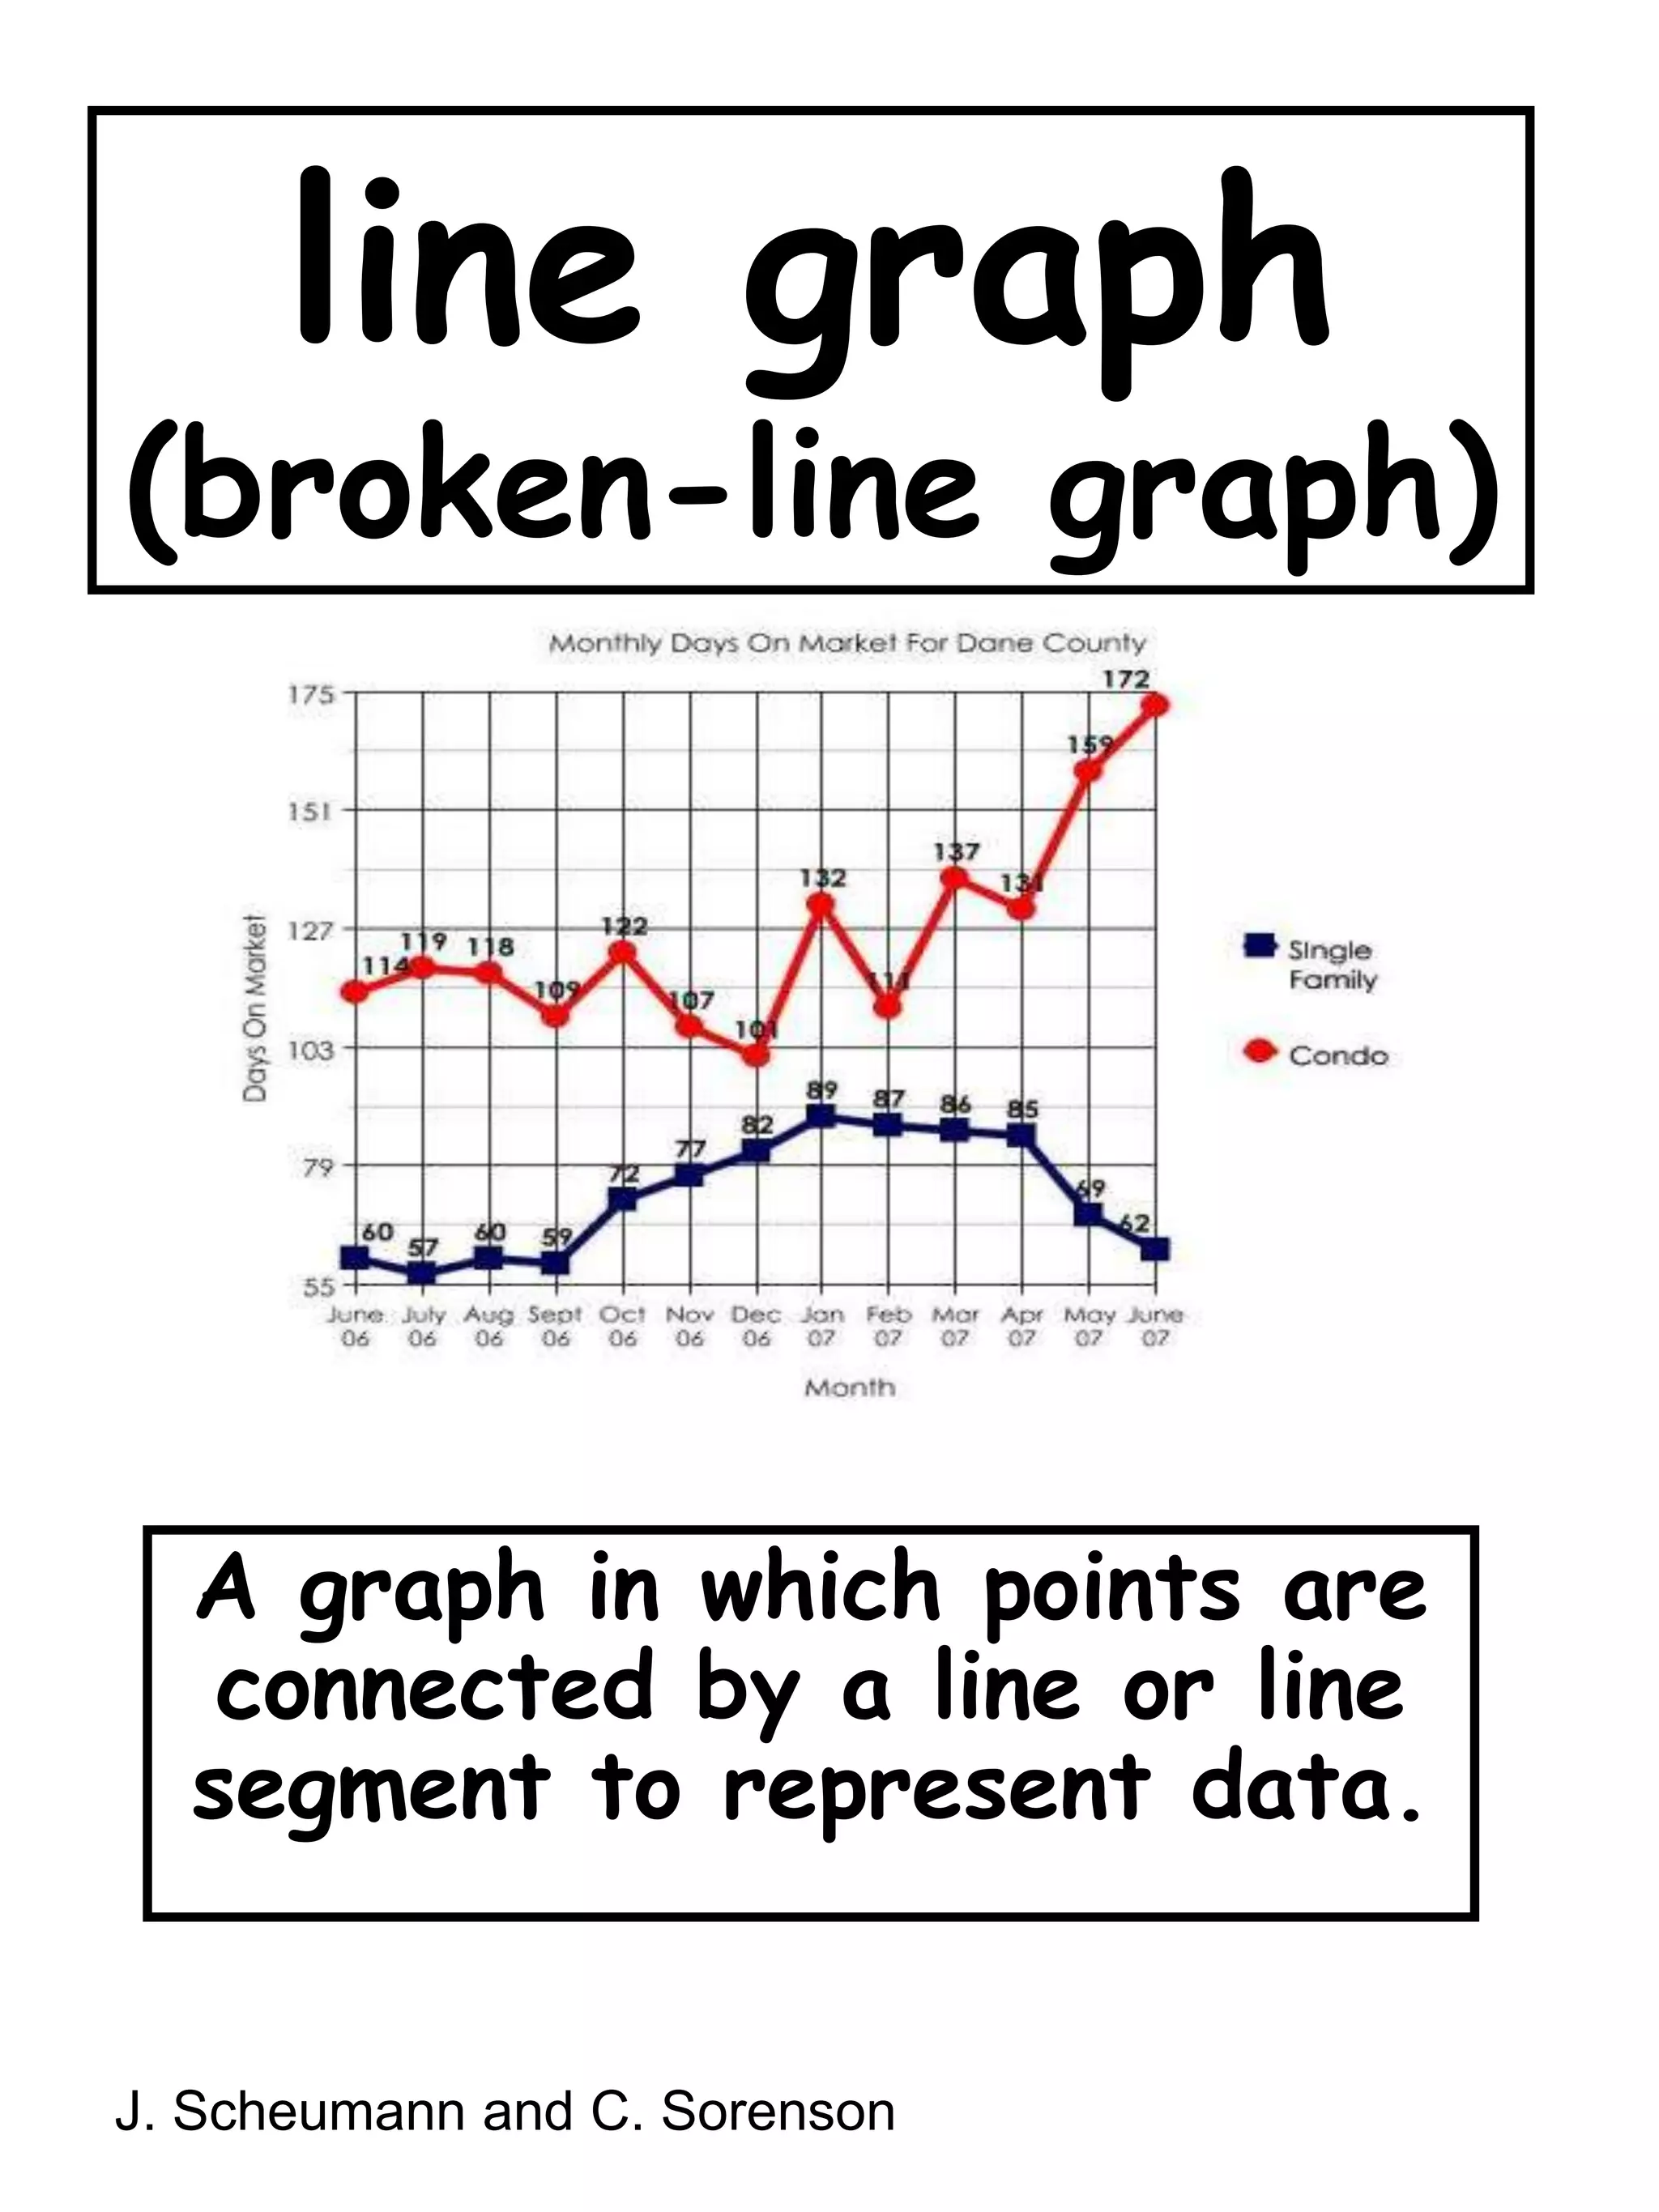
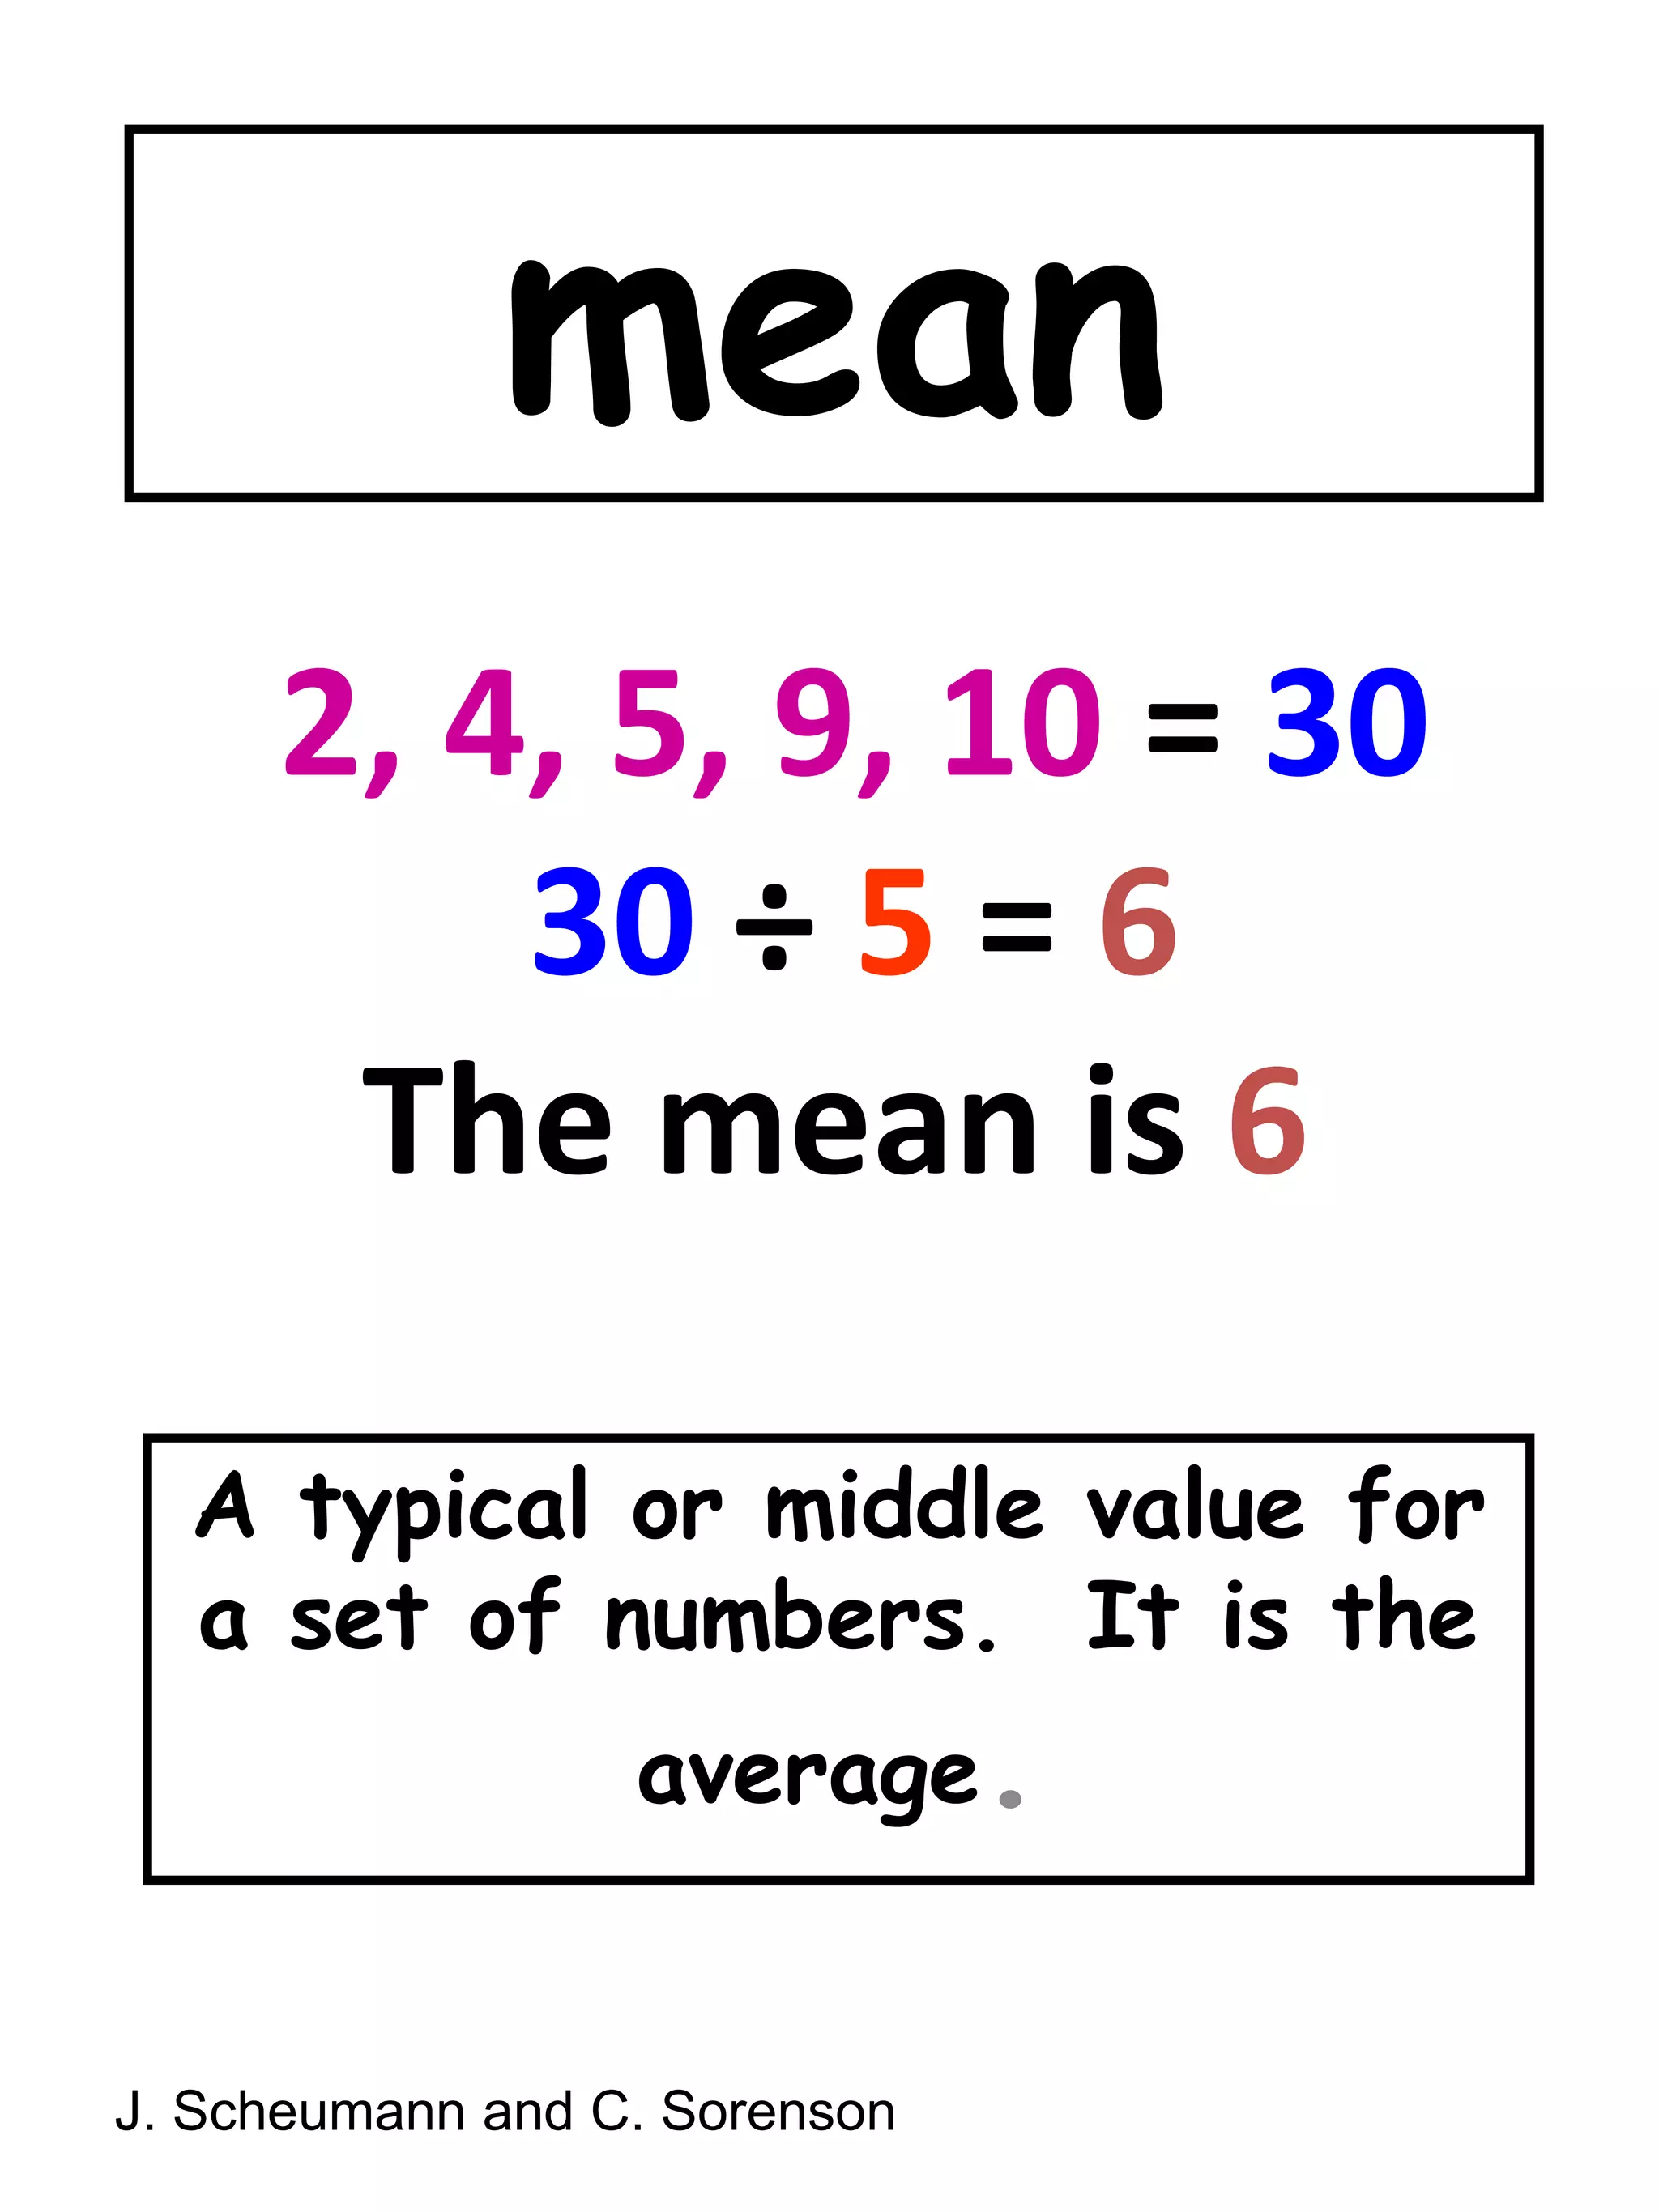
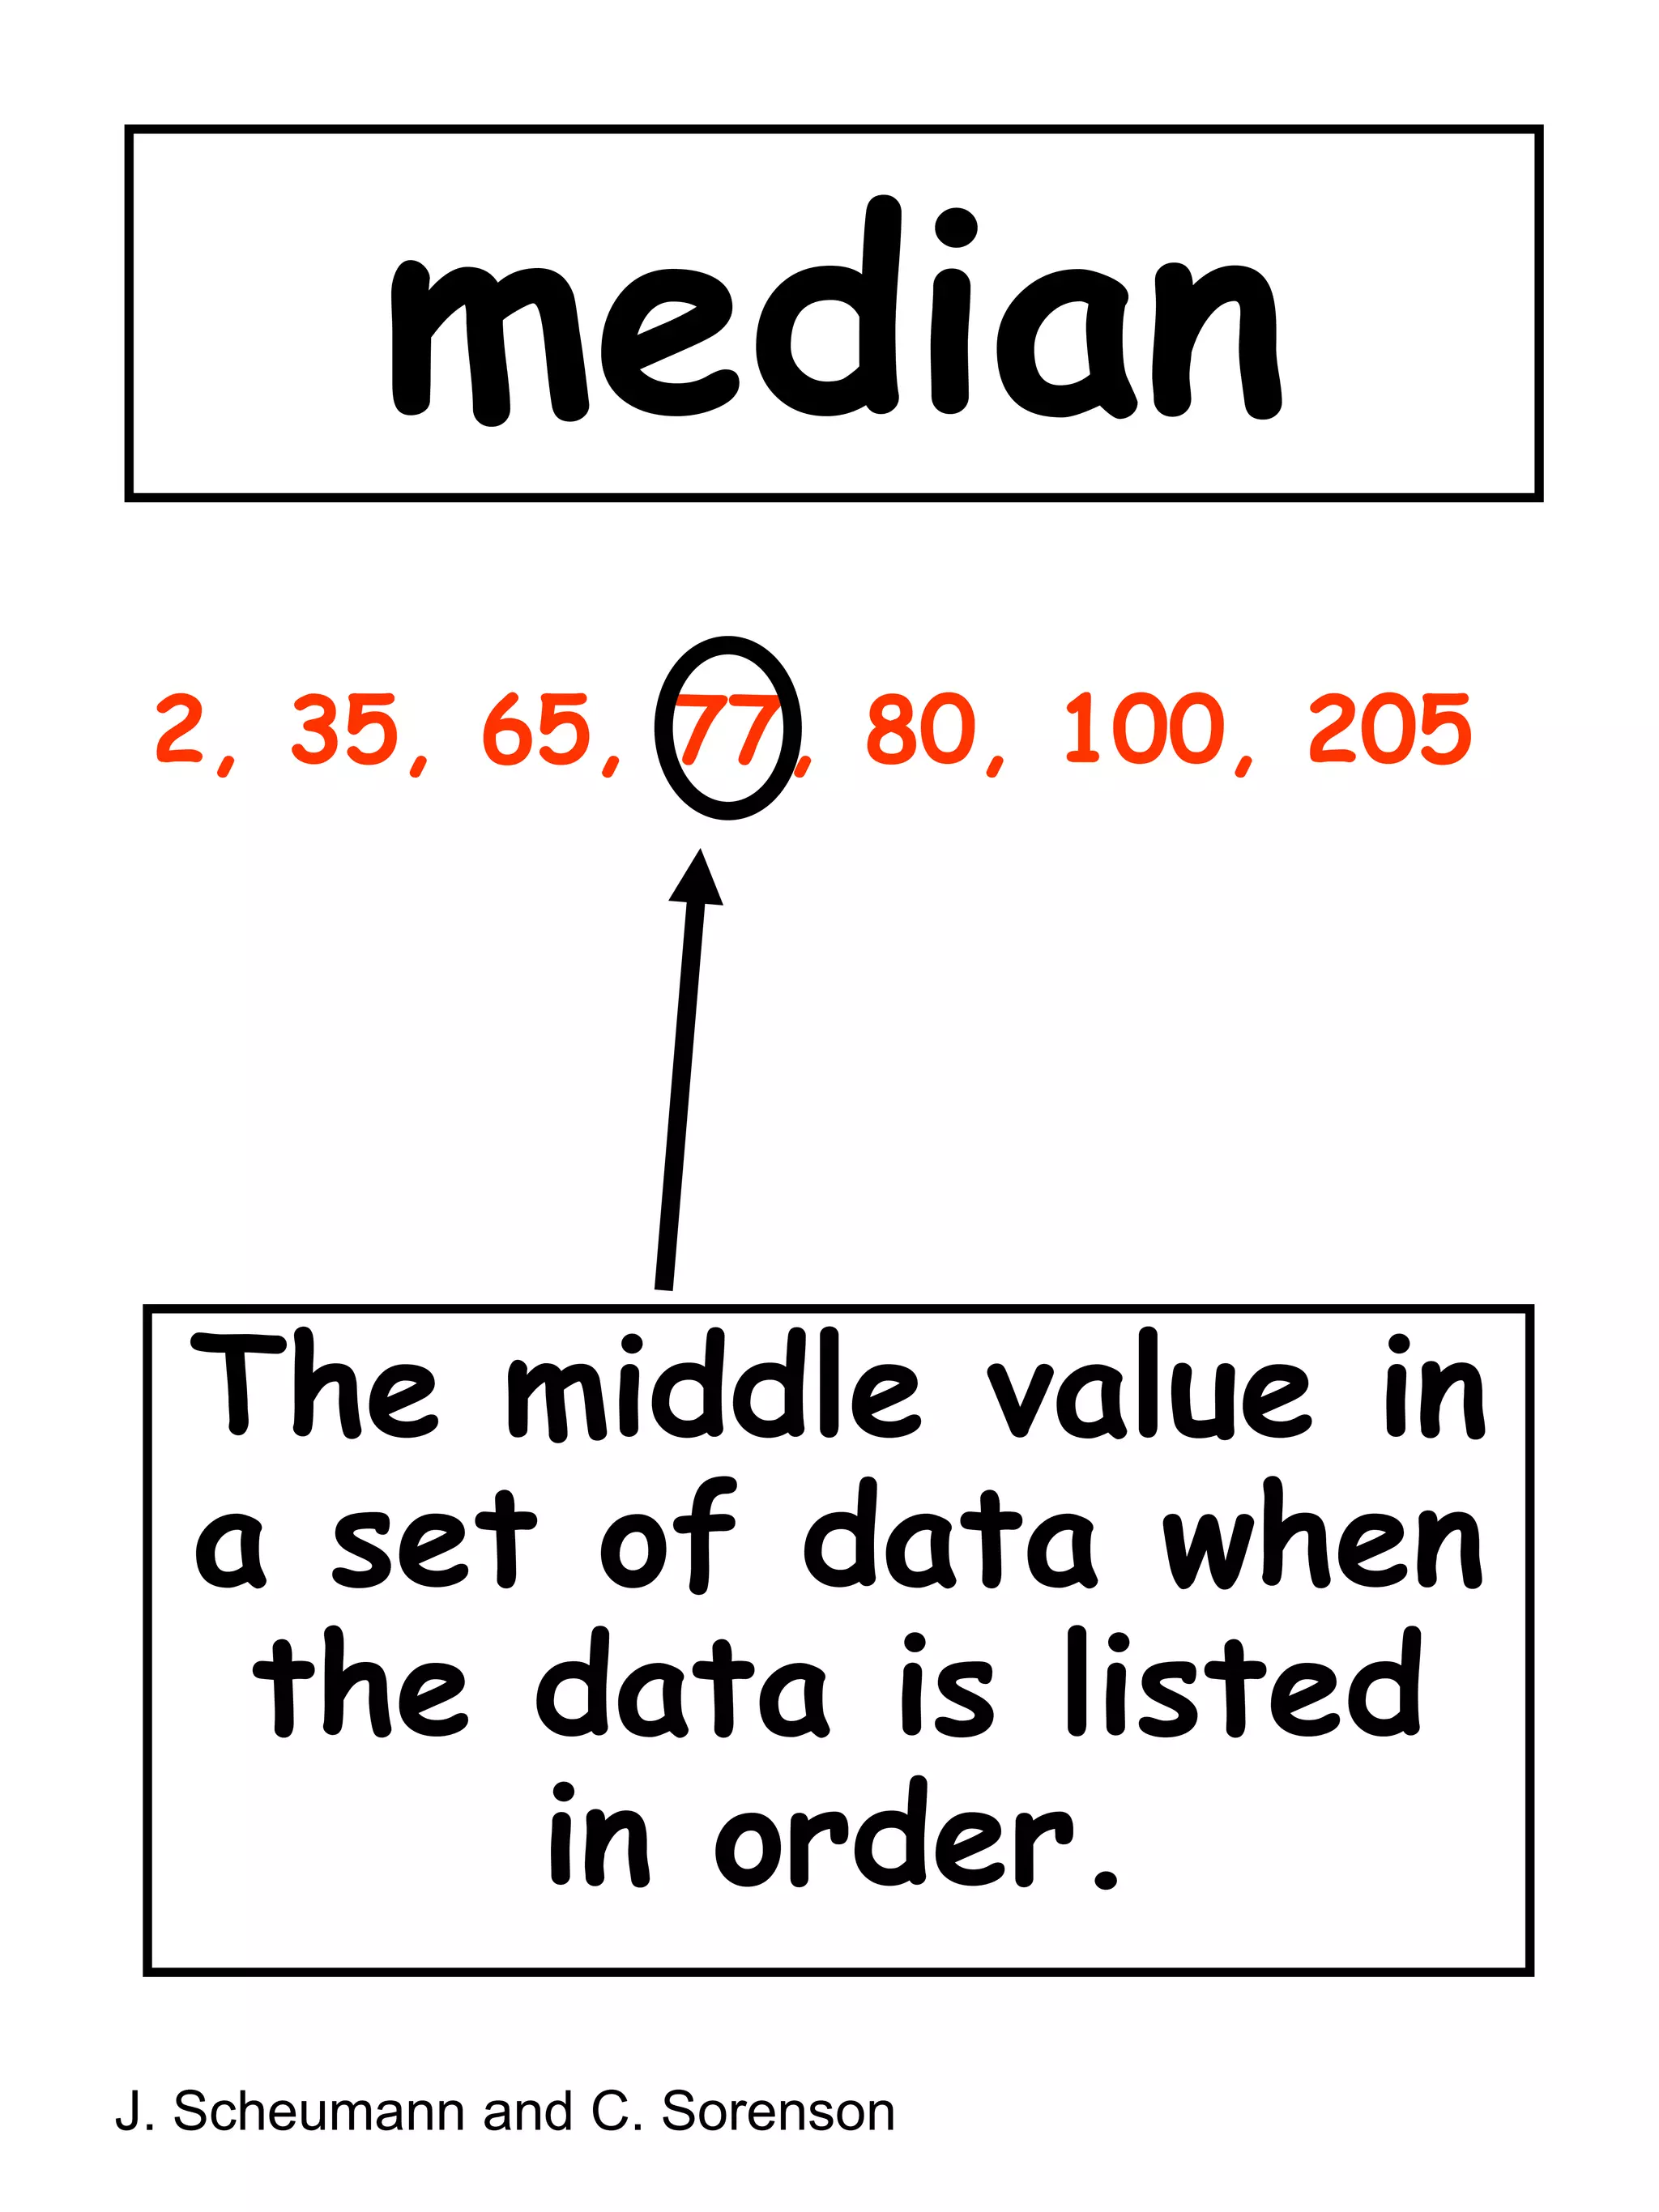
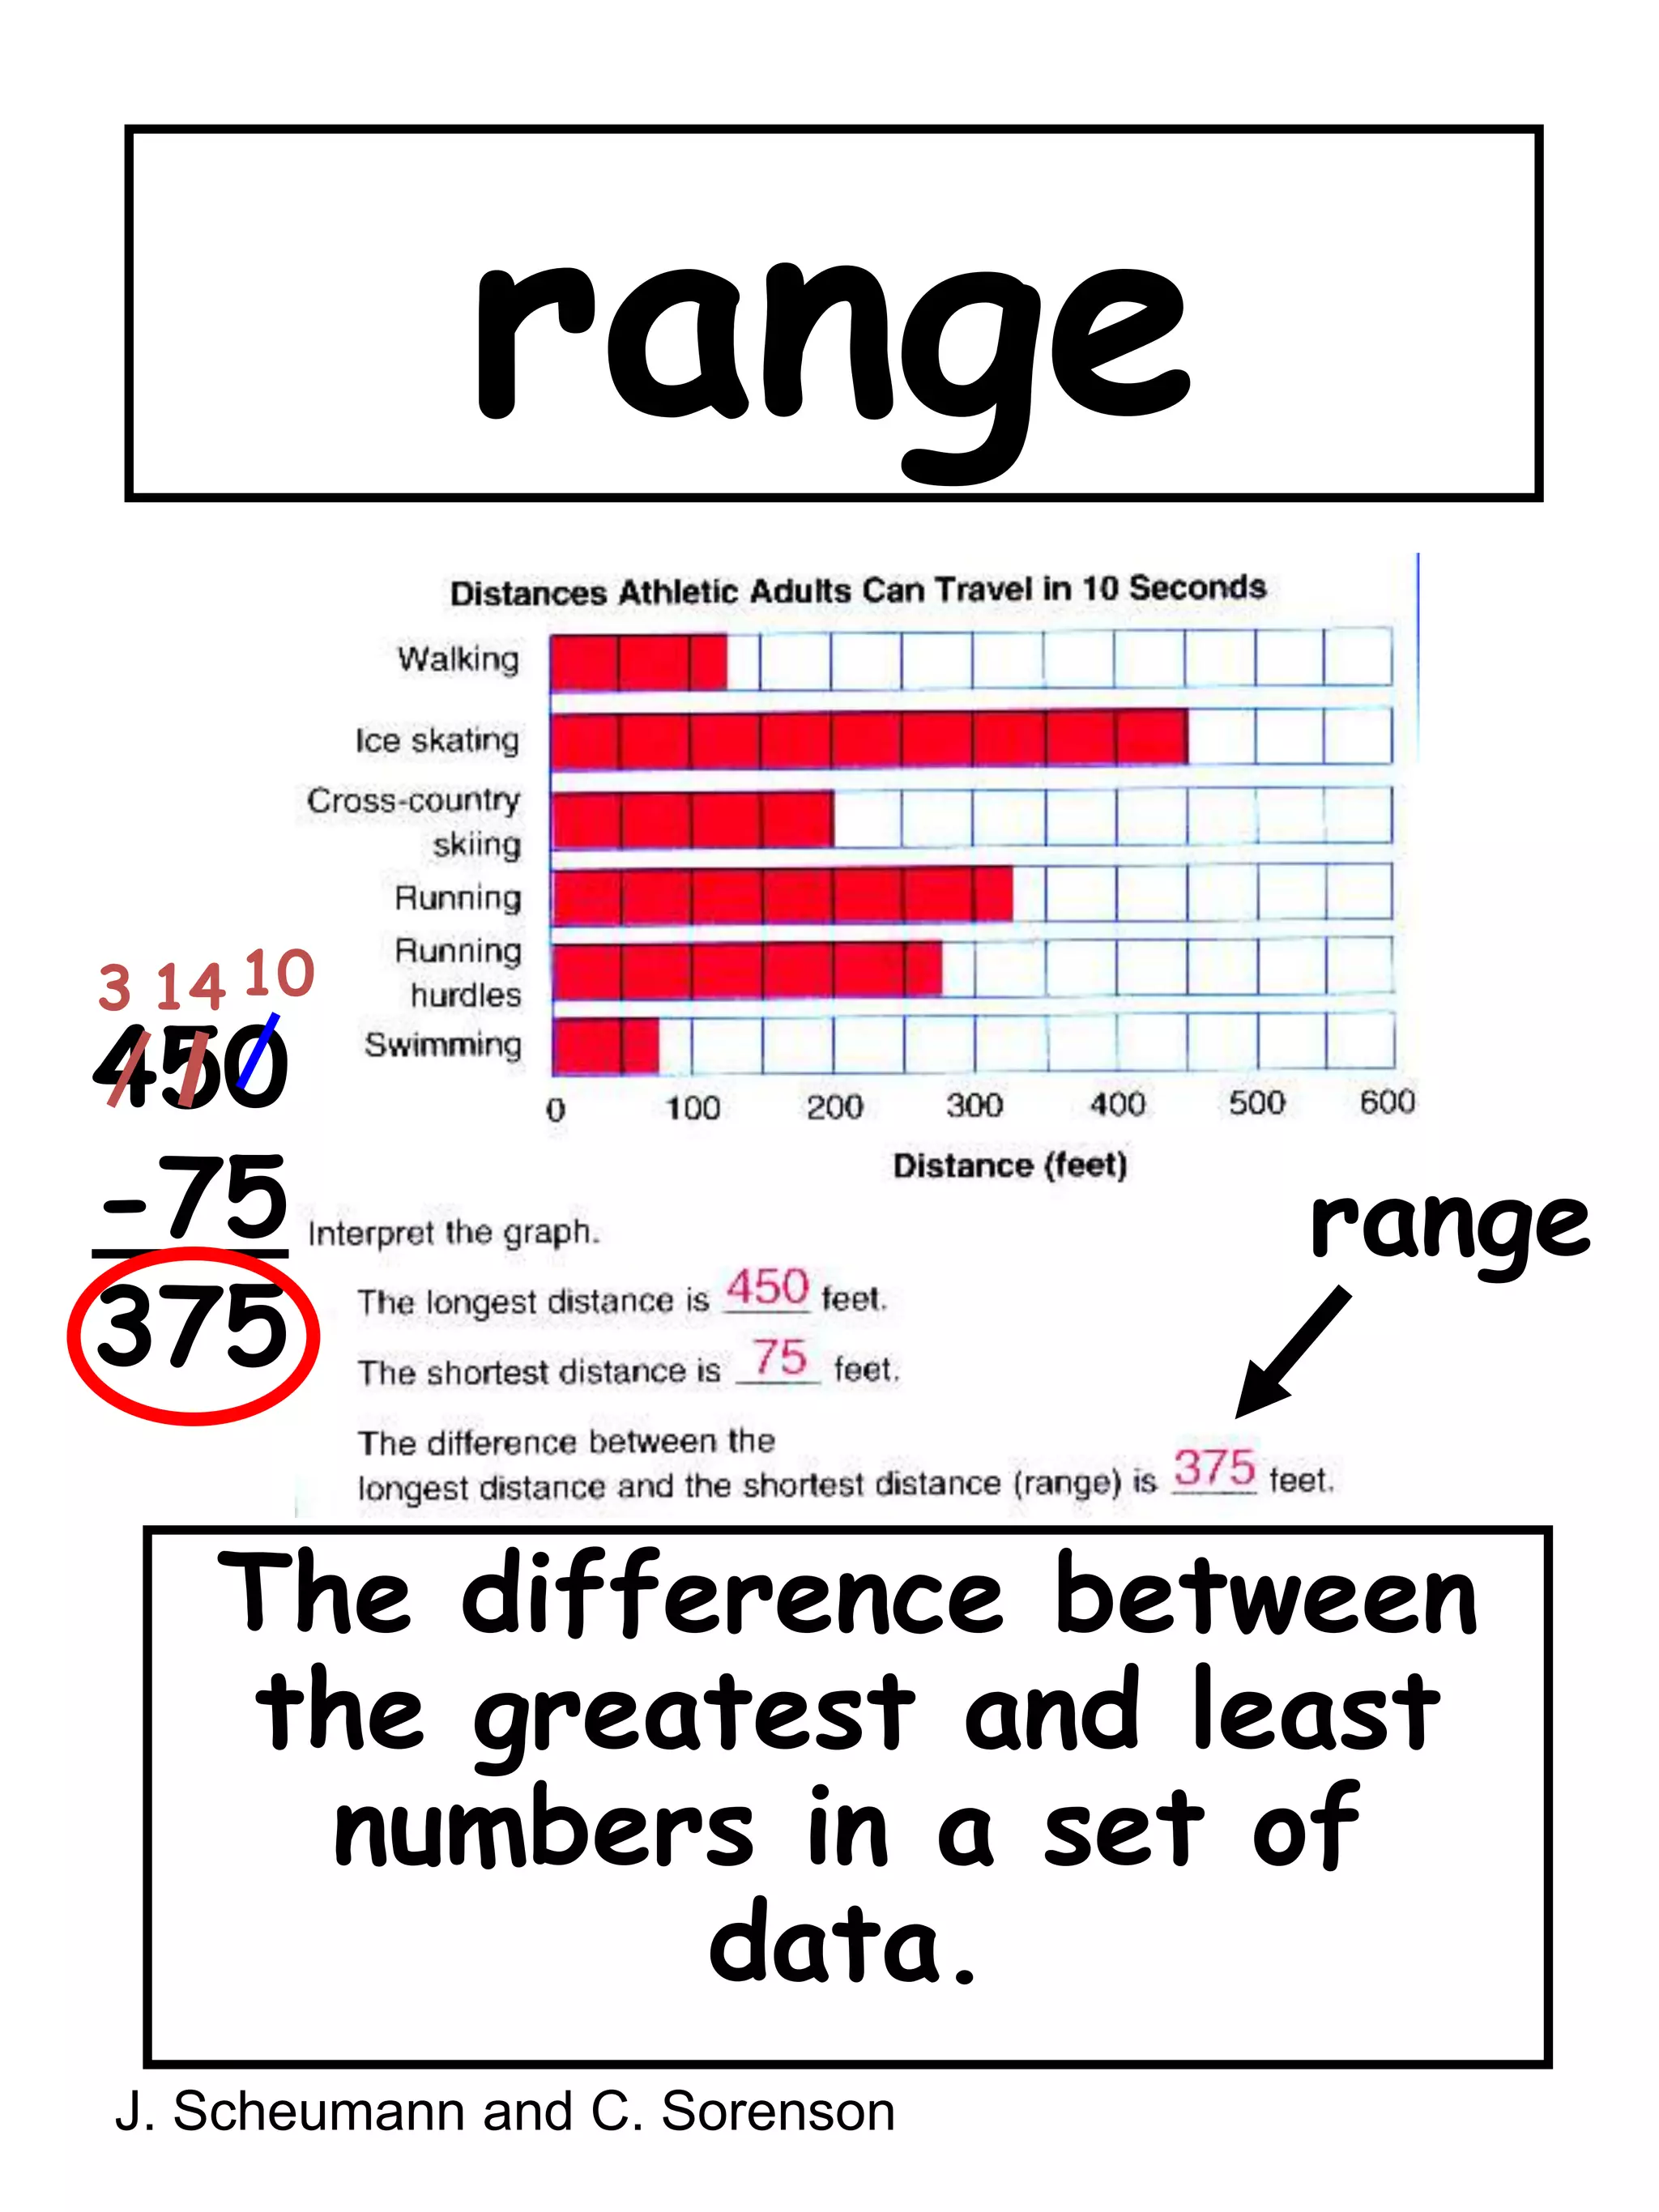
Data Analysis and Probability5th Grade MCA Vocabulary
bar graphA graph that shows the relationships among variables by the use of bars to represent quantities.J. Scheumann and C. Sorenson
double bar graphJ. Scheumann and C. Sorenson
line graph(broken-line graph)A graph in which points are connected by a line or line segment to represent data.J. Scheumann and C. Sorenson
mean2, 4, 5, 9, 10 = 3030 ÷ 5 = 6The mean is 6 A typical or middle value for a set of numbers.  It is the average.J. Scheumann and C. Sorenson
median2, 35, 65, 77, 80, 100, 205The middle value in a set of data when the data is listed in order.J. Scheumann and C. Sorenson
range10143450-75375rangeThe difference between the greatest and least numbers in a set of data.J. Scheumann and C. Sorenson
minimum{3, 2, 8, 1, 9, 2}is 1The smallest number in a set.
maximum{3, 2, 8, 1, 9, 2}is 9The largest amount; the greatest number in a set of data.J. Scheumann and C. Sorenson

5 data analysis and probability

  • 1.
    Data Analysis andProbability5th Grade MCA Vocabulary
  • 2.
    bar graphA graphthat shows the relationships among variables by the use of bars to represent quantities.J. Scheumann and C. Sorenson
  • 3.
    double bar graphJ.Scheumann and C. Sorenson
  • 4.
    line graph(broken-line graph)Agraph in which points are connected by a line or line segment to represent data.J. Scheumann and C. Sorenson
  • 5.
    mean2, 4, 5,9, 10 = 3030 ÷ 5 = 6The mean is 6 A typical or middle value for a set of numbers. It is the average.J. Scheumann and C. Sorenson
  • 6.
    median2, 35, 65,77, 80, 100, 205The middle value in a set of data when the data is listed in order.J. Scheumann and C. Sorenson
  • 7.
    range10143450-75375rangeThe difference betweenthe greatest and least numbers in a set of data.J. Scheumann and C. Sorenson
  • 8.
    minimum{3, 2, 8,1, 9, 2}is 1The smallest number in a set.
  • 9.
    maximum{3, 2, 8,1, 9, 2}is 9The largest amount; the greatest number in a set of data.J. Scheumann and C. Sorenson