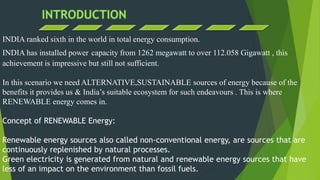
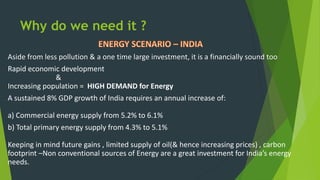
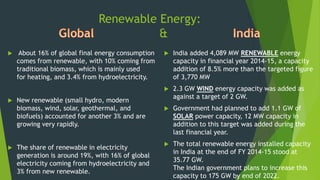
INDIA ranked sixth in the world in total energy consumption.
INDIA has installed power capacity from 1262 megawatt to over 112.058 Gigawatt , this
achievement is impressive but still not sufficient.
In this scenario we need ALTERNATIVE,SUSTAINABLE sources of energy because of the
benefits it provides us & India’s suitable ecosystem for such endeavours . This is where
RENEWABLE energy comes in.
Concept of RENEWABLE Energy:
Renewable energy sources also called non-conventional energy, are sources that are
continuously replenished by natural processes.
Green electricity is generated from natural and renewable energy sources that have
less of an impact on the environment than fossil fuels.
Aside from less pollution & a one time large investment, it is a financially sound too
Rapid economic development
&
Increasing population = HIGH DEMAND for Energy
A sustained 8% GDP growth of India requires an annual increase of:
a) Commercial energy supply from 5.2% to 6.1%
b) Total primary energy supply from 4.3% to 5.1%
Keeping in mind future gains , limited supply of oil(& hence increasing prices) , carbon
footprint –Non conventional sources of Energy are a great investment for India’s energy
needs.
Why do we need it ?
Renewable Energy:
&
 About 16% of global final energy consumption
comes from renewable, with 10% coming from
traditional biomass, which is mainly used
for heating, and 3.4% from hydroelectricity.
 New renewable (small hydro, modern
biomass, wind, solar, geothermal, and
biofuels) accounted for another 3% and are
growing very rapidly.
 The share of renewable in electricity
generation is around 19%, with 16% of global
electricity coming from hydroelectricity and
3% from new renewable.
 India added 4,089 MW RENEWABLE energy
capacity in financial year 2014-15, a capacity
addition of 8.5% more than the targeted figure
of 3,770 MW
 2.3 GW WIND energy capacity was added as
against a target of 2 GW.
 Government had planned to add 1.1 GW of
SOLAR power capacity, 12 MW capacity in
addition to this target was added during the
last financial year.
 The total renewable energy installed capacity
in India at the end of FY 2014-15 stood at
35.77 GW.
The Indian government plans to increase this
capacity to 175 GW by end of 2022.
Types of Non conventional sources of energy:
Solar energy Wind energy Hydro energy
Geo-thermal energy Biofuel Biogas Energy
(according to ISOS)
 Content:
Solar Energy:
Solar energy
 Solar cookers
 Solar hot water systems
 Solar dryers
 Solar air heaters
 Solar desalination systems
 Solar batteries
Advantages and Disadvantages of
solar energy:
 The total installed capacity of solar power
(Both CSP and PV) as of 2008 is 2826 MW.
 In India the total installed capacity of solar
power is around 2 MW.
 In India, various government and private
players have entered into CSP and PV
markets.
 MNRE has set a target to establish at least
50 MW of solar projects during the 11th plan.
Wind energy:
 Airflows can be used to run wind turbines.
Wind energy
It is a renewable source of energy.
It does not cause pollution.
The recurring cost is less.
Once the wind turbine is built the
energy it produces does not cause
green house gases
Wind is not available at all
times.
It requires a large area of land.
A minimum wind speed of 15
km/h is required.
15
STATE
CAPACITY(MW),as of MARCH
31,2015
TAMIL NADU 7455.2
GUJARAT 3645.4
MAHARASTRA 4450.8
RAJASTHAN 3307.2
KARNATAKA 2638.2
ANDHRA PRADESH 1031.4
MADHYA PRADESH 879.7
KERALA 35.1
OTHERS 4.3
TOTAL 23447.5
STATE WISE WIND POWER
Wind farm Current capacity(MW) Country
Gansu Wind Farm 6,000 China
Alta(Oak Creek-Mojave) 1320 United States
Jaisalmer Wind Park 1064 India
Shepherds Flat Wind Farm 845 United States
Roscoe Wind Farm 782 United States
Horse Hollow Wind Energy Center 736 United States
Capricorn Ridge Wind Farm 662 United States
Fântânele-Cogealac Wind Farm 600 Romania
Fowler Ridge Wind Farm 600 United States
Whitelee Wind Farm 539 United Kingdom
 Wind Power – Fastest growing renewable energy
source
 Globally, it grew at the average rate of 27 % pa over the
past 10 years.
 While in India it grew at the average rate of 33% over the
past 9 years.
 Presently, India is ranked 4th in the world in terms of
Wind Energy Installed Capacity
 Drivers of growth
 Environmental Awareness and Sustainable
Development
 Growing Global Energy Demand
 Improving Competitiveness of renewable energy
 Security of Supply Concerns
 New Markets (e.g. India, China etc)
 Carbon Trading
 Fiscal Benefits by Govt. (PTC, feed in tariffs, etc)
Hydel Energy:
Hydel energy
Flowing water is a renewable source of
energy.
The electricity produced does not cause
pollution.
The water stored in dams can also be
used to control floods and for irrigation.
Once a dam is constructed, electricity
can be produced at a constant-rate.
Often large dams become tourist
attractions in their own right.
The initial cost is high.
Large areas of land gets submerged and the
decomposition of vegetation produces methane
gas which is a green house gas.
It causes displacement of people
from large areas of land.
Geo-thermal Energy:
It means the energy harnessed from the hot rocks present inside the earth .
High temperature, high pressure steam fields exit below the earth’s surface in many
places.
At the core, temperatures may reach over 9,000 degrees Fahrenheit.
This heat comes from the fission of radioactive material naturally present in the rocks.
The deeper regions of the earth’s crust is very hot. This heat melts rocks and forms
magma.
The magma moves up and collects below at some places called Hot spots.
The underground water in contact with hot spot gets heated into steam at high
pressure.
Different Geothermal Energy Sources
Direct Application of Geothermal
Energy
Space Heating Air Conditioning Drying
Hot Water
Greenhouses
Melting SnowAquaculture
Significant Cost Saving :
Geothermal energy generally
involves low running costs since
it saves 80% cost over fossil fuels
and no fuel is used to generate
the power.
Reduce Reliance on Fossil Fuels :
Dependence on fossil fuels
decreases with the increase in
the use of geothermal energy.
With the sky-rocketing prices of
oil, many countries are pushing
companies to adopt these clean
sources of energy.
Environmental Benefits : helped in
reducing global warming and
pollution , does not create any
pollution as it releases some gases
from deep within the earth which
are not very harmful to the
environment.
Direct Use : Since ancient times,
people having been using this
source of energy for taking bath,
heating homes, preparing food
and today this is also used for
direct heating of homes and
offices.
Job Creation and Economic
Benefits .
Can release
H2S
Can cause
Land
Subsidence
Can
Salinate
Soil
Can run
out of
steam
Not
widespread
source of
energy
 Animal dung is mixed with water in the mixing tank and the slurry is sent into the
digester.
 The gas is taken out through the gas outlet and used for heating and lighting
purposes.
 The slurry left behind is rich in nitrogen and phosphorus and is used as manure for
crops.
 From cattle dung alone we can produce biogas of a magnitude of 22,500 MW
annually.
 A sixty cubic feet gobar gas plant can serve the needs of one average family.
 This gas contains 55 – 70 percent methane, which is inflammable and it is generally
Clean, non-polluting and
cheap
Direct supply of gas from
tank.
No maintenance cost
Does not cause any health
hazard.
provides us both the fuel and the
manure.
Could contribute a great
deal to Global pollution
& particulate pollution.
On a small scale there is
likely net loss of energy.
Slow process.
 Produced by gravitational forces of sun and moon.
 Produced by making the use of water movement from a high
tide to a low tide.
 The high tide to a low tide refers to the rise and fall of water
in the ocean.
 A difference of several meters is required between the high
and low tide.
 Ocean waves and tides can be made to turn a turbine and
generate electricity.
 Areas where rivers flow into the sea experience waves and
tides and electricity can be generated there. It has much
potential.
Tidal energy
Once the dam is built, Tidal
Power is Cheap.
There are no Greenhouse
gases or other wastes
associated with it.
Tidal power facilities produce
a predictable amount of
energy.
Major power dam building
projects are very expensive.
In order for a project to be
successful,there must be a
high tidal range.
Maintenance of a tidal power
facility can be difficult.
BIOFUEL
1
• It is an agriculture based fuel substitute.
2
• It can be made from both vegetable oil and animal fats.
3
• It can be used without major modifications in engines.
4
• It does not need separate infrastructure for storage and delivery.
5
• Handling bio-diesel is safer.
6
• It’s combustion emits less carbon monoxide, sulphates, unburnt hydrocarbons and particulate matters, thus
reduces air pollution.
Low Energy
output compared
to traditional
fuel.
While the fuel is
less polluting
,the process to
produce the
fuel(including
machinery
&plants) produce
a hefty carbon
emission.
For efficient
Biofuel energy
outputs, and to
build the
necessary
manufacturing
plants to
increase biofuel
quantities, a
high initial
investment is
often required.
As demand for
food crops such
as corn grows for
biofuel
production, it
could also raise
prices for
necessary staple
food crops.
There is concern
that using
valuable
cropland to grow
fuel crops could
have an impact
on the cost of
food and could
possibly lead to
food shortages.
Massive
quantities of
water are
required for
proper irrigation
of biofuel crops
as well as to
manufacture the
fuel, which could
strain local and
regional water
resources.
 Perhaps the future is here now. It has predicted that
50% of the world's energy will come from renewable
sources by 2040.
 The Earth receives 1,366 Watts per square meter
(W/m2) from the sun continuously.
 India receives solar energy in the region of 5 to 7
kWh/m2for 300 to 330 days in a year.
 This energy is sufficient to set up 20 MW solar power
plant/Km2land area.
Non conventional sources of energy /

Non conventional sources of energy /

  • 3.
    INDIA ranked sixthin the world in total energy consumption. INDIA has installed power capacity from 1262 megawatt to over 112.058 Gigawatt , this achievement is impressive but still not sufficient. In this scenario we need ALTERNATIVE,SUSTAINABLE sources of energy because of the benefits it provides us & India’s suitable ecosystem for such endeavours . This is where RENEWABLE energy comes in. Concept of RENEWABLE Energy: Renewable energy sources also called non-conventional energy, are sources that are continuously replenished by natural processes. Green electricity is generated from natural and renewable energy sources that have less of an impact on the environment than fossil fuels.
  • 4.
    Aside from lesspollution & a one time large investment, it is a financially sound too Rapid economic development & Increasing population = HIGH DEMAND for Energy A sustained 8% GDP growth of India requires an annual increase of: a) Commercial energy supply from 5.2% to 6.1% b) Total primary energy supply from 4.3% to 5.1% Keeping in mind future gains , limited supply of oil(& hence increasing prices) , carbon footprint –Non conventional sources of Energy are a great investment for India’s energy needs. Why do we need it ?
  • 5.
    Renewable Energy: &  About16% of global final energy consumption comes from renewable, with 10% coming from traditional biomass, which is mainly used for heating, and 3.4% from hydroelectricity.  New renewable (small hydro, modern biomass, wind, solar, geothermal, and biofuels) accounted for another 3% and are growing very rapidly.  The share of renewable in electricity generation is around 19%, with 16% of global electricity coming from hydroelectricity and 3% from new renewable.  India added 4,089 MW RENEWABLE energy capacity in financial year 2014-15, a capacity addition of 8.5% more than the targeted figure of 3,770 MW  2.3 GW WIND energy capacity was added as against a target of 2 GW.  Government had planned to add 1.1 GW of SOLAR power capacity, 12 MW capacity in addition to this target was added during the last financial year.  The total renewable energy installed capacity in India at the end of FY 2014-15 stood at 35.77 GW. The Indian government plans to increase this capacity to 175 GW by end of 2022.
  • 6.
    Types of Nonconventional sources of energy: Solar energy Wind energy Hydro energy Geo-thermal energy Biofuel Biogas Energy
  • 7.
  • 8.
  • 9.
  • 10.
     Solar cookers Solar hot water systems  Solar dryers  Solar air heaters  Solar desalination systems  Solar batteries
  • 11.
  • 12.
     The totalinstalled capacity of solar power (Both CSP and PV) as of 2008 is 2826 MW.  In India the total installed capacity of solar power is around 2 MW.  In India, various government and private players have entered into CSP and PV markets.  MNRE has set a target to establish at least 50 MW of solar projects during the 11th plan.
  • 13.
    Wind energy:  Airflowscan be used to run wind turbines. Wind energy
  • 14.
    It is arenewable source of energy. It does not cause pollution. The recurring cost is less. Once the wind turbine is built the energy it produces does not cause green house gases Wind is not available at all times. It requires a large area of land. A minimum wind speed of 15 km/h is required.
  • 15.
    15 STATE CAPACITY(MW),as of MARCH 31,2015 TAMILNADU 7455.2 GUJARAT 3645.4 MAHARASTRA 4450.8 RAJASTHAN 3307.2 KARNATAKA 2638.2 ANDHRA PRADESH 1031.4 MADHYA PRADESH 879.7 KERALA 35.1 OTHERS 4.3 TOTAL 23447.5 STATE WISE WIND POWER
  • 16.
    Wind farm Currentcapacity(MW) Country Gansu Wind Farm 6,000 China Alta(Oak Creek-Mojave) 1320 United States Jaisalmer Wind Park 1064 India Shepherds Flat Wind Farm 845 United States Roscoe Wind Farm 782 United States Horse Hollow Wind Energy Center 736 United States Capricorn Ridge Wind Farm 662 United States Fântânele-Cogealac Wind Farm 600 Romania Fowler Ridge Wind Farm 600 United States Whitelee Wind Farm 539 United Kingdom
  • 17.
     Wind Power– Fastest growing renewable energy source  Globally, it grew at the average rate of 27 % pa over the past 10 years.  While in India it grew at the average rate of 33% over the past 9 years.  Presently, India is ranked 4th in the world in terms of Wind Energy Installed Capacity  Drivers of growth  Environmental Awareness and Sustainable Development  Growing Global Energy Demand  Improving Competitiveness of renewable energy  Security of Supply Concerns  New Markets (e.g. India, China etc)  Carbon Trading  Fiscal Benefits by Govt. (PTC, feed in tariffs, etc)
  • 18.
  • 19.
    Flowing water isa renewable source of energy. The electricity produced does not cause pollution. The water stored in dams can also be used to control floods and for irrigation. Once a dam is constructed, electricity can be produced at a constant-rate. Often large dams become tourist attractions in their own right. The initial cost is high. Large areas of land gets submerged and the decomposition of vegetation produces methane gas which is a green house gas. It causes displacement of people from large areas of land.
  • 20.
    Geo-thermal Energy: It meansthe energy harnessed from the hot rocks present inside the earth . High temperature, high pressure steam fields exit below the earth’s surface in many places. At the core, temperatures may reach over 9,000 degrees Fahrenheit. This heat comes from the fission of radioactive material naturally present in the rocks. The deeper regions of the earth’s crust is very hot. This heat melts rocks and forms magma. The magma moves up and collects below at some places called Hot spots. The underground water in contact with hot spot gets heated into steam at high pressure.
  • 21.
  • 22.
    Direct Application ofGeothermal Energy Space Heating Air Conditioning Drying Hot Water Greenhouses Melting SnowAquaculture
  • 23.
    Significant Cost Saving: Geothermal energy generally involves low running costs since it saves 80% cost over fossil fuels and no fuel is used to generate the power. Reduce Reliance on Fossil Fuels : Dependence on fossil fuels decreases with the increase in the use of geothermal energy. With the sky-rocketing prices of oil, many countries are pushing companies to adopt these clean sources of energy. Environmental Benefits : helped in reducing global warming and pollution , does not create any pollution as it releases some gases from deep within the earth which are not very harmful to the environment. Direct Use : Since ancient times, people having been using this source of energy for taking bath, heating homes, preparing food and today this is also used for direct heating of homes and offices. Job Creation and Economic Benefits .
  • 24.
    Can release H2S Can cause Land Subsidence Can Salinate Soil Canrun out of steam Not widespread source of energy
  • 27.
     Animal dungis mixed with water in the mixing tank and the slurry is sent into the digester.  The gas is taken out through the gas outlet and used for heating and lighting purposes.  The slurry left behind is rich in nitrogen and phosphorus and is used as manure for crops.  From cattle dung alone we can produce biogas of a magnitude of 22,500 MW annually.  A sixty cubic feet gobar gas plant can serve the needs of one average family.  This gas contains 55 – 70 percent methane, which is inflammable and it is generally
  • 28.
    Clean, non-polluting and cheap Directsupply of gas from tank. No maintenance cost Does not cause any health hazard. provides us both the fuel and the manure.
  • 29.
    Could contribute agreat deal to Global pollution & particulate pollution. On a small scale there is likely net loss of energy. Slow process.
  • 30.
     Produced bygravitational forces of sun and moon.  Produced by making the use of water movement from a high tide to a low tide.  The high tide to a low tide refers to the rise and fall of water in the ocean.  A difference of several meters is required between the high and low tide.  Ocean waves and tides can be made to turn a turbine and generate electricity.  Areas where rivers flow into the sea experience waves and tides and electricity can be generated there. It has much potential. Tidal energy
  • 32.
    Once the damis built, Tidal Power is Cheap. There are no Greenhouse gases or other wastes associated with it. Tidal power facilities produce a predictable amount of energy. Major power dam building projects are very expensive. In order for a project to be successful,there must be a high tidal range. Maintenance of a tidal power facility can be difficult.
  • 33.
  • 36.
    1 • It isan agriculture based fuel substitute. 2 • It can be made from both vegetable oil and animal fats. 3 • It can be used without major modifications in engines. 4 • It does not need separate infrastructure for storage and delivery. 5 • Handling bio-diesel is safer. 6 • It’s combustion emits less carbon monoxide, sulphates, unburnt hydrocarbons and particulate matters, thus reduces air pollution.
  • 37.
    Low Energy output compared totraditional fuel. While the fuel is less polluting ,the process to produce the fuel(including machinery &plants) produce a hefty carbon emission. For efficient Biofuel energy outputs, and to build the necessary manufacturing plants to increase biofuel quantities, a high initial investment is often required. As demand for food crops such as corn grows for biofuel production, it could also raise prices for necessary staple food crops. There is concern that using valuable cropland to grow fuel crops could have an impact on the cost of food and could possibly lead to food shortages. Massive quantities of water are required for proper irrigation of biofuel crops as well as to manufacture the fuel, which could strain local and regional water resources.
  • 38.
     Perhaps thefuture is here now. It has predicted that 50% of the world's energy will come from renewable sources by 2040.  The Earth receives 1,366 Watts per square meter (W/m2) from the sun continuously.  India receives solar energy in the region of 5 to 7 kWh/m2for 300 to 330 days in a year.  This energy is sufficient to set up 20 MW solar power plant/Km2land area.