![TIDAL AND WAVE ENERGY
Rithin Nalli, Akash Ukey, Mukul Kumar ,Debabrot Bhuyan, and Pavan Kishan Bhukya *
Department of Chemical engineering,
Indian Institute of Kharagpur
Kharagpur-721302, India.
E-mail: rithin.ritz789@gmail.com
E-mail: ukeyakash@gmail.com
E-mail: mukul7835@gmail.com
E-mail: debabrot91@gmail.com
E-mail: bpavankishan1@gmail.com
ABSTRACT:
This report discusses the potential contribution that energy derived from the tides and waves can make to
overall energy supply in a sustainable way. It covers the topics of wide range like how tides and waves
are formed; functions of the possible and popular power generation systems especially tidal barrages,
turbines, oscillating water columns and wave farms. Advantages and disadvantages of tidal and wave
energy are also briefly discussed. Some cost data’s used give us brief insight into the economic
prospects of the tidal and wave energy. By turning to potential along the Indian coastline, we found that
India do have a huge potential of tidal and wave energy, though it has started very late. Government
initiatives and extensive research focused on the mentioned relevant opportunities will surely change the
energy scenario.
Tidal Energy >
1. INTRODUCTION
Tidal energy is a form of hydropower that converts the energy of the tides into electricity or other
useful forms of power. The tide is created by the gravitational effect of the sun and the moon on the
earth causing cyclical movement of the seas. Tidal energy is therefore an entirely predictable form of
renewable energy.[1]](https://image.slidesharecdn.com/tidalandwaveenergy-160617031607/75/Tidal-and-wave-energy-1-2048.jpg)
![It’s a plain fact that we are in a world where almost 80 percent of the demanding energy is furnished by
sources such as natural gas, coal, or oil, which are quickly being depleted as well as being
environmentally unfriendly. We have also developed some destructive processes such as the nuclear
power plants, which would also be a sword of Damocles of all human beings. Luckily, we have already
realized the importance of making an enormous change in our way of life and our way of using the
energy, so looking for renewable resources to substitute current ones is much urgent for us. Tidal power
is classified as a renewable energy source, because tides are caused by the orbital mechanics of the
solar system and are considered inexhaustible
within a human timeframe. Energy from tidal power is also a form of pollution free energy, which has a lot
of potential. Though these potentials have not been fully realised yet, we can’t deny the advantage of
such kind of a renewable energy. This paper gives some basic introductions of tidal power and the basic
principle of how tidal generator works, and it also focuses on the development of tidal power energy of the
world.
2. HISTORY
Tidal energy is one of the oldest forms of energy used by humans. Indeed, tide mills, in use on the
Spanish, French and British coasts, date back to 787 A.D. but it is likely that there were predecessors lost
in the anonymity of prehistory. Tide mills consisted of a storage pond, filled by the incoming (flood) tide
through a sluice and emptied during the outgoing (ebb) tide through a water wheel. The tides turned
waterwheels, producing mechanical power to mill grain and power was available for about two to three
hours, usually twice a day.
The power requirements of the industrialized world dwarf the output of the early tidal barrages and it was
not until the 1960’s that the first commercial-scale modern-era tidal power plant was built, near St. Malo,
France. The hydro mechanical devices such as the paddlewheel and the overshot waterwheel have given
way to highly-efficient bulb-type hydroelectric turbine/generator sets. The tidal barrage at St. Malo uses
twenty-four 10-megawatt low-head bulb-type turbine generator sets. Installed in 1965, the barrage has
been functioning without missing a tide for more than 37 years.After that, more and more commercial-
scale tidal barrage was put in service in France,Canada, Switzerland, UK, China and so forth.
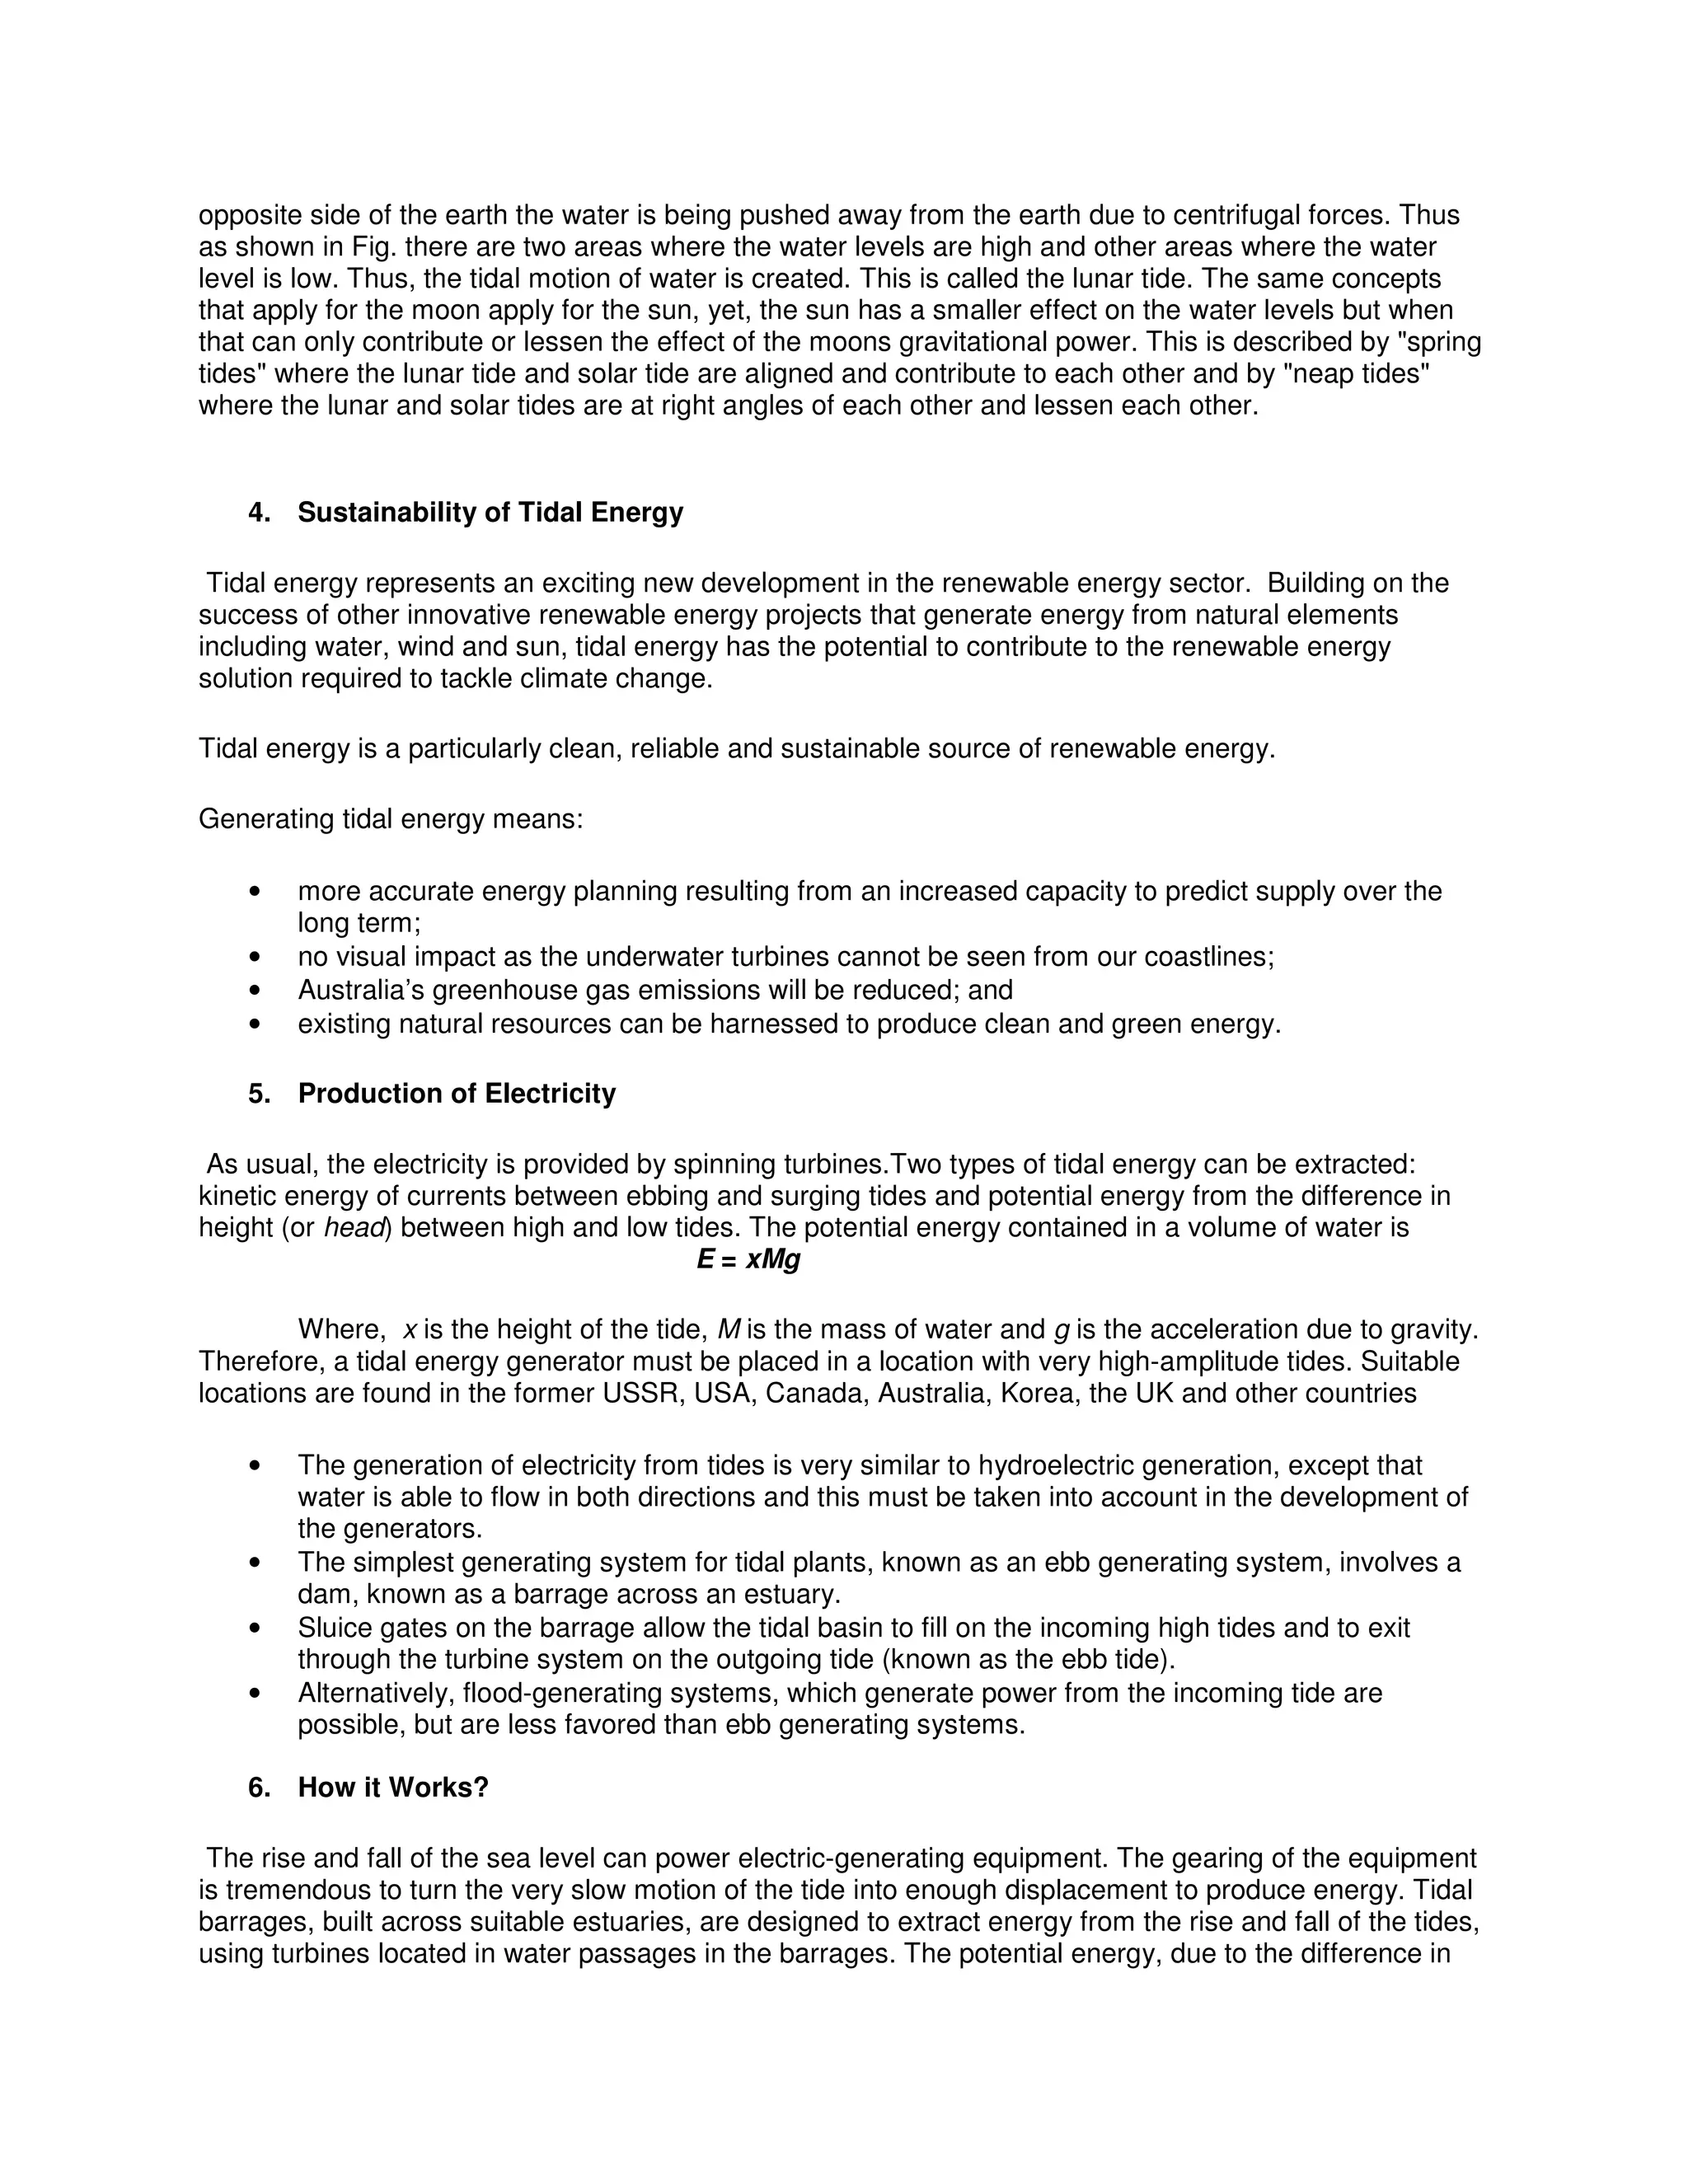
3. Physical Concepts of Tidal Phenomena
Tidal movements in seas are due to the increase of water levels at certain areas in the globe and the
decrease of water levels at other areas. This is basically due to two factors:
1- The gravitational forces between the Sun, Moon and Earth.
2- The rotation of the moon and earth.
[ Figure: http://teachearthscience.blogspot.in/2009/03/spring-tide-vs-neap-tide.html. ]
As there are gravitational forces between the Moon and the Earth, seas or oceans water is pulled away
from earth toward the moon at the area where the moon and the earth are in front of each other. At the](https://image.slidesharecdn.com/tidalandwaveenergy-160617031607/75/Tidal-and-wave-energy-2-2048.jpg)
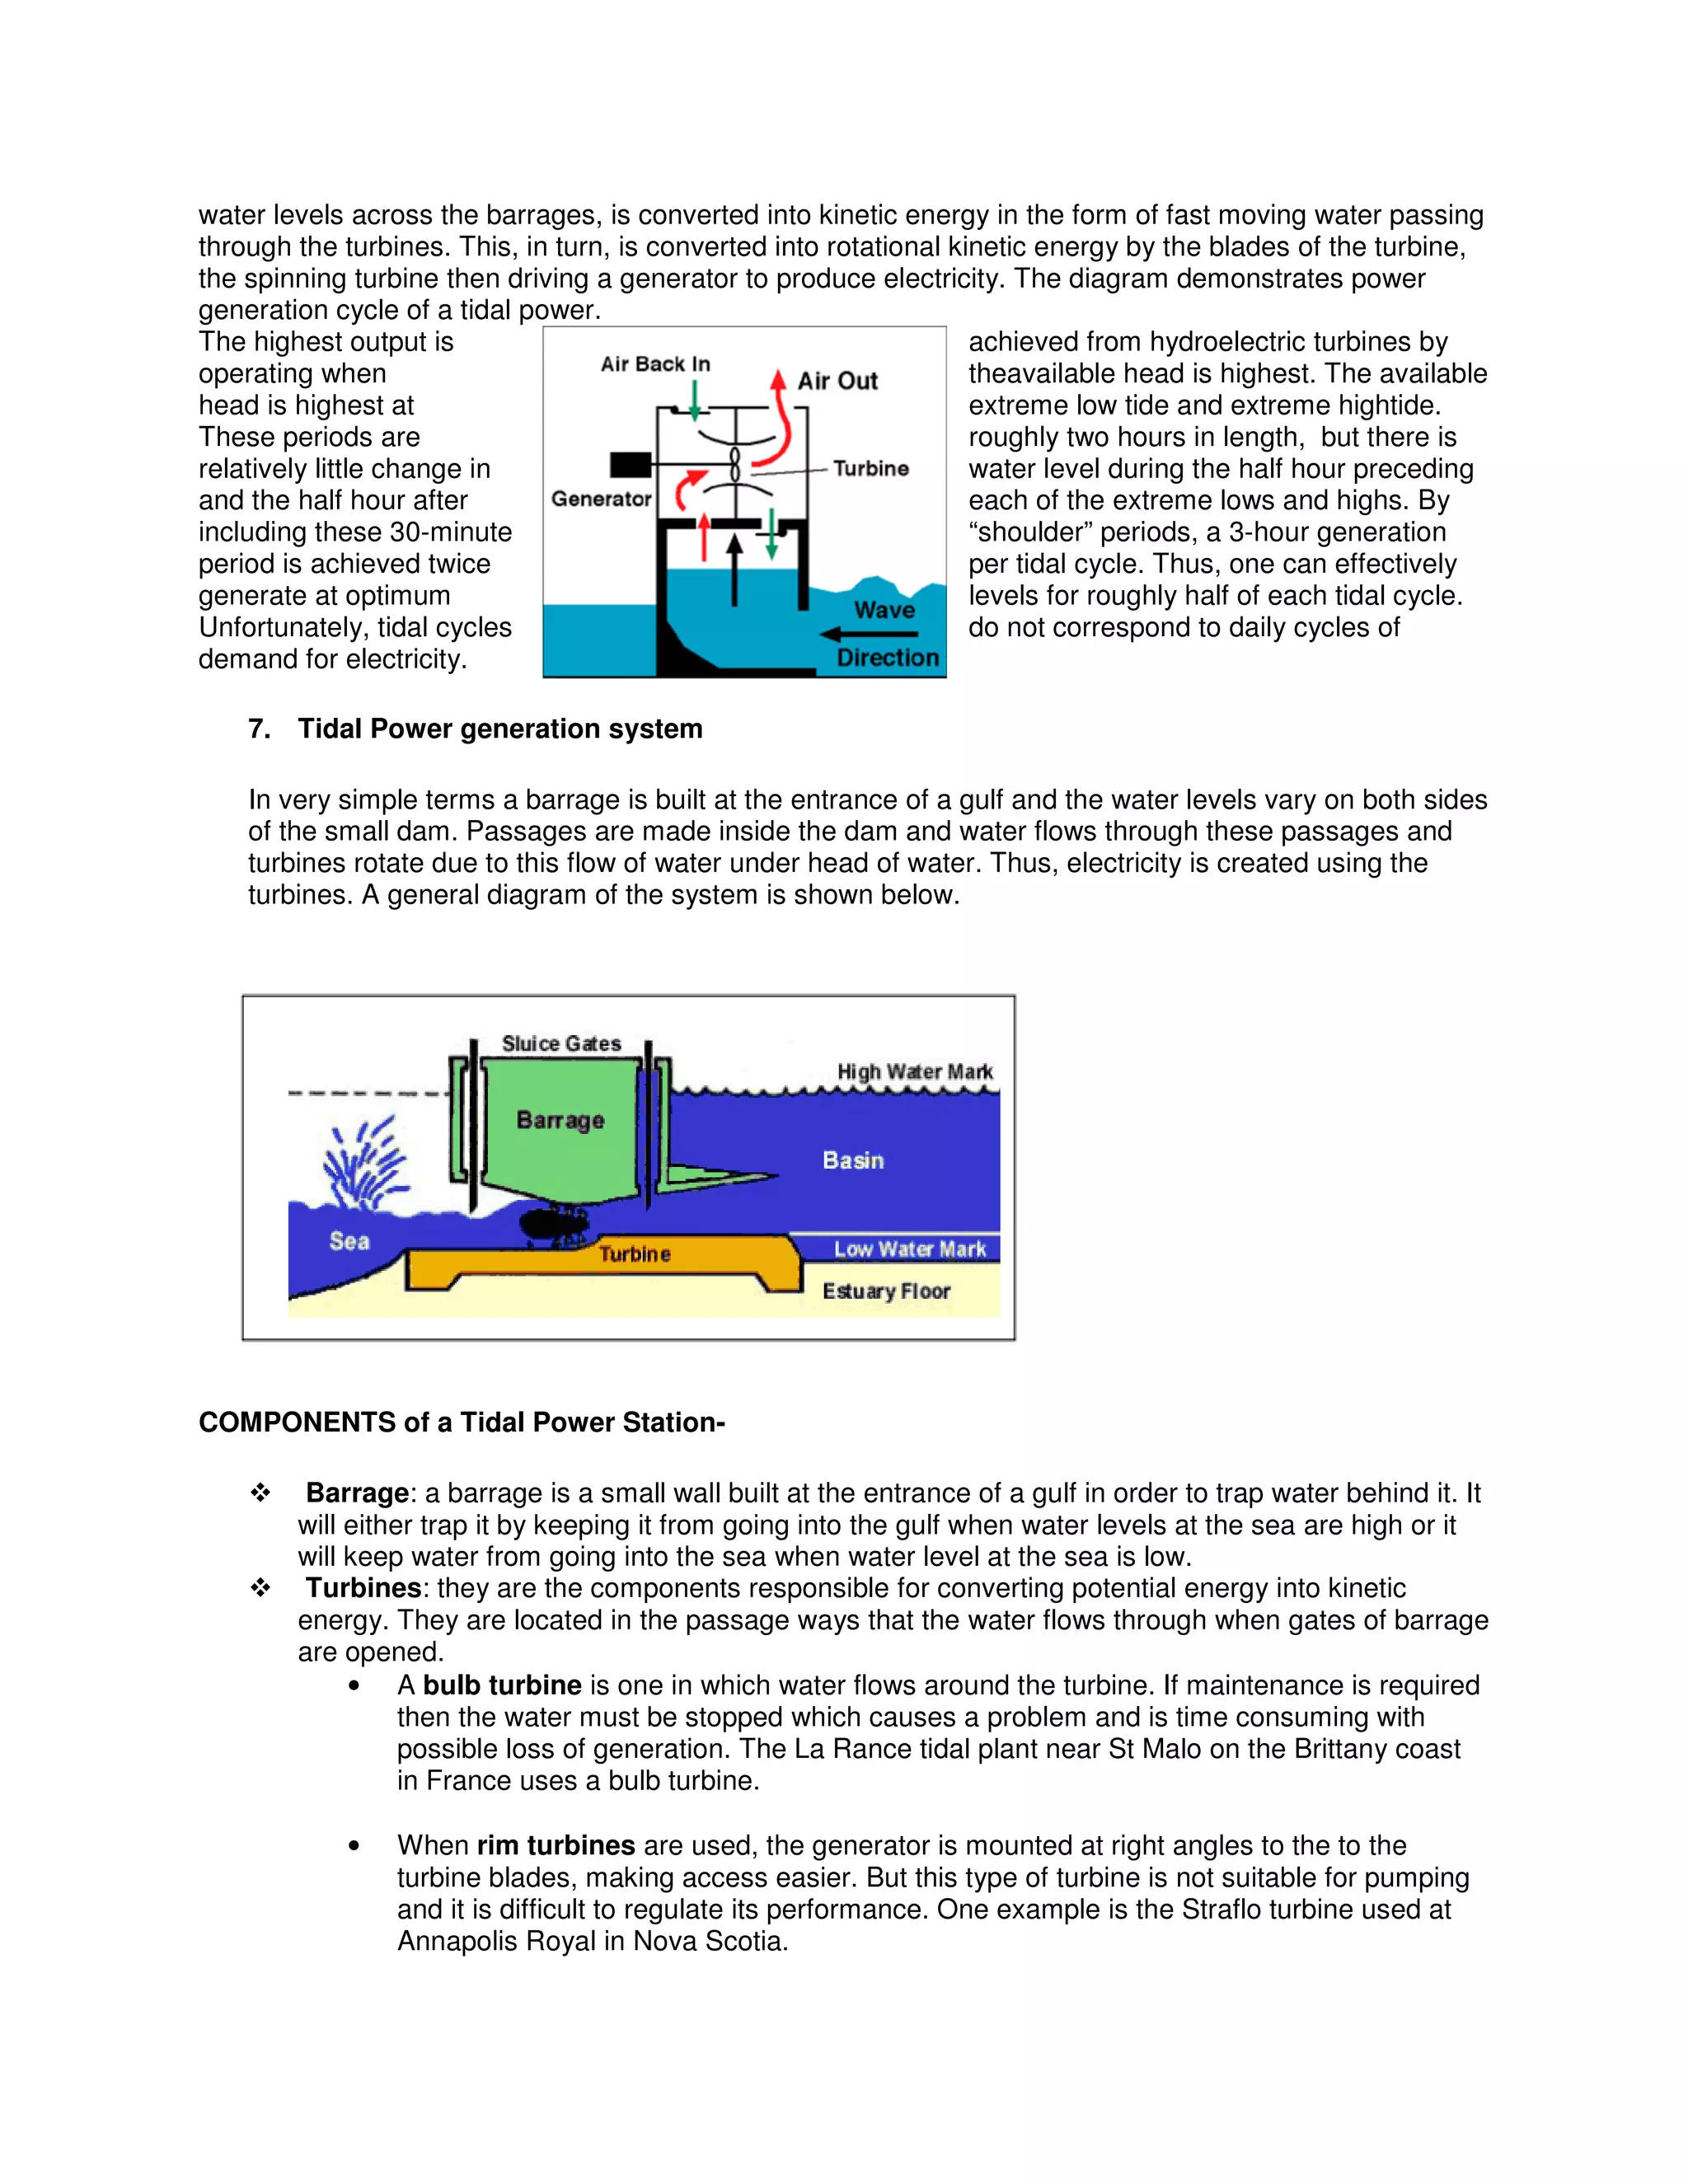
![• Tubular turbines have been proposed for the UK’s most promising site, The Severn
Estuary, the blades of this turbine are connected to a long shaft and are orientated at an
angle so that the generator is sitting on top of the barrage. The environmental and
ecological effects of tidal barrages have halted any progress with this technology and
there are only a few commercially operating plants in the world, one of these is the La
Rance barrage in France.
Sluices: sluice gates are the ones responsible for the flow of water through the barrage they
could be seen in Tidal Power station Fig.
Embankments: they are caissons made out of concrete to prevent water from flowing at certain
parts of the dam and to help maintenance work and electrical wiring to be connected or used to
move equipment or cars over it.
8. ENERGY Calculations- TIDAL BARRAGE
The energy available from barrage is dependent on the volume of water. The potential energy contained
in a volume of water is: [2]
E=1/2 Apgh2
where: h is the vertical tidal range,
A is the horizontal area of the barrage basin,
ρ is the density of water = 1025 kg per cubic meter (seawater varies between 1021 and 1030 kg
per cubic meter) and
g is the acceleration due to the Earth's gravity = 9.81 meters per second squared.
The factor half is due to the fact, that as the basin flows empty through the turbines, the hydraulic head
over the dam reduces. The maximum head is only available at the moment of low water, assuming the
high water level is still present in the basin.
9. POWER Calculations- TURBINES
The energy available from these kinetic systems can be expressed as:
where:
= the turbine power coefficient
P = the power generated (in watts)
= the density of the water (seawater is 1027 kg/m³)
A = the sweep area of the turbine (in m²)
V = the velocity of the flow
Advantages of Tidal Energy Disadvantages of Tidal Energy
Renewable resource, it needs no fuel to
maintain, and free of charge.
Totally no pollution, unlike fossil fuels, it
produces no greenhouse gases or other
waste.
Predictable source of energy (compared
with wind and solar), it is independent of
weather and climate change and follows
the predictable relationship of the lunar
orbit.
More efficient than wind because of the
density of water.
It will protect a large stretch of coastline
against damage from high storm tides.
Presently costly, very expensive to build
and maintain.(A 1085MW facility could cost
about 1.2 billion dollars to construct and
run)
Barrage has environmental affects
-fish and plant migration
-Silt and mud deposits
-Waste and sewage blocks
Technology is not fully developed.
Only provides power for around 10 hours
each day, when the tide is actually moving
in or out.](https://image.slidesharecdn.com/tidalandwaveenergy-160617031607/75/Tidal-and-wave-energy-5-2048.jpg)
![(Relative to an open turbine in free stream, ducted turbines are capable of as much as 3 to 4 times the
power of the same turbine rotor in open flow.)
Large scale Tidal power plant :
The largest barrage tidal power station of the world— Rance Tidal Power Station
Rance Tidal Power Station is located on the estuary of the Rance River, in Brittany, France.
Opened on the 26th November 1966 and is the largest tidal power station in the world, in terms of
installed capacity. With a peak rating of 240 Megawatts, generated by its 24 turbines, it supplies 0.012%
[3] of the power demand of France. With a capacity factor of approximately 40%, it supplies an average
96 Megawatts, giving an annual output of approximately 600 GWh. The barrage is 750 m (2,461 ft) long,
from Brebis point in the west to Briantais point in the east. The power plant portion of the dam is 332.5 m
(1,091 ft) long.
Jiangxia power station is the largest tidal power station in China and thethird largest tidal power
station in the world, which has been put into operation for nearly 20 years.
The Annapolis Tidal Generating Station, located in Annapolis Royal and completed in 1984.The only
modern tidal plant in North America.
The above table from reference [4].
Asia's first commercial-scale tidal power station:
The company Atlantis [5]Resources Corporation is to install a 50MW tidal farm in the Gulf of Kutch on
India’s west coast, with the construction starting early this year. The company has signed a MoU with the
government of Gujarat to set up the power plant by 2013. The plant is likely to be scaled up to a capacity
of 250 MW at a cost of about $165 million[4]. The project will be developed in partnership with the Gujarat
Power Corporation Limited.
Advantages of Wave Energy Disadvantages of Wave Energy
1. It is free. Waves generated by the wind are
used to convert into energy.
2. No waste products are produced. Thus no
pollution is caused.
3. The running costs required to maintain and
operate the facility is very less.
4. Significant amount of energy can be
produced.
5. Due to which it helps in decreasing the
dependence on non-renewable resources.
1. Energy output is variable depending on the
height of the wave.
2. A suitable location is needed for the site,
where the waves have to be strong.
3. Some designs are noisy, which may cause
disturbances on the sea floor and to marine
ecosystems. This noise can also be a
problem to the people living close to it.
4. Equipment might not be able to withstand
rough weather.
5. The initial capital costs required to develop
is very high.
6. Wave energy devices located near or on
the shore may degrade the scenic view in a
tourist hotspot.](https://image.slidesharecdn.com/tidalandwaveenergy-160617031607/75/Tidal-and-wave-energy-6-2048.jpg)
![Among the various forms of energy contained in the seas and oceans, tidal energy, has been developed
on a commercial scale. India has a long coastline with the estuaries and gulfs where tides are strong
enough to move turbines for electrical power generation. The Gulf of Cambay and the Gulf of Kutch in
Gujarat on the west coast have the maximum tidal range of 11m and 8m with average tidal range of
6.77m and 5.23m respectively. The Ganges Delta in the Sundarbans is approximately 5m with an
average tidal range of 2.97m. The identified economic power potential is of the order of 8000 MW with
about 7000 MW in the Gulf of Cambay, about 1200 MW in the Gulf of Kutch in the State of Gujarat and
about 100 MW in the Gangetic Delta in the Sunderbans region in the State of West Bengal.
Potential along the Indian coastline:-
Power generation in India is mainly from hydroelectric and thermal power plants. The present total
installed capacity hardly meets the grid demand. Uncertainty of the monsoon and problems of coal
transport put a strong limitation on expansion of present generation capacity. Thus India needs to develop
other sources of power like the power from the waves.
The potential along the 6000 Km of coast is about 40,000 MW [7]. This energy is however less intensive
than what is available in more northern and southern latitudes. Even 15% utilization would mean the
availability of approximately 6000 MW. Generally it has been observed that the western coast is more
useful than the eastern coast. This is because the former has more stable waves and is less vulnerable to
cyclones that can damage the power plant.
A wave atlas published by the National Institute of Oceanography (NIO) in Goa based on the swell data
published in the Indian Daily Weather Reports (India Meteorological Department) gives the nationwide
distribution of wave parameters. The average wave power potential along the Indian coastline is 5kWm-1
to 10kWm-1.[8] On the basis of scientifically collected data at Valliathura near Thiruvananthapuram on the
Kerala coast, the average wave power works out to be 13kWm-1.
A similar study along the coast of Maharashtra has shown that there are some potential sites such as
Vengurla rocks, Malvan rocks, Redi, Pawas, Ratnagiri and Girye, possessing an average annual wave
energy potential of 5 to 8 kW/m and monsoon potential of 15 to 20 kW/m.[6] Considering this, the total
potential along the 720 km-stretch of Maharashtra coast is approximately 500 MW for wave energy power
plants.
WAVE ENERGY >
Ocean wave energy (as distinct from internal waves or tsunamis) is energy that has been transferred from
the wind to the ocean. As the wind blows over the ocean, , air-sea interaction transfers some of the wind
energy to the water, forming waves, which store this energy as potential energy (in the mass of water
displaced from the mean sea level) and kinetic energy (in the motion of water particles).
The size and period of the resulting waves depend on the amount of transferred energy, which is a
function of the wind speed, the length of time the wind blows (order of days) and the length of ocean over
which the wind blows (fetch). Waves are very efficient at transferring energy, and can travel long
distances over the ocean surface beyond the storm area and are then classed as swells (Barber and
Ursell, 1948; Lighthill, 1978). The most energetic waves on earth are generated between 30º and 60º lati-
tudes by extra-tropical storms. Wave energy availability typically varies seasonally and over shorter time
periods, with seasonal variation typi-cally being greater in the northern hemisphere. Annual variations in
the wave climate are usually estimated by the use of long-term averages in modelling, using global
databases with reasonably long histories.
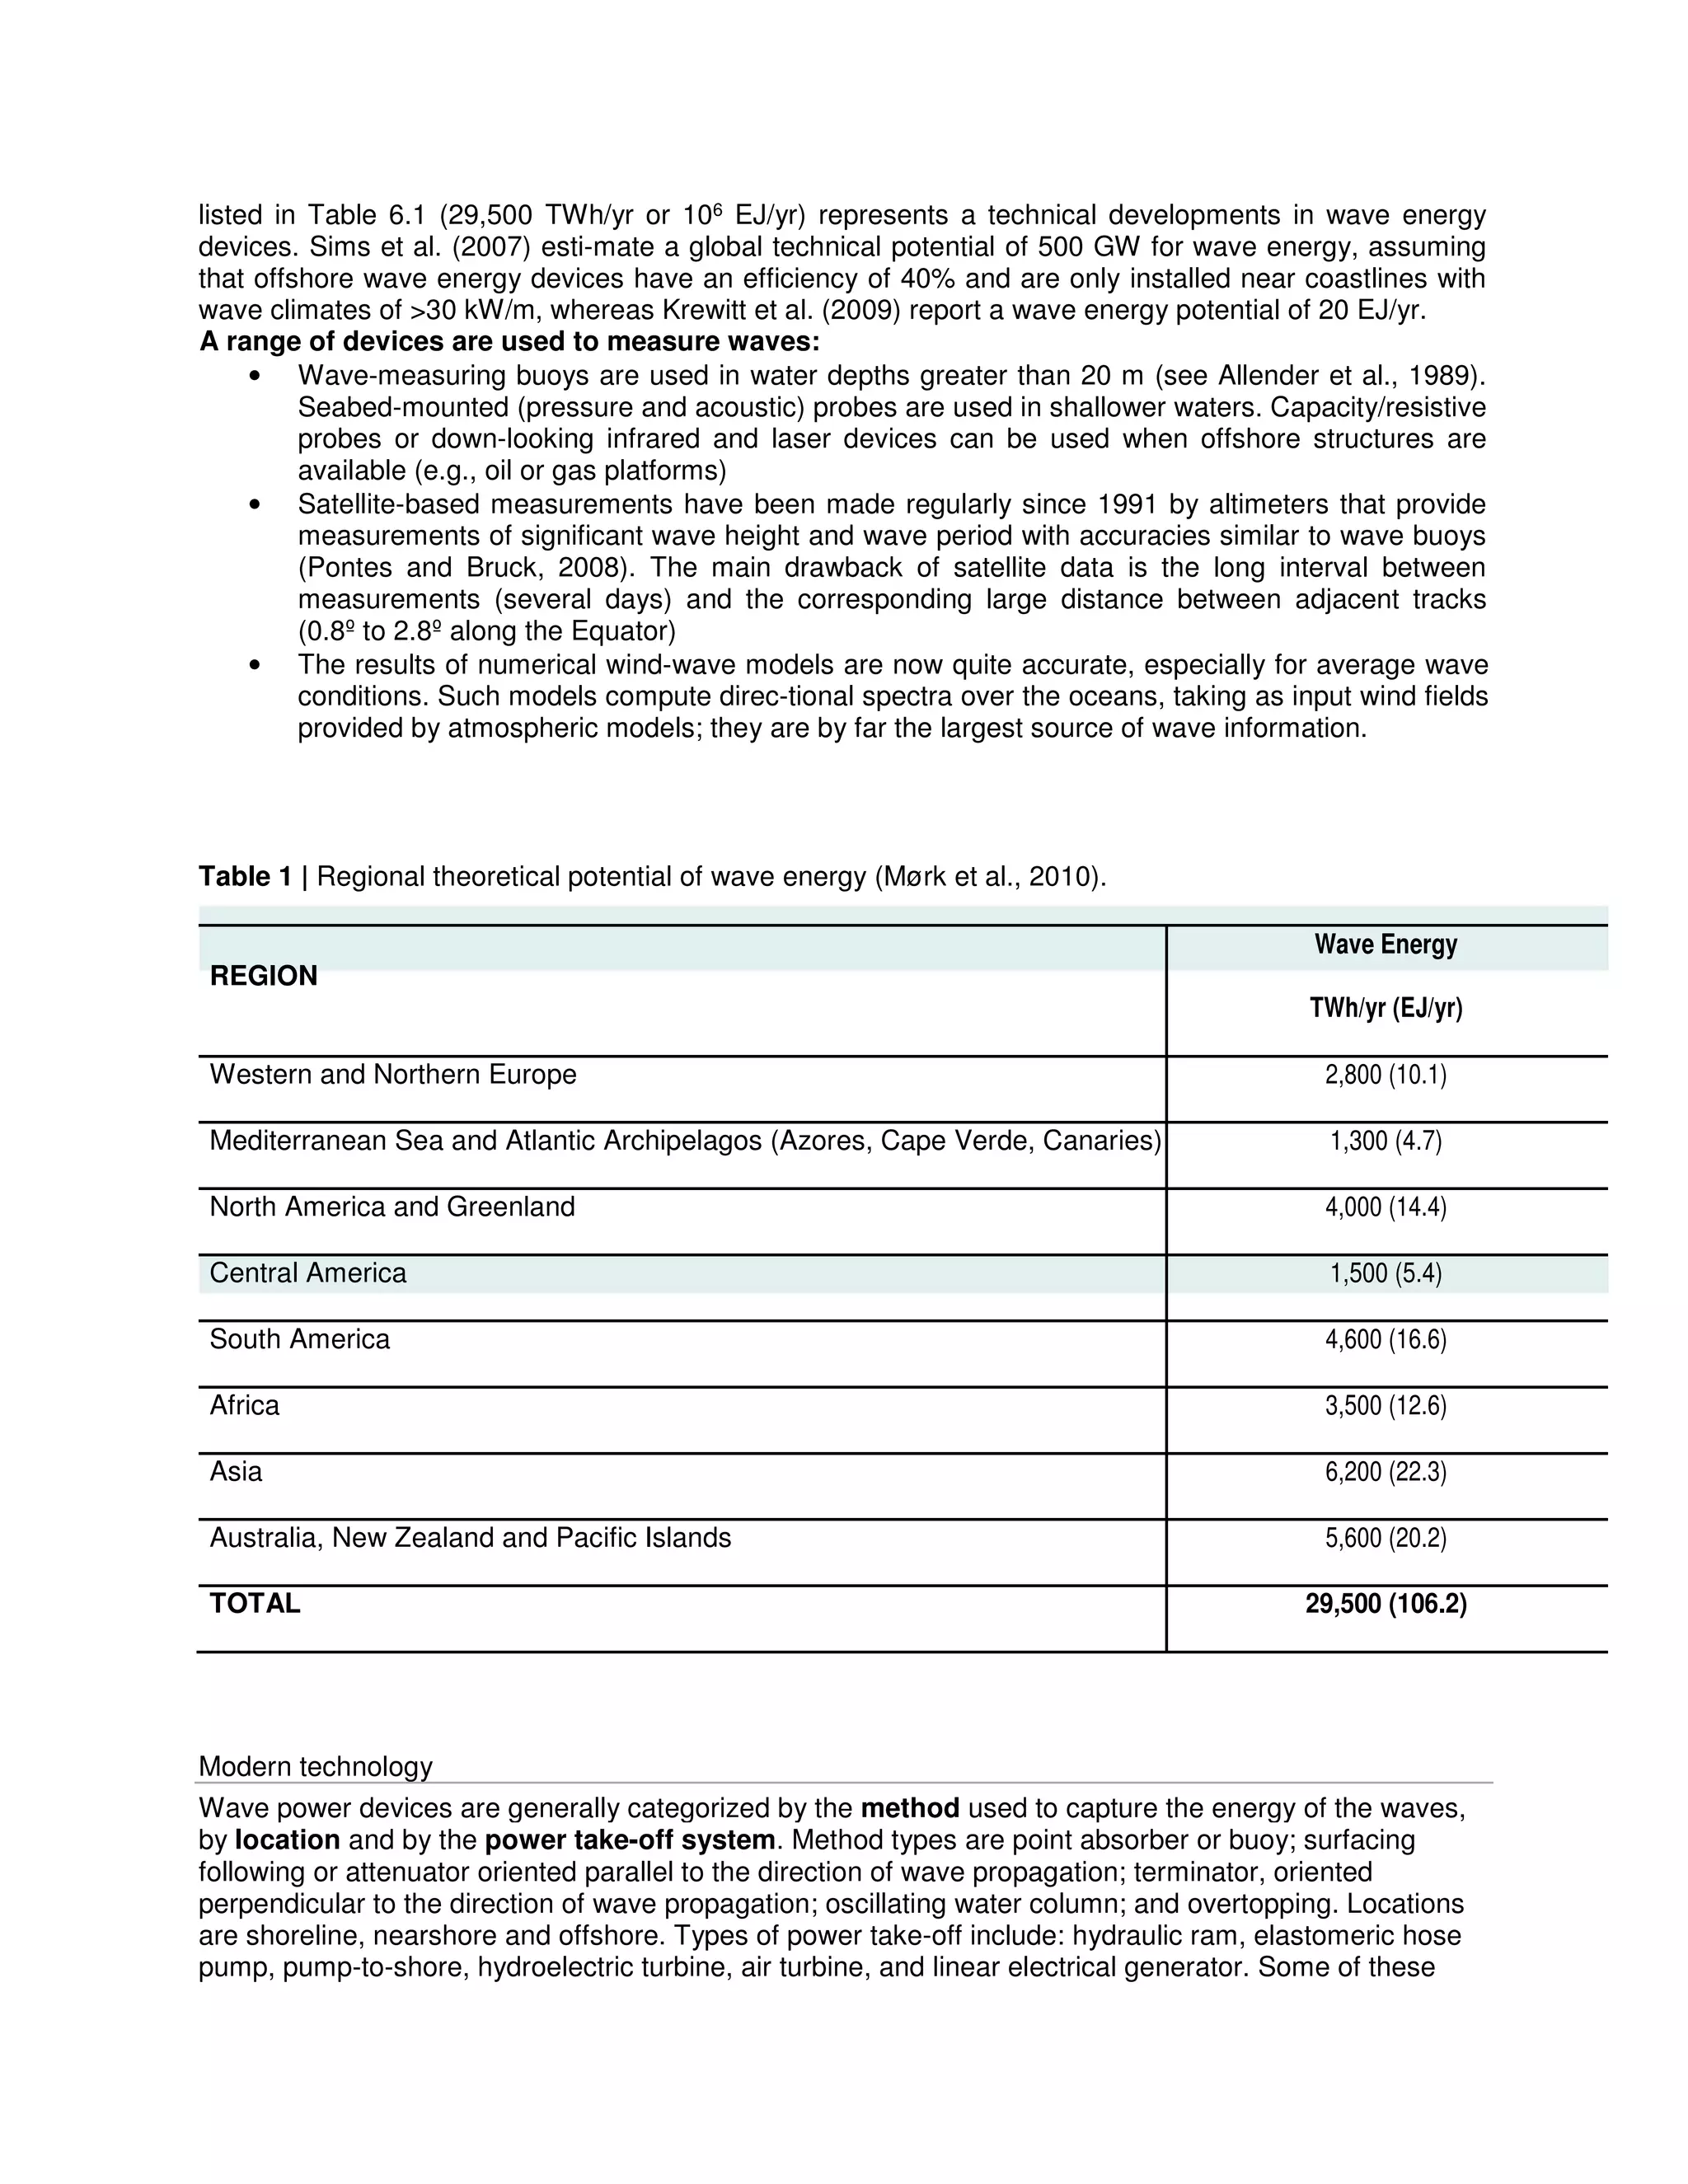
The total theoretical wave energy potential is estimated to be 32,000 TWh/yr (115 EJ/yr) (Mørk et al.,
2010), roughly twice the global electricity supply in 2008 (16,800 TWh/yr or 54 EJ/yr). This figure is
unconstrained by geography, technical or economic considerations. The regional dis-tribution of the
annual wave energy incident on the coasts of countries or regions has been obtained for areas where
theoretical wave power P ≥ 5 kW/m and latitude ≤66.5º (Table 6.1). The theoretical wave energy potential](https://image.slidesharecdn.com/tidalandwaveenergy-160617031607/75/Tidal-and-wave-energy-7-2048.jpg)
![designs incorporate parabolic reflectors as a means of increasing the wave energy at the point of capture.
These capture systems use the rise and fall motion of waves to capture energy. Once the wave energy is
captured at a wave source, power must be carried to the point of use or to a connection to the electrical
grid by transmission power cables. The table contains descriptions of some wave power systems:
DEVICE COUNTRY LOCATION POWER TAKE
OFF
YEAR
Aquabuoy Canada , Ireland Offshore Hydroelectric
Turbine
2003
Ceto Wave Power Australia Offshore Pump to shore 2000
Islay LIMPET Scotland Onshore Air Turbine 2001
OWEL UK Offshore Air Turbine 2013
Economic Prospects of tidal and wave energy
Key factors affecting cost of energy.
Commercial markets are not yet driving marine energy technology development. Government-supported
R&D and national policy incentives are the key motivation for most technology development and
deployment. The cost of most ocean energy technologies is difficult to assess, because very little
fabrication and deployment experience is available for validation of cost assumptions. Due to the very
limited amount of historic data there are no learning curves available for ocean energy technologies.
The costs of energy of marine renewables technologies depend on several factors. Principally, these
include capital costs, operating and maintenance (O&M) costs and the amount of electricity produced
(performance). Like wind energy, wave and tidal stream energy are free at source so there is no fuel cost.
Essentially, capital costs and O&M costs must be weighed against performance, since this is the saleable
output and represents income to the generator. A high performance device can afford to be expensive if
its costs are more than met by the value of electricity sold. But if the costs are so great that they exceed
the income from generation, the device will not be economically viable. The balance of costs and
performance is manifested in the cost of energy, and the target for this is the cheapest alternative:
another form of renewable or conventional power generation.
1. Capital cost 2. Operating and maintenance
costs
The capital cost of marine renewables technologies
can broken down into:
(i) the cost of the generation device itself
(materials, components and labor in
manufacturing and fabrication
processes);
(ii) the costs associated with installing it
(deployment);
(iii) the costs of keeping it on station
(foundations or moorings); and
(iv) the costs of connecting it to the grid
(electrical cables and switchgear).
Some of these costs are more dominant than
others, and the relative distribution of cost
centers varies between different device
concepts and site locations.
The O&M costs of marine renewables can also be
considered in several parts, including:
(i) Maintenance, both planned and unplanned
(like tsunami, sea storms etc.) ;
(ii) overhauls; where it is most economical to
re-fit components during the service life;
(iii) licenses and insurance to allow the devices
to be kept on station and to manage the
associated risks; and
(iv) Ongoing monitoring of wave or tidal
conditions and the performance of devices.
To have an approximated idea of the cost involved in the tidal and wave energy technology, We have this
table [14].](https://image.slidesharecdn.com/tidalandwaveenergy-160617031607/75/Tidal-and-wave-energy-9-2048.jpg)
![Refit
24%
Monit
oring
4%
Plann
ed
maint
ena…
Unpla
nned
maint
ena…
Insur
ance
14%
Licen
ces
1%
Type of OWC Locaions Cost ( in USD perkW)Cost
(in USD per kW)
First prototype model Near-shore 5000-15000
First production model Near-shore 2000-5000
First prototype model shoreline 9000-17000
First production model shoreline 2500-9000
It is evident from this table that production model costs around one-third of the prototype model.
Then the following table shows the estimated costs of wave and tidal energy (in ¢/kWh) for current and
future cases.[14]
Cost Wave Energy Tidal Energy
Current cost (in ¢/kWh) 10-30 8-12
Future cost (in ¢/kWh) 5-6 4-6
It is evident from this table that future costs will come down by around 50%, mainly due to technological
improvement. It should be noted that figures for the future costs are comparable to current cost of
conventional costs. It means, in future, tidal and wave energy will be strong substitute for the conventional
energy resources.
Breakdown of capital costs for a wave farm-
Following is the pie chart showing the breakdown of the capital cost of a wave farm [15]. Here, we can
note that mechanical and electrical costs around half of the whole capital cost and another one-fourth
goes to structural cost.
Breakdown of operation and maintenance costs for a wave farm-From this pie chart of operation and
maintenance, we can note that almost half goes to maintenance sector and another one-fourth goes to
refitting components.](https://image.slidesharecdn.com/tidalandwaveenergy-160617031607/75/Tidal-and-wave-energy-10-2048.jpg)
![Exhibit: Global Wave and Tidal Pipeline Capacity in Key Markets 2010-2015 (MW)-
Here is the bar graph taken from IHS Emerging Energy Research, Global Ocean Energy Markets and
Strategies: 2010-2030 [16] showing the estimated pipeline capacity for 2010-15 session market.
It is to be noted here that India is at 2nd position in tidal pipeline capacity, but in wave pipeline capacity,
it’s in bottom 3’s. This latter finding is really disturbing because despite India huge potential for wave
power harnessing.
The economic prize of Tidal and wave energy technologies-
Now we try to explore the revenue and investment
Due to uncertainties about future costs, estimates of the long-term economic potential of wave and tidal
stream energy tend to be approximate. However, the resource estimates suggest there could be both
major domestic and export markets for wave and tidal stream energy generation equipment, as well as
site development, construction, installation and operation services.
As indications of market size:
It is estimated that the value of worldwide electricity revenues from wave and tidal stream projects
could ultimately be between $100b/year and $ 300b/year
[17]
and Investments of over $ 800b would be
necessary for wave energy to contribute 2000 TWh/year worldwide[E].
One important insight we get here is that revenue by investment ratio is around 1/8 to 3/8. In other words,
12.5% to 37.5% profit which is economically very attractive investment criteria. So, we can be sure that in
recent days, more and more innovations is going to be happen in these sectors.
Overall, the market for marine renewables, particularly offshore wave energy, is likely to be sufficiently
large to merit considerable interest in its commercial development.
Research opportunities-
Through the report we have seen many disadvantages of both tidal and wave energy. It simply suggests
that, those mentioned areas do need improvement and intensive research.
Followings are the some points of having research opportunities-
• Tidal and wave energy have the huge potential to meet worldwide energy need, but due to lack of
means, we are still facing energy crisis. Further researches are being done and many innovative
solutions are being tried.
• The capital cost of initial construction of the tidal and wave energy devices are very high as we
have seen in the breakdown pie-chart. Extensive research is taking place to achieve cheaper
ways of tidal and wave energy harnessing.](https://image.slidesharecdn.com/tidalandwaveenergy-160617031607/75/Tidal-and-wave-energy-11-2048.jpg)


This document examines the potential of tidal and wave energy as sustainable energy sources, detailing their formation, power generation methods, and the advantages and disadvantages associated with their use. It highlights India's significant untapped potential for tidal and wave energy production along its coasts and emphasizes the need for government initiatives and research to realize these opportunities. Additionally, it compares tidal energy to conventional energy sources, underlining its predictability and environmental benefits.


