1. Quick take
Surya Roshni BUY
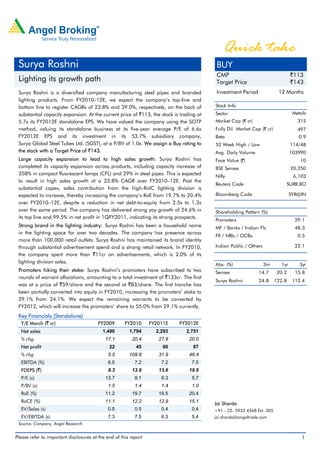
CMP `113
Lighting its growth path Target Price `143
Surya Roshni is a diversified company manufacturing steel pipes and branded Investment Period 12 Months
lighting products. From FY2010–12E, we expect the company’s top-line and
bottom line to register CAGRs of 23.8% and 39.0%, respectively, on the back of Stock Info
substantial capacity expansion. At the current price of `113, the stock is trading at Sector Metals
5.7x its FY2012E standalone EPS. We have valued the company using the SOTP Market Cap (` cr) 315
method, valuing its standalone business at its five-year average P/E of 6.6x Fully Dil. Market Cap (` cr) 497
FY2012E EPS and its investment in its 53.7% subsidiary company, Beta 0.9
Surya Global Steel Tubes Ltd. (SGST), at a P/BV of 1.0x. We assign a Buy rating to 52 Week High / Low 114/48
the stock with a Target Price of `143. Avg. Daily Volume 103990
Large capacity expansion to lead to high sales growth: Surya Roshni has Face Value (`) 10
completed its capacity expansion across products, including capacity increase of BSE Sensex 20,250
358% in compact fluorescent lamps (CFL) and 29% in steel pipes. This is expected Nifty 6,103
to result in high sales growth at a 23.8% CAGR over FY2010–12E. Post the
Reuters Code SURR.BO
substantial capex, sales contribution from the high-RoIC lighting division is
expected to increase, thereby increasing the company’s RoE from 19.7% to 20.4% Bloomberg Code SYR@IN
over FY2010–12E, despite a reduction in net debt-to-equity from 2.5x to 1.3x
over the same period. The company has delivered strong yoy growth of 24.6% in Shareholding Pattern (%)
its top line and 99.5% in net profit in 1QFY2011, indicating its strong prospects.
Promoters 29.1
Strong brand in the lighting industry: Surya Roshni has been a household name MF / Banks / Indian Fls 48.3
in the lighting space for over two decades. The company has presence across
FII / NRIs / OCBs 0.5
more than 100,000 retail outlets. Surya Roshni has maintained its brand identity
through substantial advertisement spend and a strong retail network. In FY2010, Indian Public / Others 22.1
the company spent more than `11cr on advertisements, which is 2.0% of its
lighting division sales.
Abs. (%) 3m 1yr 3yr
Promoters hiking their stake: Surya Roshni’s promoters have subscribed to two Sensex 14.7 20.2 15.8
rounds of warrant allocations, amounting to a total investment of `133cr. The first
Surya Roshni 24.8 122.8 112.4
was at a price of `59/share and the second at `83/share. The first tranche has
been partially converted into equity in FY2010, increasing the promoters’ stake to
29.1% from 24.1%. We expect the remaining warrants to be converted by
FY2012, which will increase the promoters’ share to 55.0% from 29.1% currently.
Key Financials (Standalone)
Y/E March (` cr) FY2009 FY2010 FY2011E FY2012E
Net sales 1,490 1,794 2,293 2,751
% chg 17.1 20.4 27.8 20.0
Net profit 22 45 60 87
% chg 5.5 109.8 31.9 46.4
EBITDA (%) 6.5 7.2 7.2 7.5
FDEPS (`) 8.3 13.9 13.6 19.9
P/E (x) 13.7 8.1 8.3 5.7
P/BV (x) 1.5 1.4 1.4 1.0
RoE (%) 11.2 19.7 19.5 20.4
RoCE (%) 11.1 12.2 12.9 15.1 Jai Sharda
EV/Sales (x) 0.5 0.5 0.4 0.4 +91 - 22- 3952 4568 Ext. 305
EV/EBITDA (x) 7.3 7.5 6.3 5.4 jai.sharda@angeltrade.com
Source: Company, Angel Research
Please refer to important disclosures at the end of this report 1
2. Quick take
Surya Roshni
Investment arguments
Strong growth visibility
Substantial capacity expansion plans…
Surya Roshni is a diversified company having manufacturing presence in steel
tubes, cold rolled metal strips and the entire range of lighting products and
luminaries. The company has three manufacturing facilities—one in Kashipur
(Uttarakhand) for the lighting division, one in Bahadurgarh (Haryana) for the steel
division and one in Malanpur (Madhya Pradesh) that manufactures both lighting
and steel products.
In FY2010, Surya Roshni, under SGST, started a 200,000 tonne spiral pipe
manufacturing plant in Bhuj, Gujarat.
At its Kashipur facility, Surya Roshni recently expanded its manufacturing capacity
for a variety of products. Post the expansion, the company’s CFL manufacturing
capacity increased by 358.3% to 6.6cr pieces per annum (pcs p.a.). The capacity
for fluorescent tube lamps (FTL) expanded by 14.2% to 6.3cr pcs p.a. and that of
HPSV/HPMV lamps grew by 300.0% to 1.8mn pcs p.a. The company also
expanded its manufacturing capacity for components like glass shells.
Production at the company’s 11,000MT p.a. highmast facilty at Malanpur has
already started. Further, the company is planning to start production at its
72,000MT p.a. ERW pipes manufacturing facility in Malanpur.
Exhibit 1: Substantial capacity addition across products
Capacity Inc. in
Product capacity*
FY09 FY10 FY11E FY12E (%)
Pipes/Tubes (mt) 250,000 250,000 322,000 322,000 28.8
GLS lamps (cr) 18.7 18.7 18.7 18.7 -
Fluorescent tube lamps (cr) 5.5 6.3 6.3 6.3 14.2
HPSV/HPMV lamps (units) 450,000 1,800,000 1,800,000 1,800,000 300.0
CFL (cr) 1.4 6.6 6.6 6.6 358.3
PVC pipe (mt) - 17,500 17,500 17,500 NA
Highmast poles (mt) - - 11,000 11,000 NA
Source: Company, Angel Research; Note: *Increase in capacity over FY2009–12E
Surya Roshni has spent `224cr on Surya Roshni has spent `224cr on capex in FY2009 and FY2010. In comparison,
capex in FY2009 and FY2010. the total sales potential of the expanded capacity is `1,000cr, indicating the
In comparison, the total sales potential asset-light nature of the newly expanded capacity. As utilisation in the new facilities
of the expanded capacity is `1,000cr, increases, the company’s total asset-turnover is expected to increase from 2.4x to
indicating the asset-light nature of the 2.9x over FY2010–12E. Consequently, we expect the company’s RoE to rise from
newly expanded capacity 19.7% to 20.4% over FY2010–12E.
…to lead to strong top-line growth
Surya Roshni is poised for strong growth over the next few years, driven by
increased production from its expanded capacities across its product range.
We expect sales contribution from the lighting division to increase from 29.5% in
FY2010 to 33.6% in FY2012E.
October 8, 2010 2
3. Quick take
Surya Roshni
The lighting division is expected to witness The lighting division is expected to witness a 32.5% CAGR over FY2010–12E,
a CAGR of 32.5% over FY2010–12E, which is much higher than the estimated 20.5% CAGR for the steel division over
which is much higher than the estimated the same period. The lighting division’s growth is expected to be driven by higher
20.5% CAGR for the steel division over the sales in the fast-growing CFL segment. The company’s highmast poles facility is
same period also expected to start contributing to sales from FY2011. Growth in the steel
division is expected to be driven by the starting of production at the ERW pipes unit
in Malanpur.
Exhibit 2: CFL and highmast sales to drive lighting division’s growth
80.0
Contribution to Revenues (%) 71.2
70.0 64.2
60.0
53.3
47.7
50.0
40.0
28.8 42.0 39.9
30.0 35.8
20.0
12.5
10.0 4.7
0.0
FY09 FY10 FY11E FY12E
CFL Highmast Others
Source: Company, Angel Research
Overall, the company’s net revenue is expected to grow to `2,751cr in FY2012E
from `1,794cr in FY2010, registering a 23.8% CAGR over FY2010–12E. Robust
top-line growth (24.7% yoy) posted by the company in 1QFY2011 supports our
projections.
Exhibit 3: Revenue: Segmental and product-wise contribution
(` cr) FY07 FY08 FY09 FY10 FY11E FY12E
Lighting division sales 324 347 382 560 777 983
GLS lamps 112 106 106 123 126 129
Fluorescent tube lamps 122 120 103 108 114 121
CFL 19 43 110 200 326 392
Highmast poles - - - - 36 123
PVC pipes - - - - 28 59
Steel division sales 893 1,058 1,227 1,338 1,663 1,943
Pipes/Tubes 614 744 941 1,013 1,283 1,515
Overall gross sales 1,217 1,405 1,609 1,897 2,440 2,927
Overall Net Sales 1,099 1,272 1,490 1,794 2,293 2,751
Contribution to sales (%)
Lighting division 26.6 24.7 23.7 29.5 31.9 33.6
Steel division 73.4 75.3 76.3 70.5 68.1 66.4
Source: Company, Angel Research
October 8, 2010 3
4. Quick take
Surya Roshni
…and bottom-line growth
Surya Roshni’s overall margins are also The OPM of the company’s lighting division is much higher than that of the steel
expected to expand, since the division. Going ahead, since the contribution of the lighting division to the top line
contribution of the lighting division to is expected to increase, the company’s overall margins are also likely to expand.
the top line is expected to increase
We expect the company’s OPM to increase to 7.5% in FY2012E from 7.2% in
FY2010. In 1QFY2011, the company’s OPM improved by 40bp to 6.3% from
5.9% in 1QFY2010.
Exhibit 4: Overall EBITDA margin to increase
18.0
16.0 15.6 15.4
13.9 14.5 14.3 14.0 14.0
14.0
12.0
(%)
10.0
8.1 7.5
8.0 7.2 7.2 7.2
6.0 6.5
6.0
4.0 3.4 3.6
4.0 3.3 3.1 3.3 3.4
2.0
0.0
FY06 FY07 FY08 FY09 FY10 FY11E FY12E
Lighting Division OPM Steel Division OPM Overall OPM
Source: Company, Angel Research
Owing to strong top-line growth and an expansion in margins, we expect PAT to
grow at a 39.0% CAGR over FY2010–12E to `87cr. In 1QFY2011, net profit
nearly doubled to `8.4cr from `4.2cr in 1QFY2010.
Exhibit 5: PAT to grow at a 39.0% CAGR
100
90
80
70
(` cr)
60
50
40
30
20
10
0
FY06 FY07 FY08 FY09 FY10 FY11E FY12E
PAT
Source: Company, Angel Research
Strong brand name in the lighting space
Surya Roshni is a household name in the Indian lighting industry since the past two
decades. In the FTL and incandescent lamps segment, the company has historically
maintained a strong market share of over 20.0%. In FY2010, its market share was
~24.2% for both these products.
October 8, 2010 4
5. Quick take
Surya Roshni
Exhibit 6: Strong market share across lighting products
30.0
25.0
Market Share (%)
20.0
15.0
10.0
5.0
0.0
FY07 FY08 FY09 FY10 FY11E FY12E
CFL Flourescent Tube Lamps Incandescent Lamps
Source: Company, ELCOMA, Angel Research
In the CFL market, the company has increased its dominance as its market share
increased from 2.4% in FY2007 to 10.7% in FY2010. The company has already
become a bigger player than Bajaj Electricals in CFLs. We expect the company to
maintain its high growth rate in CFL sales on the back of high growth in
industry-wide CFL sales and further market share expansion.
CFL – Industry sales and Surya Roshni’s market share growth
We estimate the lighting industry’s total sales in volume terms across products to
continue growing at the historical growth rate of 5.9% p.a. In this, we expect the
special lamps category to grow at 15.8%, which is its historical growth rate.
However, there is no sales growth expected in the market for incandescent lamps
and FTL, as both these products are in a declining stage of their lifecycle, as they
are being replaced by CFLs, which are much better in terms of technology and
operating costs. The rest of the lighting industry’s growth is expected to come from
CFL. Hence, the estimated growth in the CFL industry over CY2009–11E is 24.8%.
Exhibit 7: CFL sales to grow at a 24.8% CAGR over CY209–11E
Volumes (cr pcs) CY06 CY07 CY08 CY09 CY10E CY11E CY12E
Incandescent lamps 75.7 77.9 73.4 76.6 76.6 76.6 76.6
Fluorescent lamps 18.6 19.0 18.6 17.9 17.9 17.9 17.9
CFL 10.0 14.0 19.9 25.5 32.4 39.7 47.4
Special lamps 1.4 1.7 2.1 1.8 2.1 2.4 2.8
Total 105.7 112.6 114.0 121.8 129.0 136.6 144.7
CFL growth rate (%) 49.3 40.0 42.1 28.1 27.1 22.5 19.4
Source: ELCOMA, Angel Research
We expect Surya Roshni’s market share in CFLs to increase to 14.0% by FY2012E
from 10.7% in FY2010, backed by higher advertisement spend and a strong retail
network.
October 8, 2010 5
6. Quick take
Surya Roshni
Exhibit 8: Surya Roshni likely to further increase market share in CFLs
CFLs (cr pcs) FY07 FY08 FY09 FY10 FY11E FY12E
Industry volume* 10.0 14.0 19.9 25.5 32.4 39.7
Surya Roshni’s volume 0.2 0.6 1.5 2.7 4.5 5.6
Market share (%) 2.4 4.0 7.4 10.7 14.0 14.0
Source: Company, Angel Research; Note:*Industry data for the corresponding calendar year
Surya Roshni’s products are available across the country at more than 100,000
retail outlets, which gives it a strong brand visibility. Further, management is
increasing its focus on advertising. In FY2010, the company spent ~2.0% of its
revenue from the lighting division on advertisement as compared to 0.6% in
FY2008. The higher allocation to advertisement expenses would further reinforce
the company’s brand presence among consumers.
Exhibit 9: Advertisement expense hiked in recent years
2.5 2.3
2.0 2.0
1.5 1.4
(%)
1.2 1.1
1.0
1.0
1.0
0.5
0.6
0.0
FY03 FY04 FY05 FY06 FY07 FY08 FY09 FY10
Ad spend-to-Sales (Lighting division)
Source: Company, Angel Research
Promoters increasing their stake
The conversion of warrants is expected Surya Roshni’s promoters have issued two rounds of warrants, one of which has
to increase the promoters’ shareholding already been partially converted. In FY2010, in the first round, the company issued
to 55.0% from 29.1% currently 0.64cr warrants convertible at a price of `59/share, out of which 0.18cr warrants
were converted, thereby increasing the promoters’ stake to 29.1% from 24.1%
before the conversion. The second round of warrant allocation was carried out in
July 2010, where 1.14cr warrants were allocated to the promoters at a conversion
price of `83/share. We expect the remaining 0.46cr warrants of the first tranche of
warrants to be converted into equity shares in FY2011E. We expect the second
round of warrants also to be converted into equity shares by FY2012E. The
conversion of warrants is expected to increase the promoters’ shareholding to
55.0%, assuming there is no other change in the paid-up capital of the company.
October 8, 2010 6
7. Quick take
Surya Roshni
Exhibit 10: Promoters are increasing their stake
Conversion Amount Promoter shareholding (%)
Allocation date price invested Before Partial After
(`/share) (` cr) conversion conversion conversion
December14, 2009 59.0 24.1 29.1* 39.1
37.8
July 12, 2010 83.0 39.1 - 55.0
94.9
Source: Company, Angel Research; Note: *Current promoter shareholding
Financial outlook
Debt-to-Equity to reduce going ahead
Surya Roshni had net debt-to-equity of 2.5 in FY2010. However, owing to the
expected warrant conversion and lower capex requirements going ahead, we
expect this ratio to decline to 1.3x by FY2012E.
Exhibit 11: Net Debt/Equity expected to reduce going ahead
3.0
2.5
2.5 2.2 2.1
2.2 2.2
1.9
2.0
(x)
1.5 1.3
1.0
0.5
0.0
FY06 FY07 FY08 FY09 FY10 FY11E FY12E
Net Debt-to-Equity
Source: Company, Angel Research
Tax benefits to continue
Surya Roshni’s Kashipur unit is exempt from income tax, as it is located in
Uttaranchal, where it gets tax benefits due to local regulations. This unit is also
exempt from excise duty for a 10-year period, starting from the commissioning of
any capacity. As a result, the company’s effective tax rate has reduced from 35.4%
in FY2007 to 16.0% in FY2010. The newly added capacity in the Kashipur unit
would also enjoy these tax advantages. However, this benefit would be balanced
by the capacity expansion in the highmast and steel manufacturing units in the
non-tax exempt zone. Therefore, we expect the tax rate to remain at the current
levels of ~16.0% in FY2011E, before increasing marginally to 18.0% in FY2012E.
October 8, 2010 7
8. Quick take
Surya Roshni
Valuation
Currently, Surya Roshni is trading at 5.7x and 1.0x its FY2012E EPS and book
value, respectively. Historically, the company has traded in the range of 3.4x to
9.5x its one-year forward EPS, with the average of 6.6x one-year forward EPS.
We have valued the company using the SOTP method, valuing the standalone
business at 6.6x FY2012E EPS of `19.9 and valuing its investment in SGST at 1.0x
its FY2010 BV. We assign a Buy rating to the stock with a Target Price of `143.
Exhibit 12: One-year forward P/E band
250
200
150
(`)
100
50
0
Apr-02 Apr-03 Apr-04 Apr-05 Apr-06 Apr-07 Apr-08 Apr-09 Apr-10
Price 2x 4x 6x 8x 10x 12x
Source: Company, Bloomberg, Angel Research
Exhibit 13: Peer comparison
Company Mcap CMP P/E (x) P/BV (x) RoE (%) CAGR (2010–12E)
(` cr) (`cr) (`) FY11E FY12E FY11E FY12E FY11E FY12E Sales PAT
Surya Roshni 315 113 8.3 5.7 1.4 1.0 19.5 20.4 23.8 39.0
Bajaj Electricals 3,263 333 19.7 15.9 5.2 4.1 30.3 29.6 20.6 32.1
Jindal Saw 5,850 212 12.0 10.0 1.5 1.3 14.2 14.0 9.2 34.9
Source: Company, Bloomberg, Angel Research
October 8, 2010 8
13. Quick take
Surya Roshni
Research Team Tel: 022 - 4040 3800 E-mail: research@angeltrade.com Website: www.angeltrade.com
DISCLAIMER
This document is solely for the personal information of the recipient, and must not be singularly used as the basis of any investment
decision. Nothing in this document should be construed as investment or financial advice. Each recipient of this document should make
such investigations as they deem necessary to arrive at an independent evaluation of an investment in the securities of the companies
referred to in this document (including the merits and risks involved), and should consult their own advisors to determine the merits and
risks of such an investment.
Angel Broking Limited, its affiliates, directors, its proprietary trading and investment businesses may, from time to time, make
investment decisions that are inconsistent with or contradictory to the recommendations expressed herein. The views contained in this
document are those of the analyst, and the company may or may not subscribe to all the views expressed within.
Reports based on technical and derivative analysis center on studying charts of a stock's price movement, outstanding positions and
trading volume, as opposed to focusing on a company's fundamentals and, as such, may not match with a report on a company's
fundamentals.
The information in this document has been printed on the basis of publicly available information, internal data and other reliable
sources believed to be true, but we do not represent that it is accurate or complete and it should not be relied on as such, as this
document is for general guidance only. Angel Broking Limited or any of its affiliates/ group companies shall not be in any way
responsible for any loss or damage that may arise to any person from any inadvertent error in the information contained in this report.
Angel Broking Limited has not independently verified all the information contained within this document. Accordingly, we cannot testify,
nor make any representation or warranty, express or implied, to the accuracy, contents or data contained within this document. While
Angel Broking Limited endeavours to update on a reasonable basis the information discussed in this material, there may be regulatory,
compliance, or other reasons that prevent us from doing so.
This document is being supplied to you solely for your information, and its contents, information or data may not be reproduced,
redistributed or passed on, directly or indirectly.
Angel Broking Limited and its affiliates may seek to provide or have engaged in providing corporate finance, investment banking or
other advisory services in a merger or specific transaction to the companies referred to in this report, as on the date of this report or in
the past.
Neither Angel Broking Limited, nor its directors, employees or affiliates shall be liable for any loss or damage that may arise from or in
connection with the use of this information.
Note: Please refer to the important `Stock Holding Disclosure' report on the Angel website (Research Section). Also, please
refer to the latest update on respective stocks for the disclosure status in respect of those stocks. Angel Broking Limited and
its affiliates may have investment positions in the stocks recommended in this report.
Disclosure of Interest Statement Surya Roshni
1. Analyst ownership of the stock No
2. Angel and its Group companies ownership of the stock Yes
3. Angel and its Group companies' Directors ownership of the stock No
4. Broking relationship with company covered No
Note: We have not considered any Exposure below ` 1 lakh for Angel, its Group companies and Directors
Ratings (Returns): Buy (> 15%) Accumulate (5% to 15%) Neutral (-5 to 5%)
Reduce (-5% to 15%) Sell (< -15%)
October 8, 2010 13
14. Quick take
Surya Roshni
Address: Acme Plaza, ‘A’ Wing, 3rd Floor, M.V. Road, Opp. Sangam Cinema, Andheri (E), Mumbai - 400 059.
Tel: (022) 3952 4568 / 4040 3800
Research Team
Fundamental:
Sarabjit Kour Nangra VP-Research, Pharmaceutical sarabjit@angelbroking.com
Vaibhav Agrawal VP-Research, Banking vaibhav.agrawal@angelbroking.com
Vaishali Jajoo Automobile vaishali.jajoo@angelbroking.com
Shailesh Kanani Infrastructure, Real Estate shailesh.kanani@angelbroking.com
Anand Shah FMCG, Media anand.shah@angelbroking.com
Deepak Pareek Oil & Gas deepak.pareek@angelbroking.com
Sushant Dalmia Pharmaceutical sushant.dalmia@angelbroking.com
Rupesh Sankhe Cement, Power rupeshd.sankhe@angelbroking.com
Param Desai Real Estate, Logistics, Shipping paramv.desai@angelbroking.com
Sageraj Bariya Fertiliser, Mid-cap sageraj.bariya@angelbroking.com
Viraj Nadkarni Retail, Hotels, Mid-cap virajm.nadkarni@angelbroking.com
Paresh Jain Metals & Mining pareshn.jain@angelbroking.com
Amit Rane Banking amitn.rane@angelbroking.com
John Perinchery Capital Goods john.perinchery@angelbroking.com
Srishti Anand IT, Telecom srishti.anand@angelbroking.com
Jai Sharda Mid-cap jai.sharda@angelbroking.com
Sharan Lillaney Mid-cap sharanb.lillaney@angelbroking.com
Naitik Mody Mid-cap naitiky.mody@angelbroking.com
Amit Vora Research Associate (Oil & Gas) amit.vora@angelbroking.com
V Srinivasan Research Associate (Cement, Power) v.srinivasan@angelbroking.com
Mihir Salot Research Associate (Logistics, Shipping) mihirr.salot@angelbroking.com
Chitrangda Kapur Research Associate (FMCG, Media) chitrangdar.kapur@angelbroking.com
Pooja Jain Research Associate (Metals & Mining) pooja.j@angelbroking.com
Yaresh Kothari Research Associate (Automobile) yareshb.kothari@angelbroking.com
Shrinivas Bhutda Research Associate (Banking) shrinivas.bhutda@angelbroking.com
Sreekanth P.V.S Research Associate (FMCG, Media) sreekanth.s@angelbroking.com
Hemang Thaker Research Associate (Capital Goods) hemang.thaker@angelbroking.com
Nitin Arora Research Associate (Infra, Real Estate) nitin.arora@angelbroking.com
Technicals:
Shardul Kulkarni Sr. Technical Analyst shardul.kulkarni@angelbroking.com
Mileen Vasudeo Technical Analyst vasudeo.kamalakant@angelbroking.com
Derivatives:
Siddarth Bhamre Head - Derivatives siddarth.bhamre@angelbroking.com
Jaya Agarwal Derivative Analyst jaya.agarwal@angelbroking.com
Institutional Sales Team:
Mayuresh Joshi VP - Institutional Sales mayuresh.joshi@angelbroking.com
Abhimanyu Sofat AVP - Institutional Sales abhimanyu.sofat@angelbroking.com
Nitesh Jalan Sr. Manager niteshk.jalan@angelbroking.com
Pranav Modi Sr. Manager pranavs.modi@angelbroking.com
Sandeep Jangir Sr. Manager sandeepp.jangir@angelbroking.com
Ganesh Iyer Sr. Manager ganeshb.Iyer@angelbroking.com
Jay Harsora Sr. Dealer jayr.harsora@angelbroking.com
Meenakshi Chavan Dealer meenakshis.chavan@angelbroking.com
Gaurang Tisani Dealer gaurangp.tisani@angelbroking.com
Production Team:
Bharathi Shetty Research Editor bharathi.shetty@angelbroking.com
Simran Kaur Research Editor simran.kaur@angelbroking.com
Bharat Patil Production bharat.patil@angelbroking.com
Dilip Patel Production dilipm.patel@angelbroking.com
Angel Broking Ltd: BSE Sebi Regn No : INB 010996539 / CDSL Regn No: IN - DP - CDSL - 234 - 2004 / PMS Regn Code: PM/INP000001546 Angel Securities Ltd:BSE: INB010994639/INF010994639 NSE: INB230994635/INF230994635 Membership numbers: BSE 028/NSE:09946
Angel Capital & Debt Market Ltd: INB 231279838 / NSE FNO: INF 231279838 / NSE Member code -12798 Angel Commodities Broking (P) Ltd: MCX Member ID: 12685 / FMC Regn No: MCX / TCM / CORP / 0037 NCDEX : Member ID 00220 / FMC Regn No: NCDEX / TCM / CORP / 0302
October 8, 2010 14