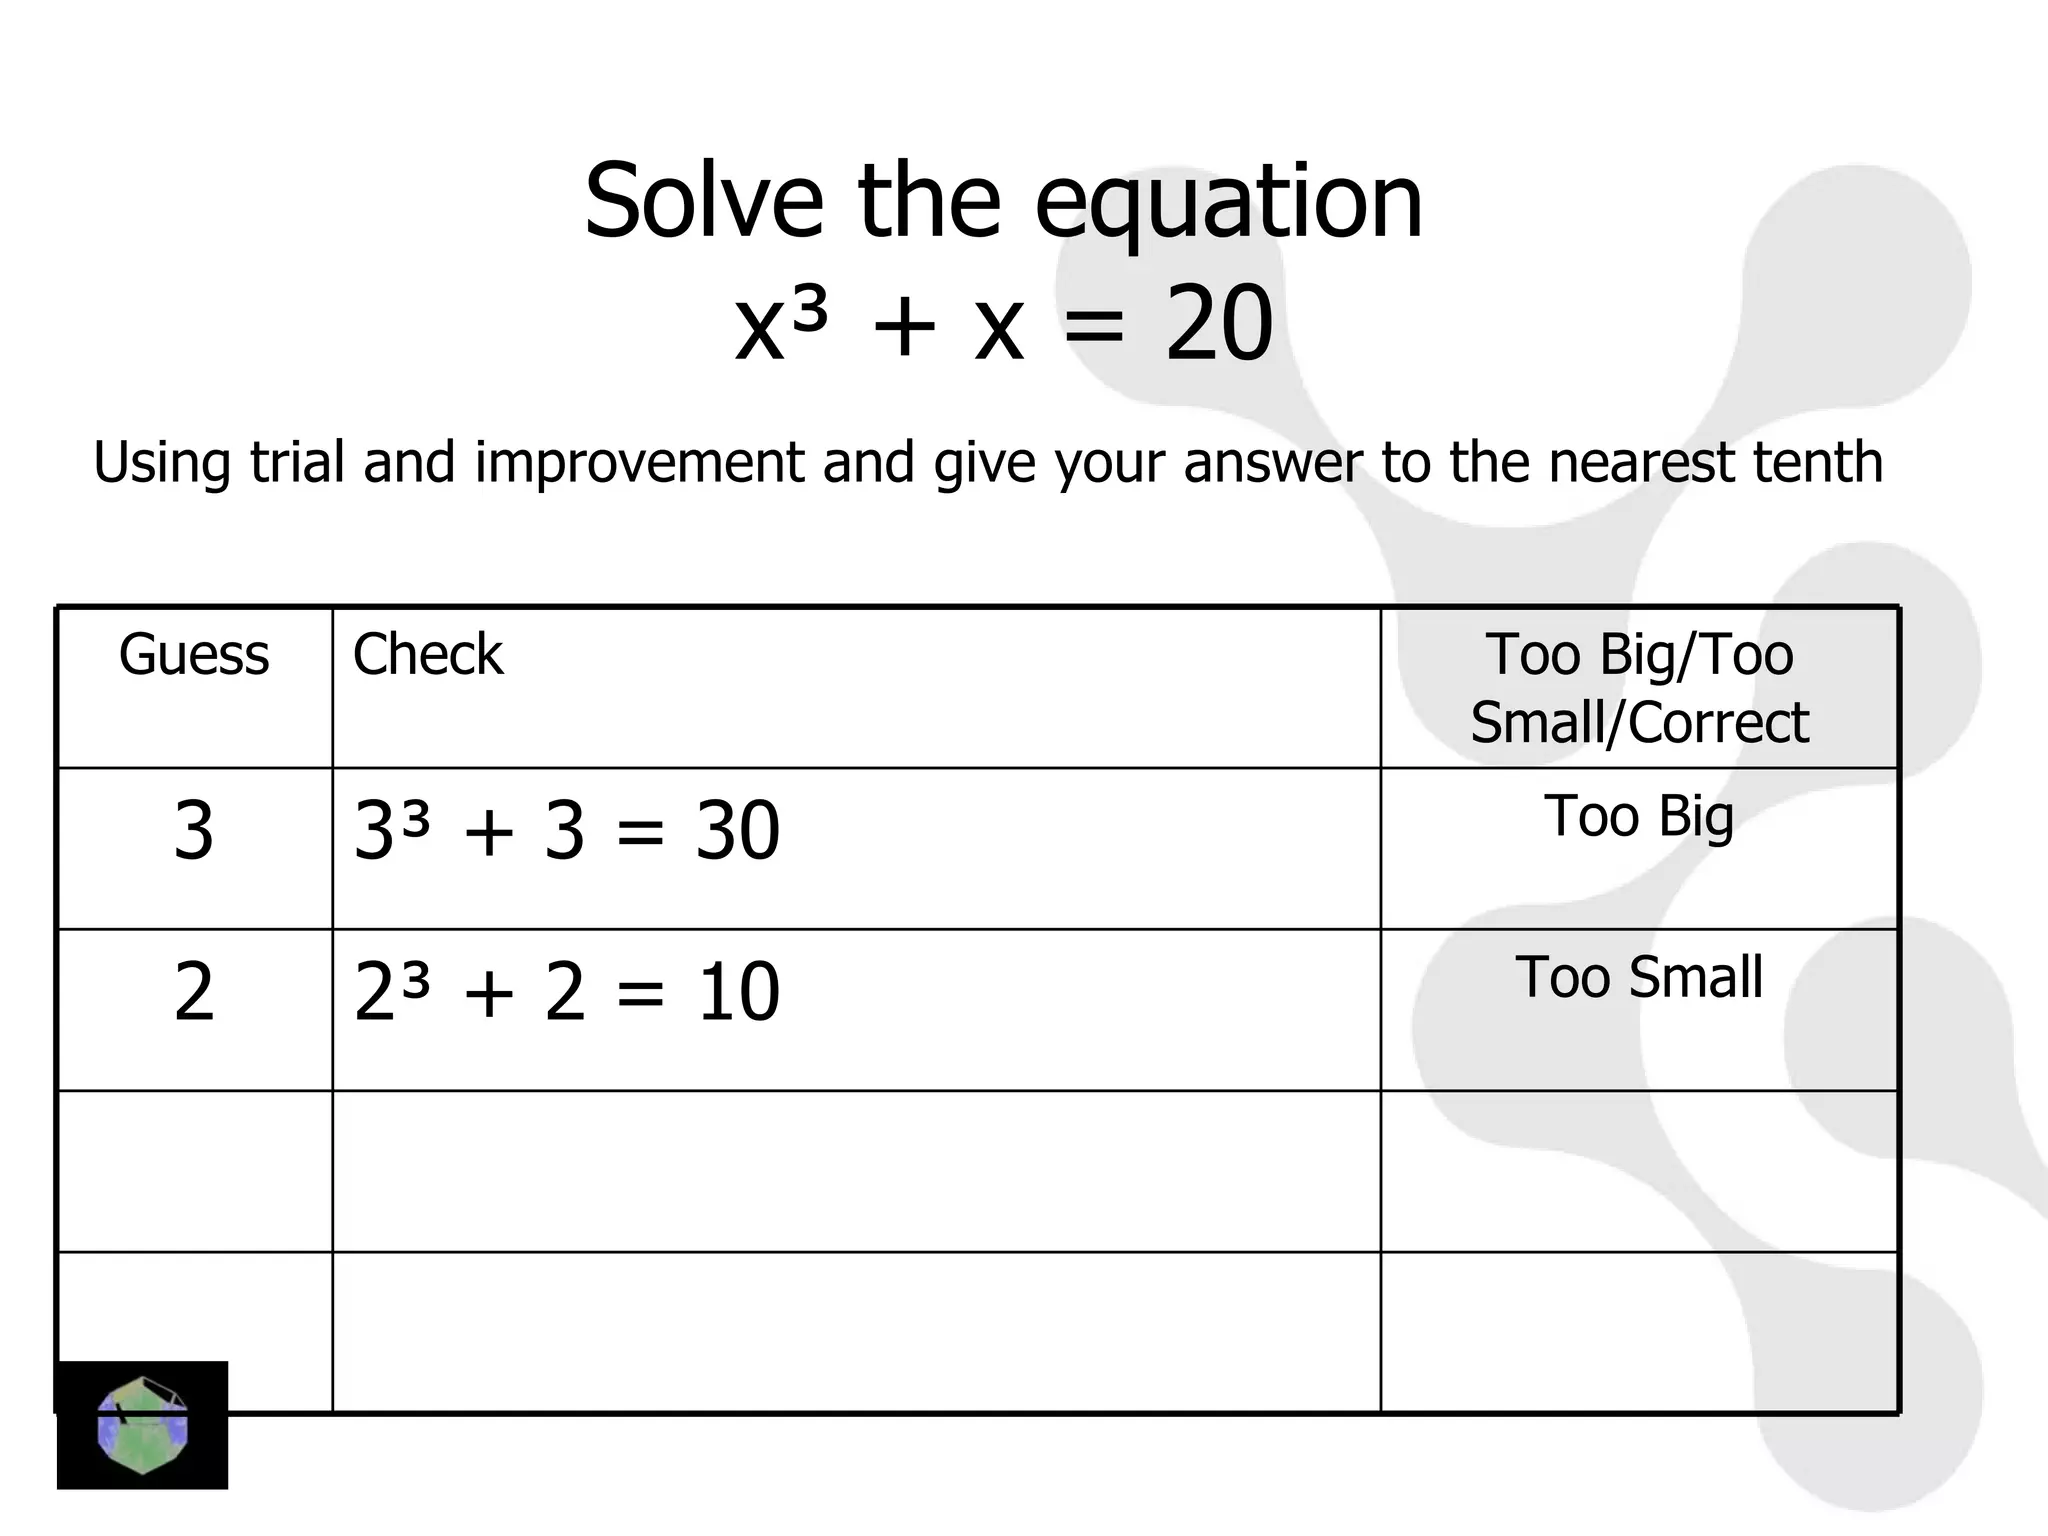
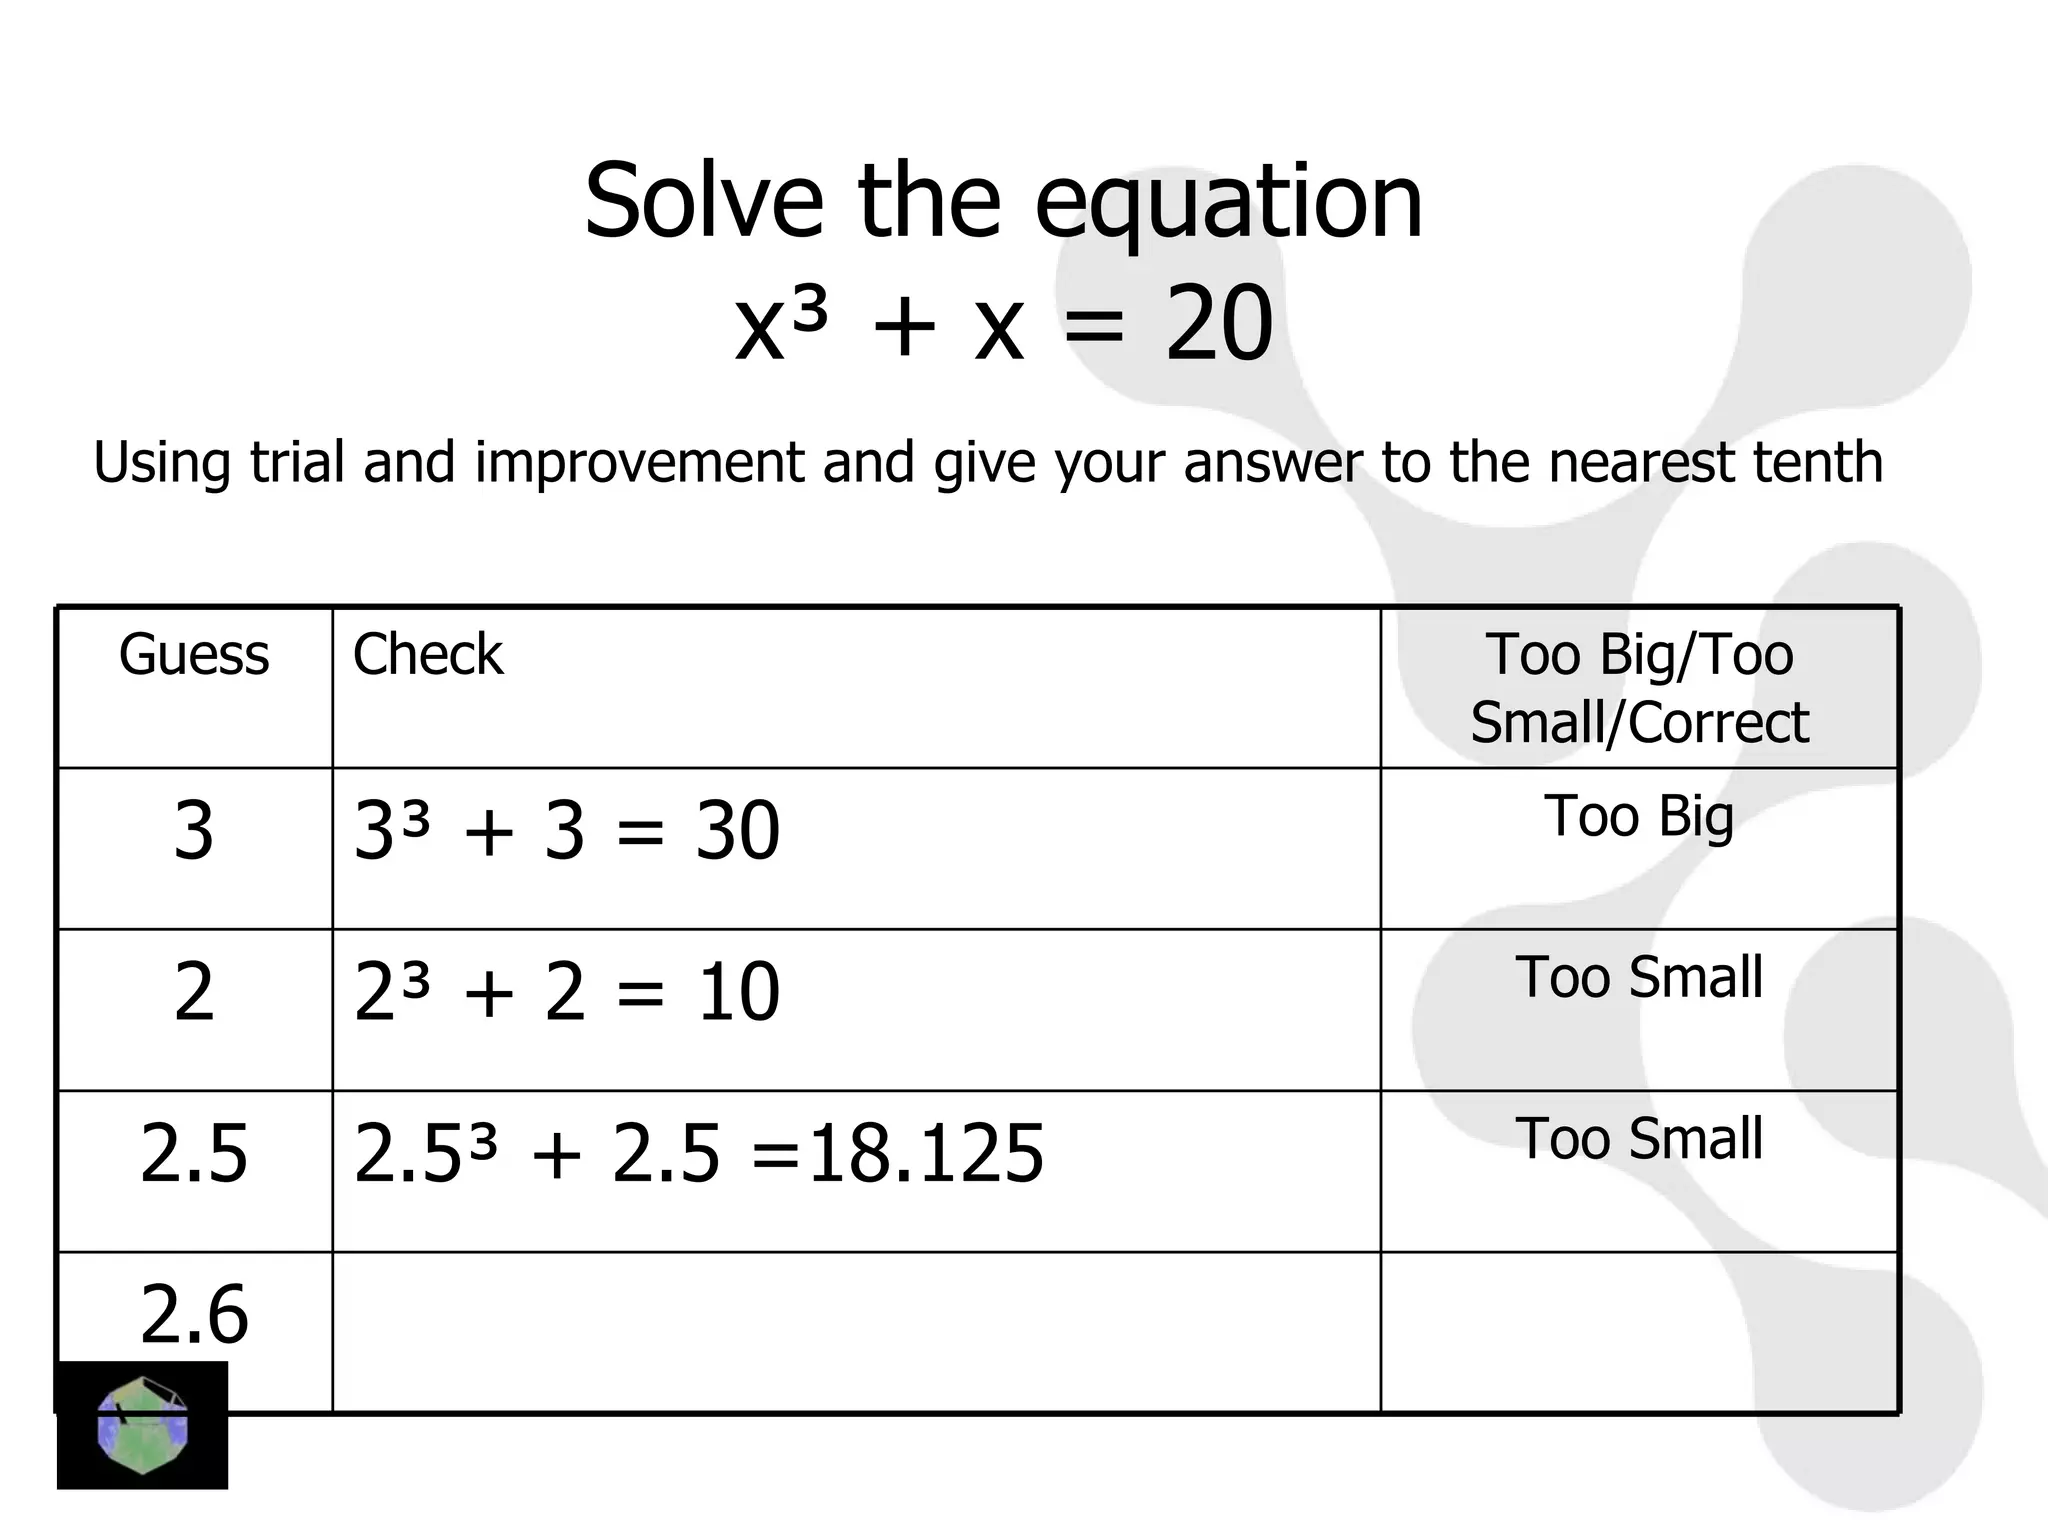
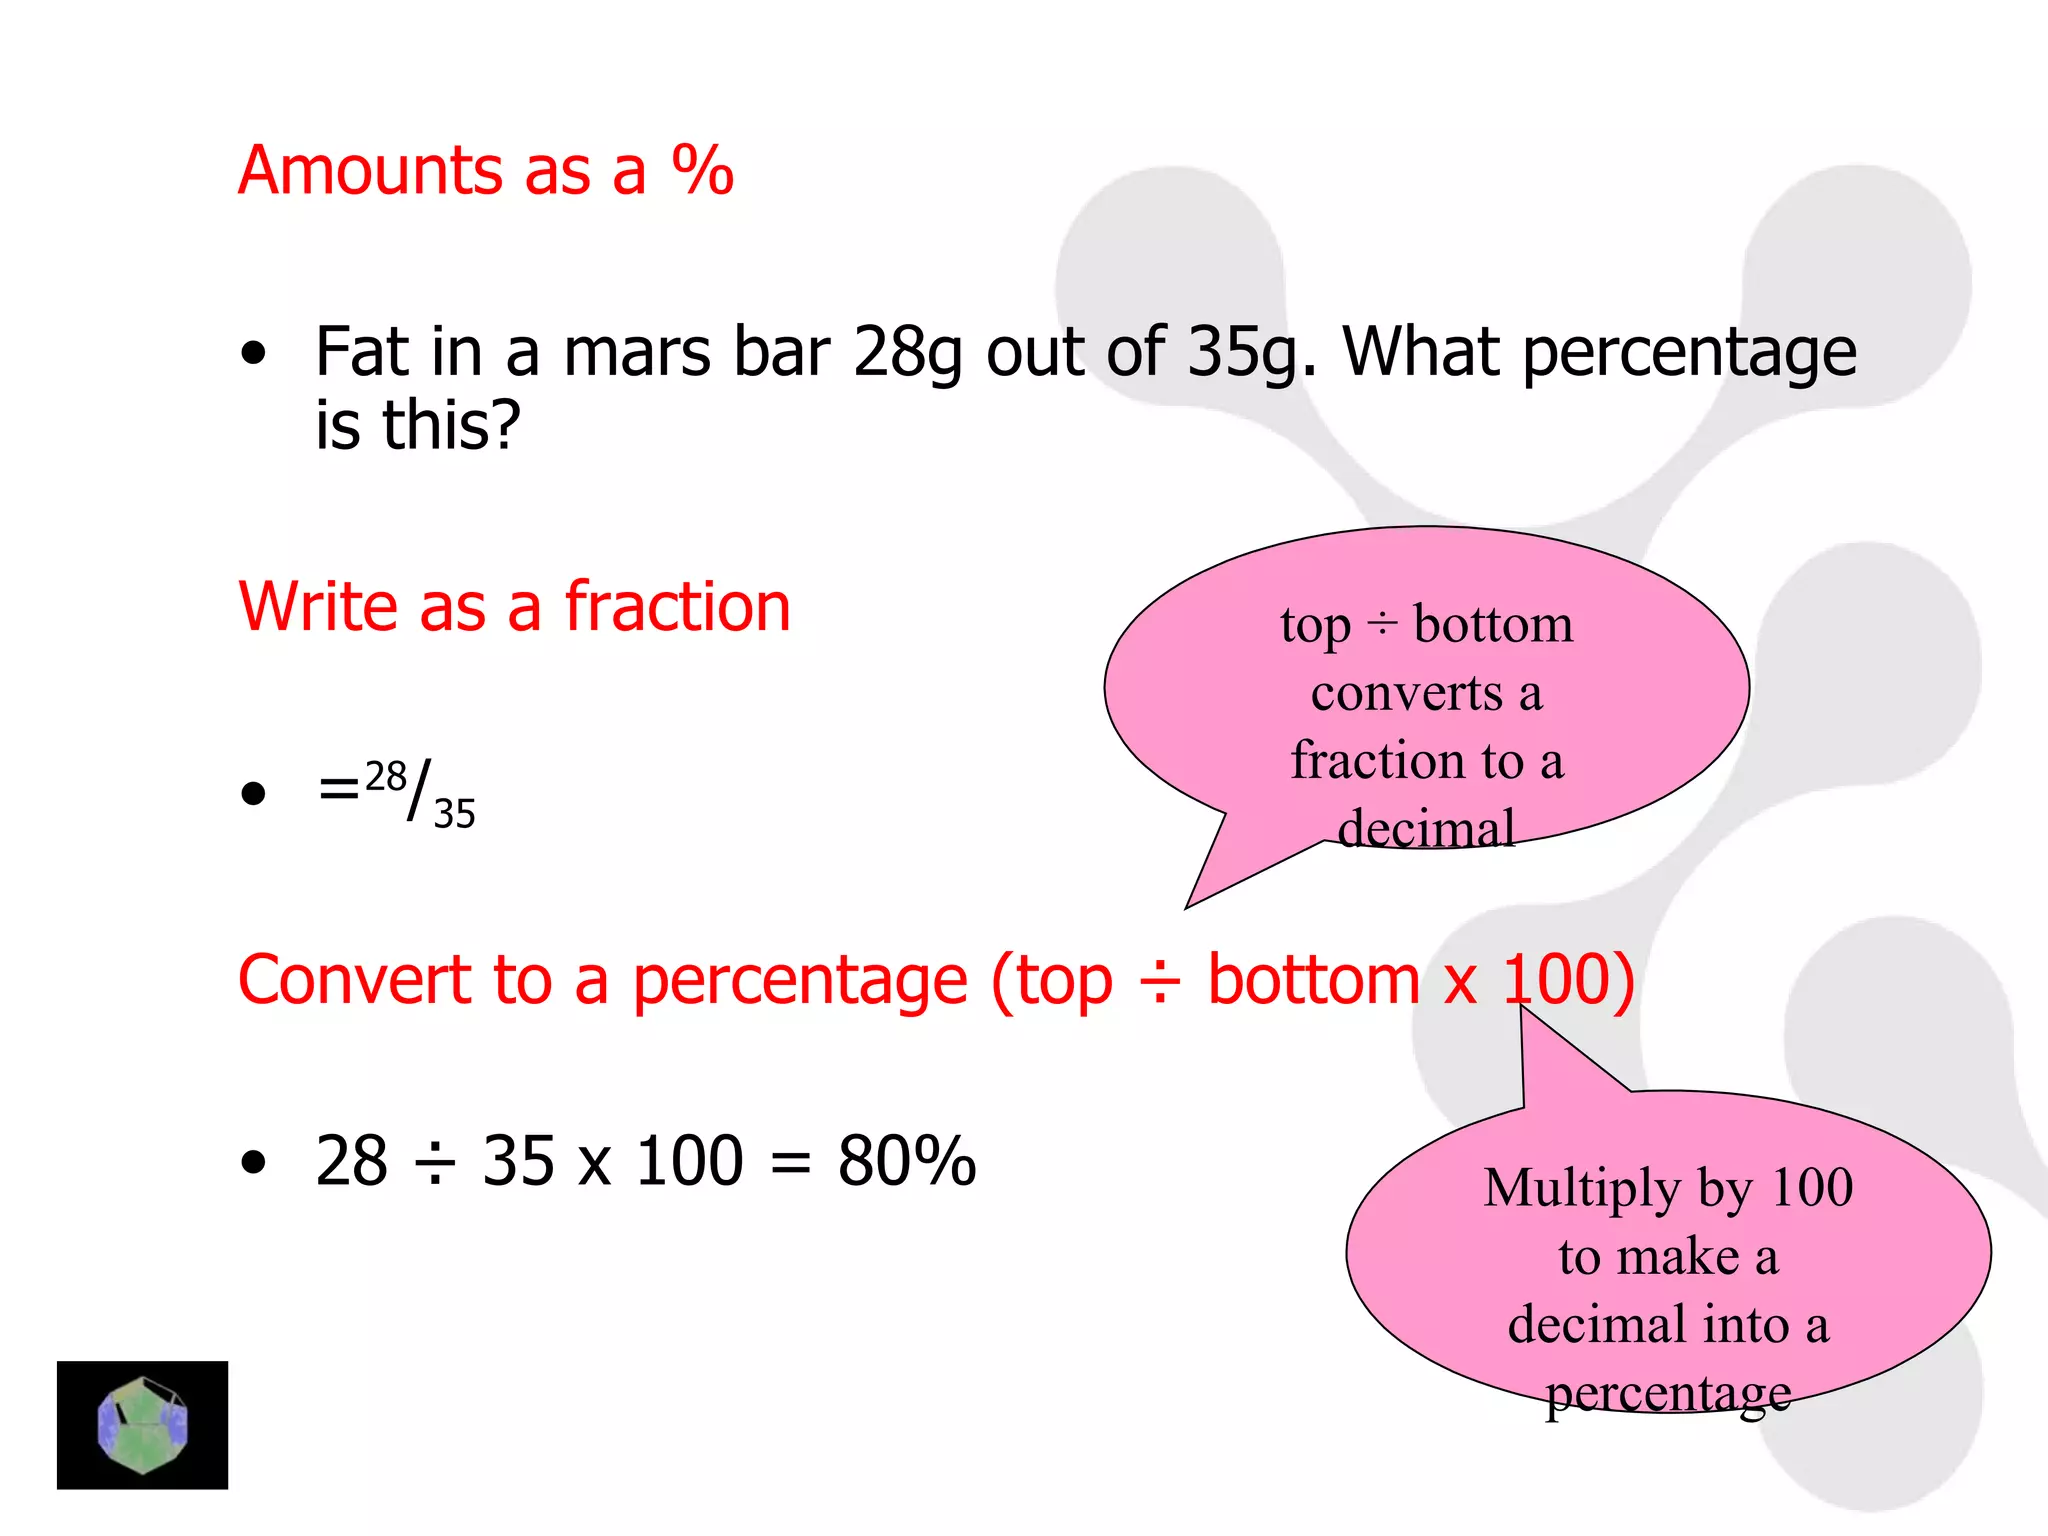
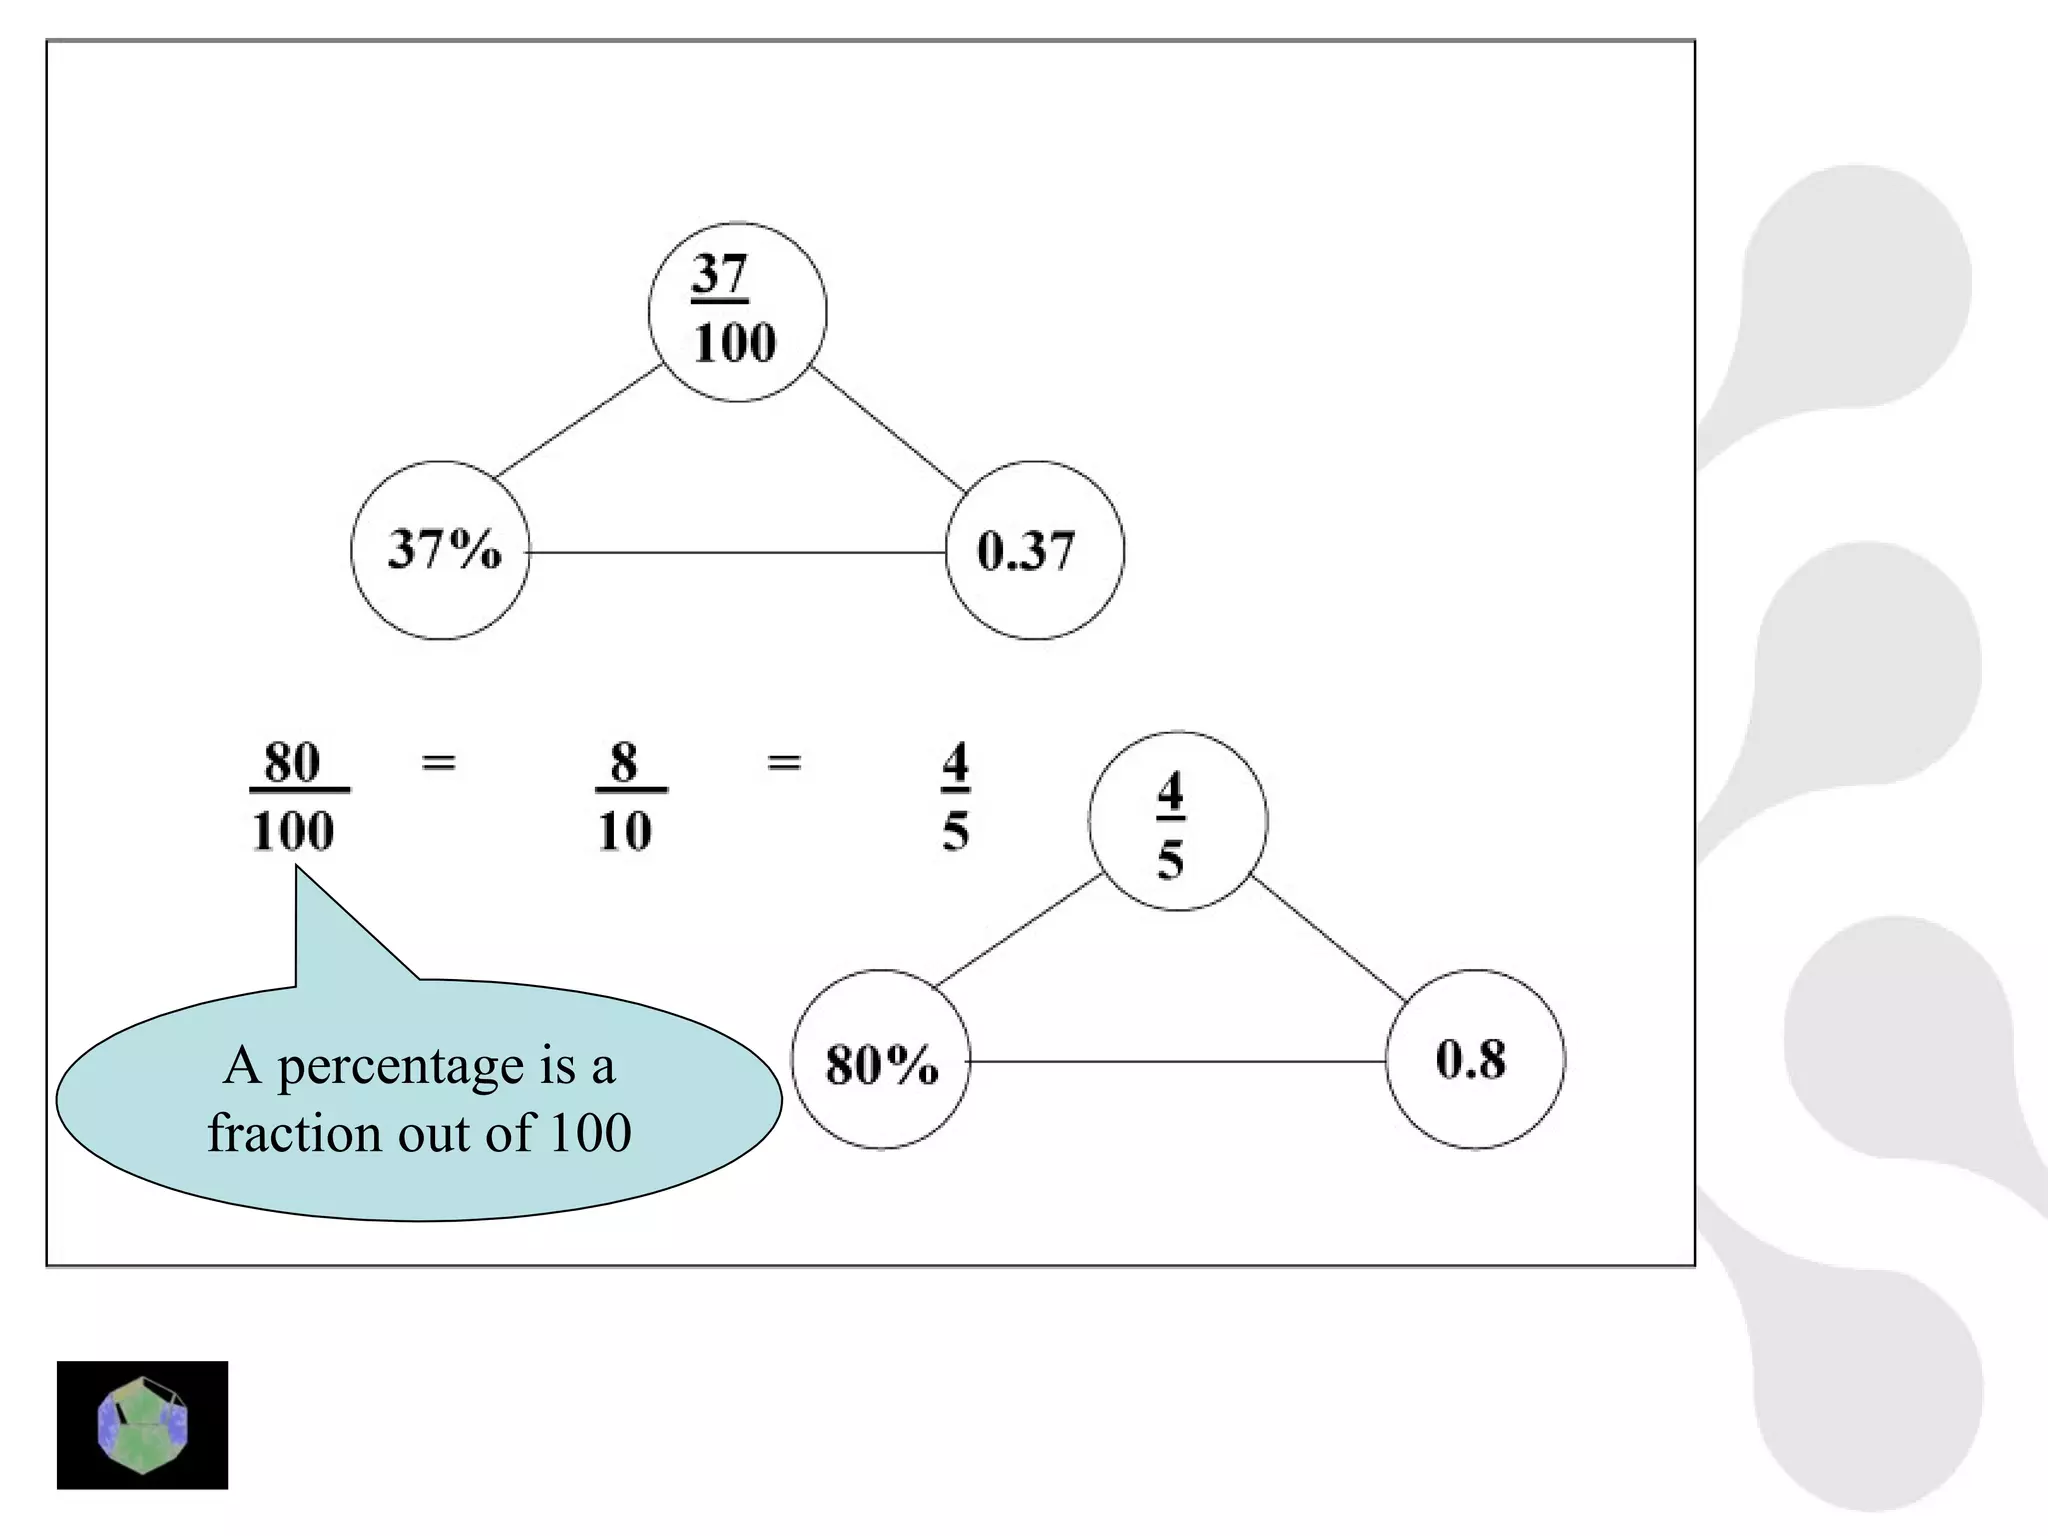
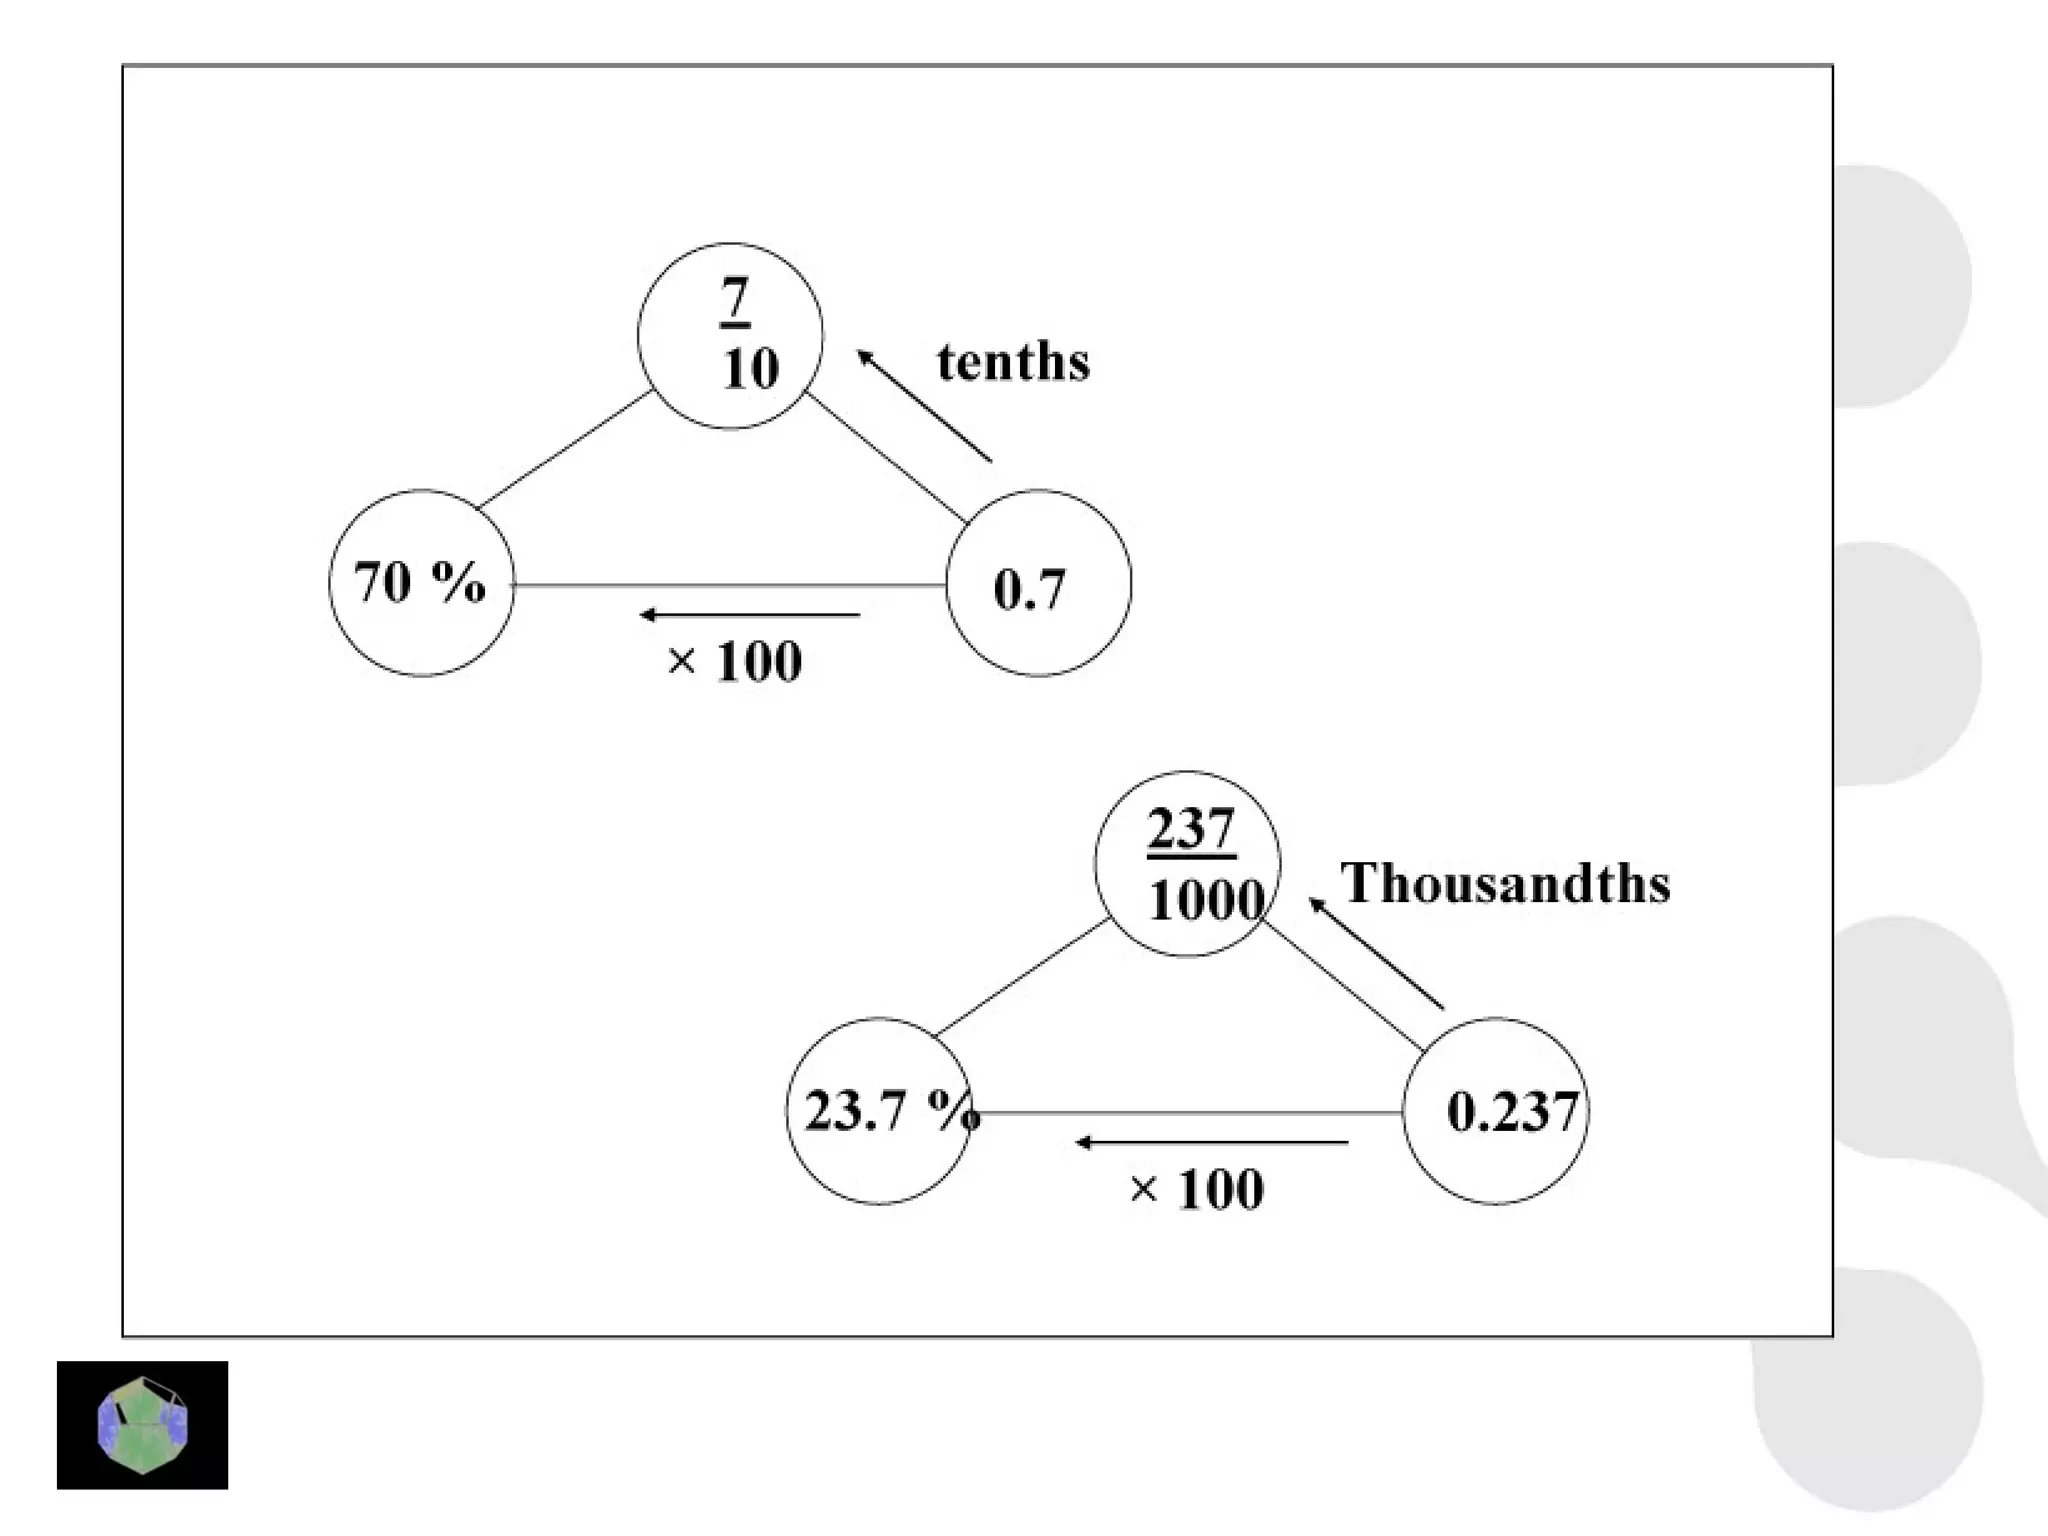
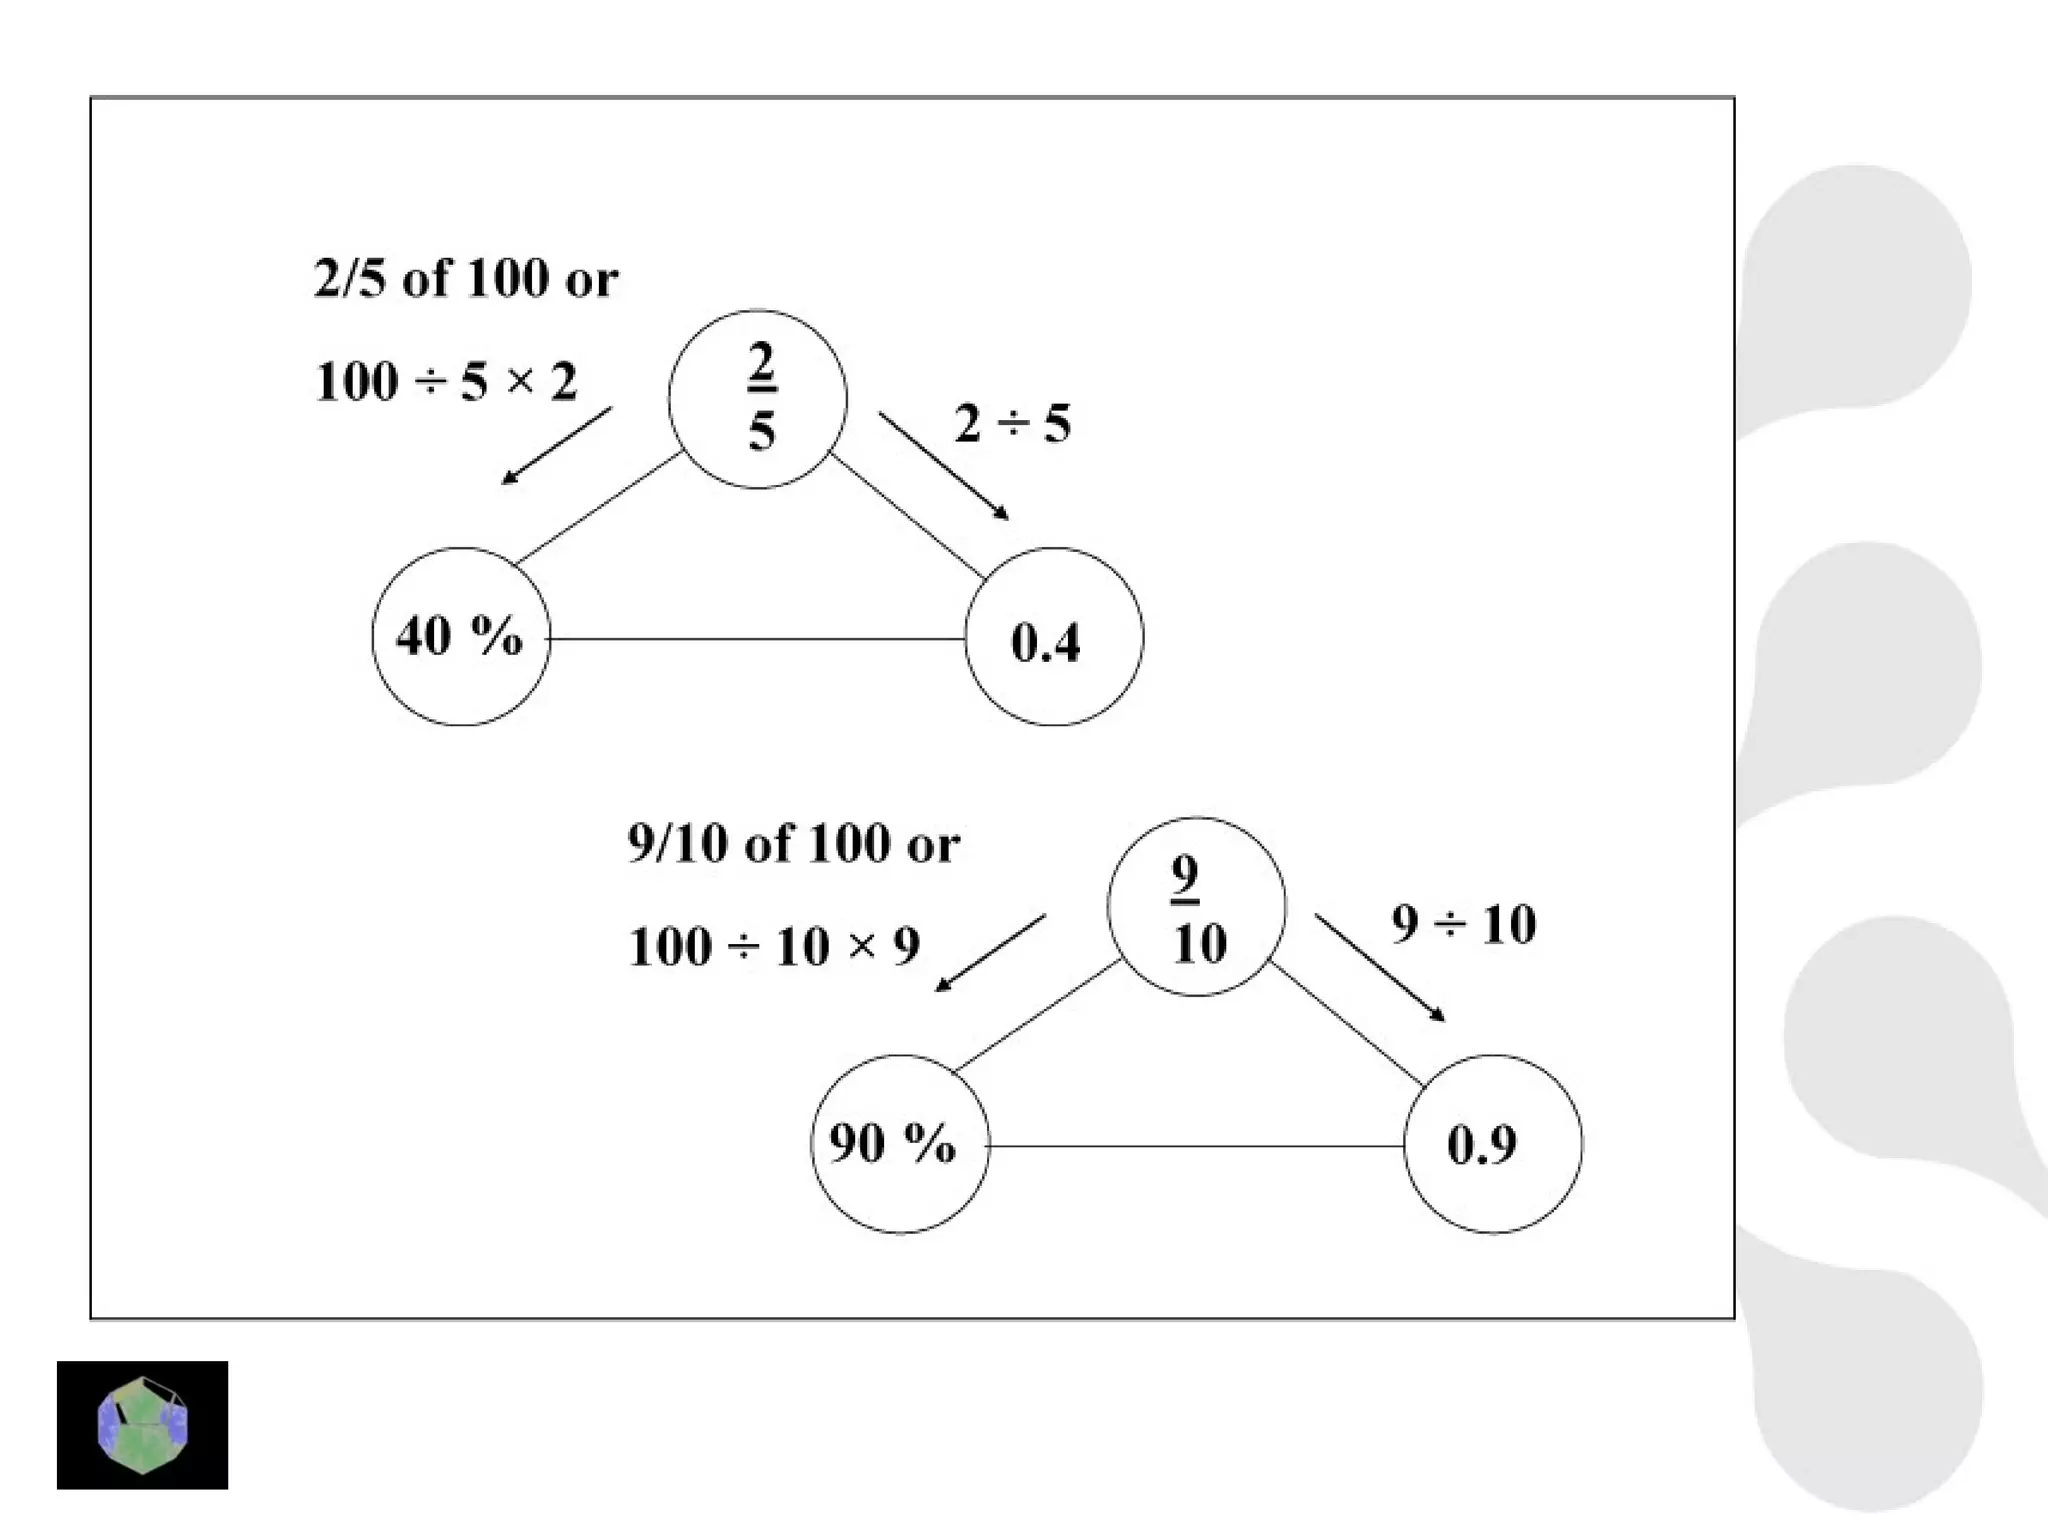
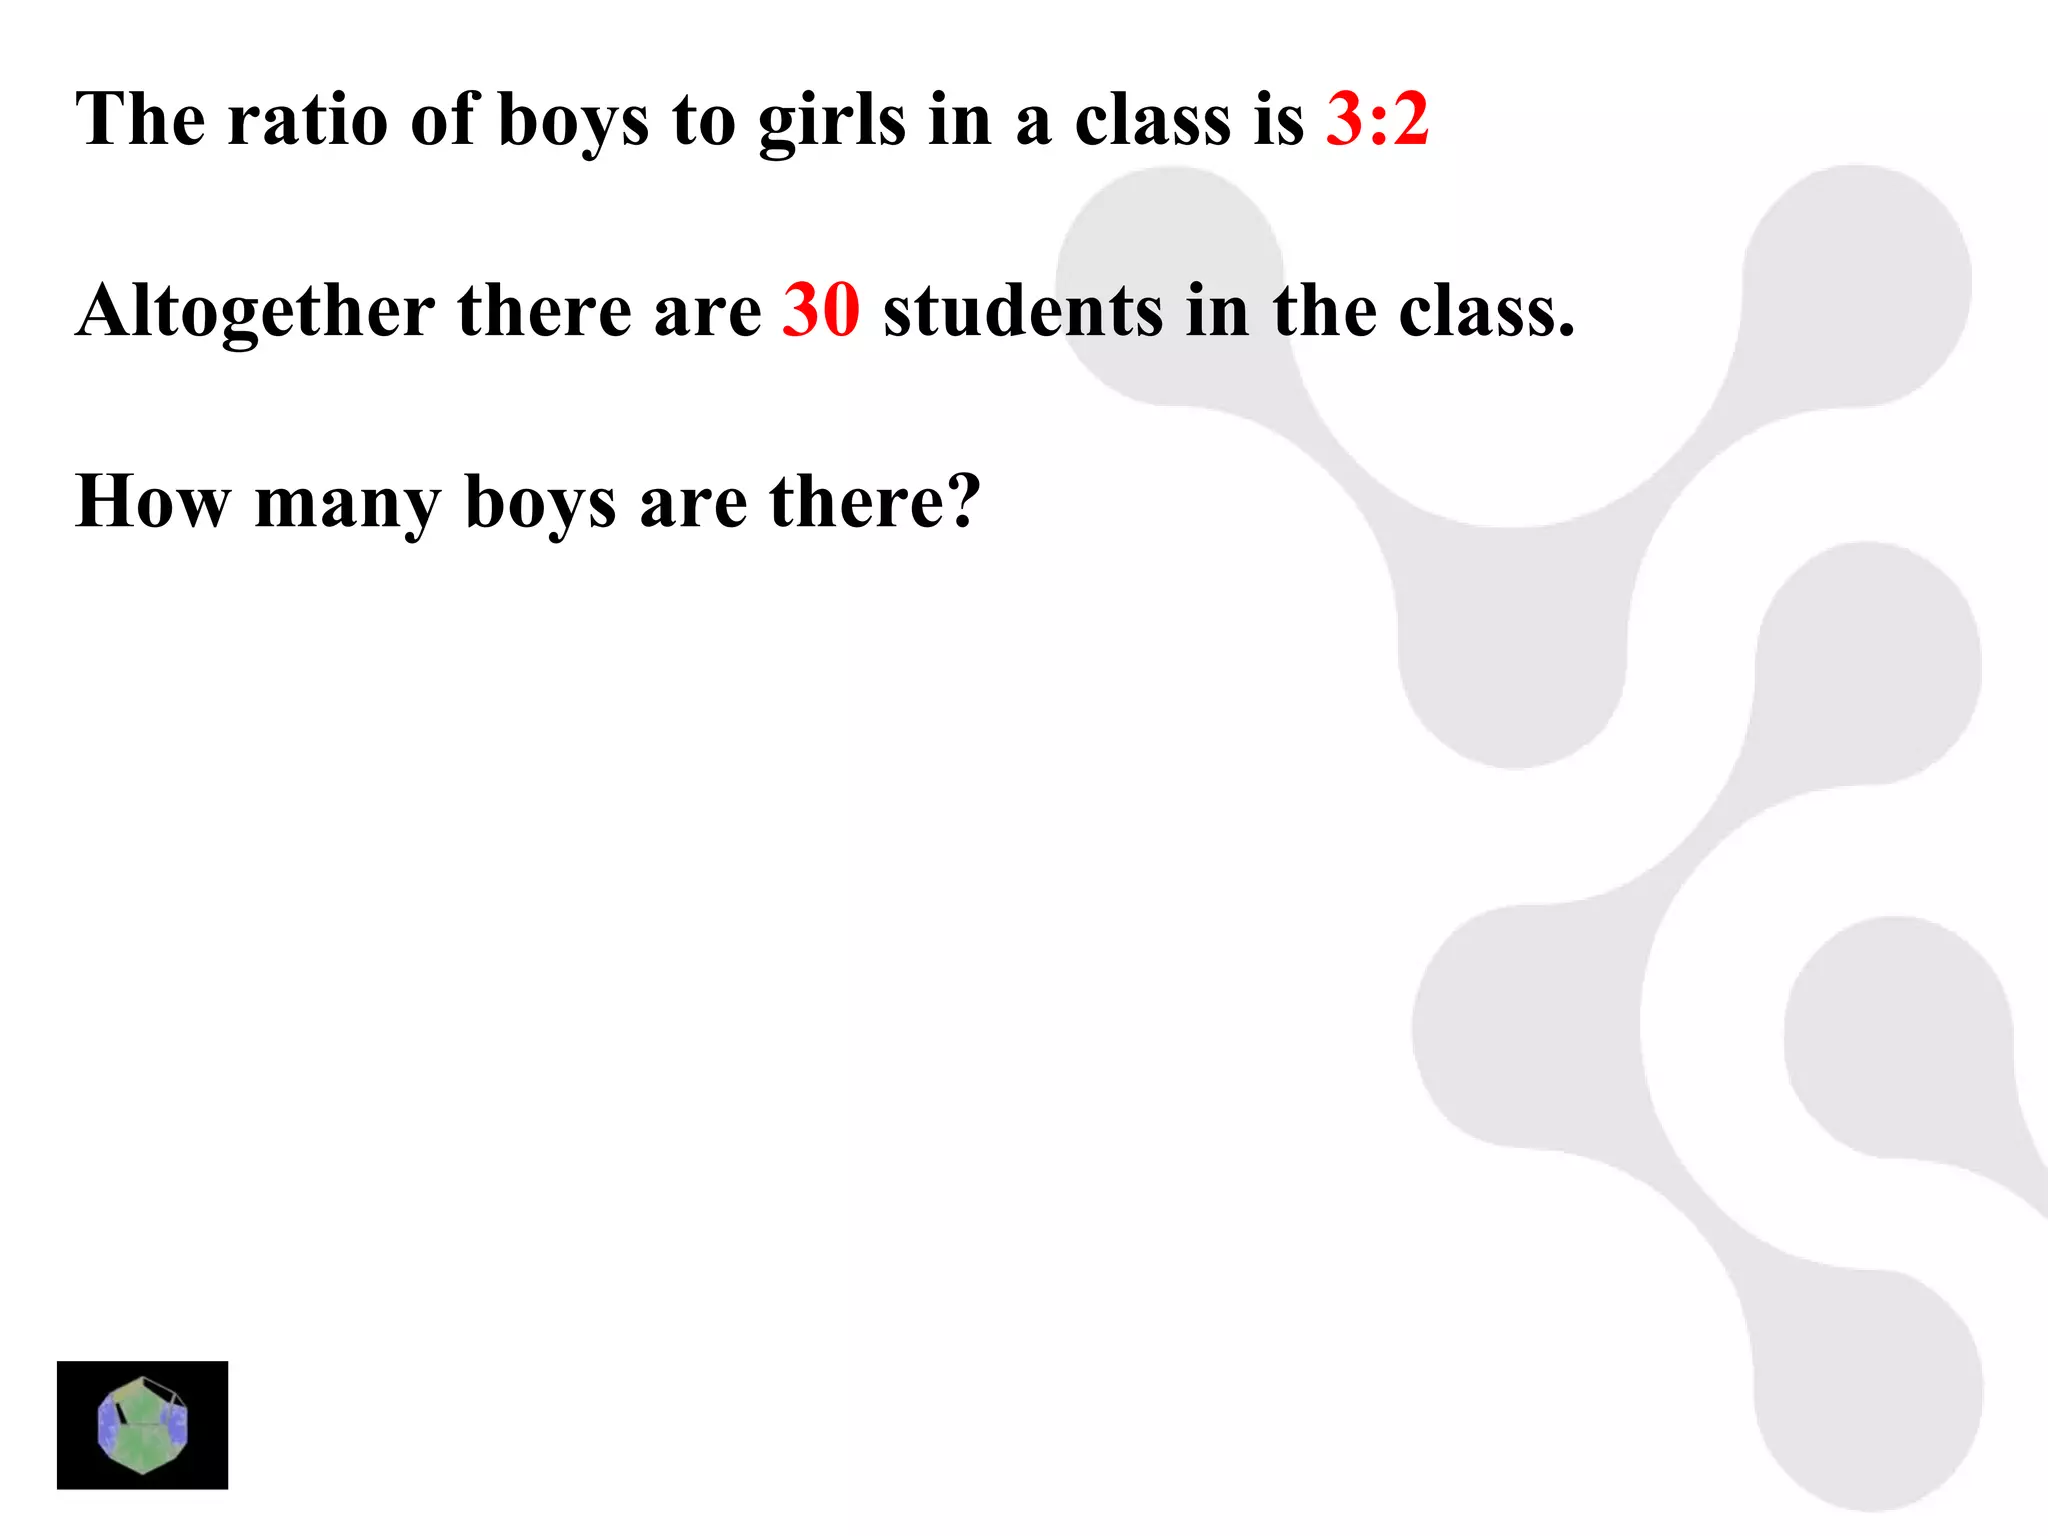
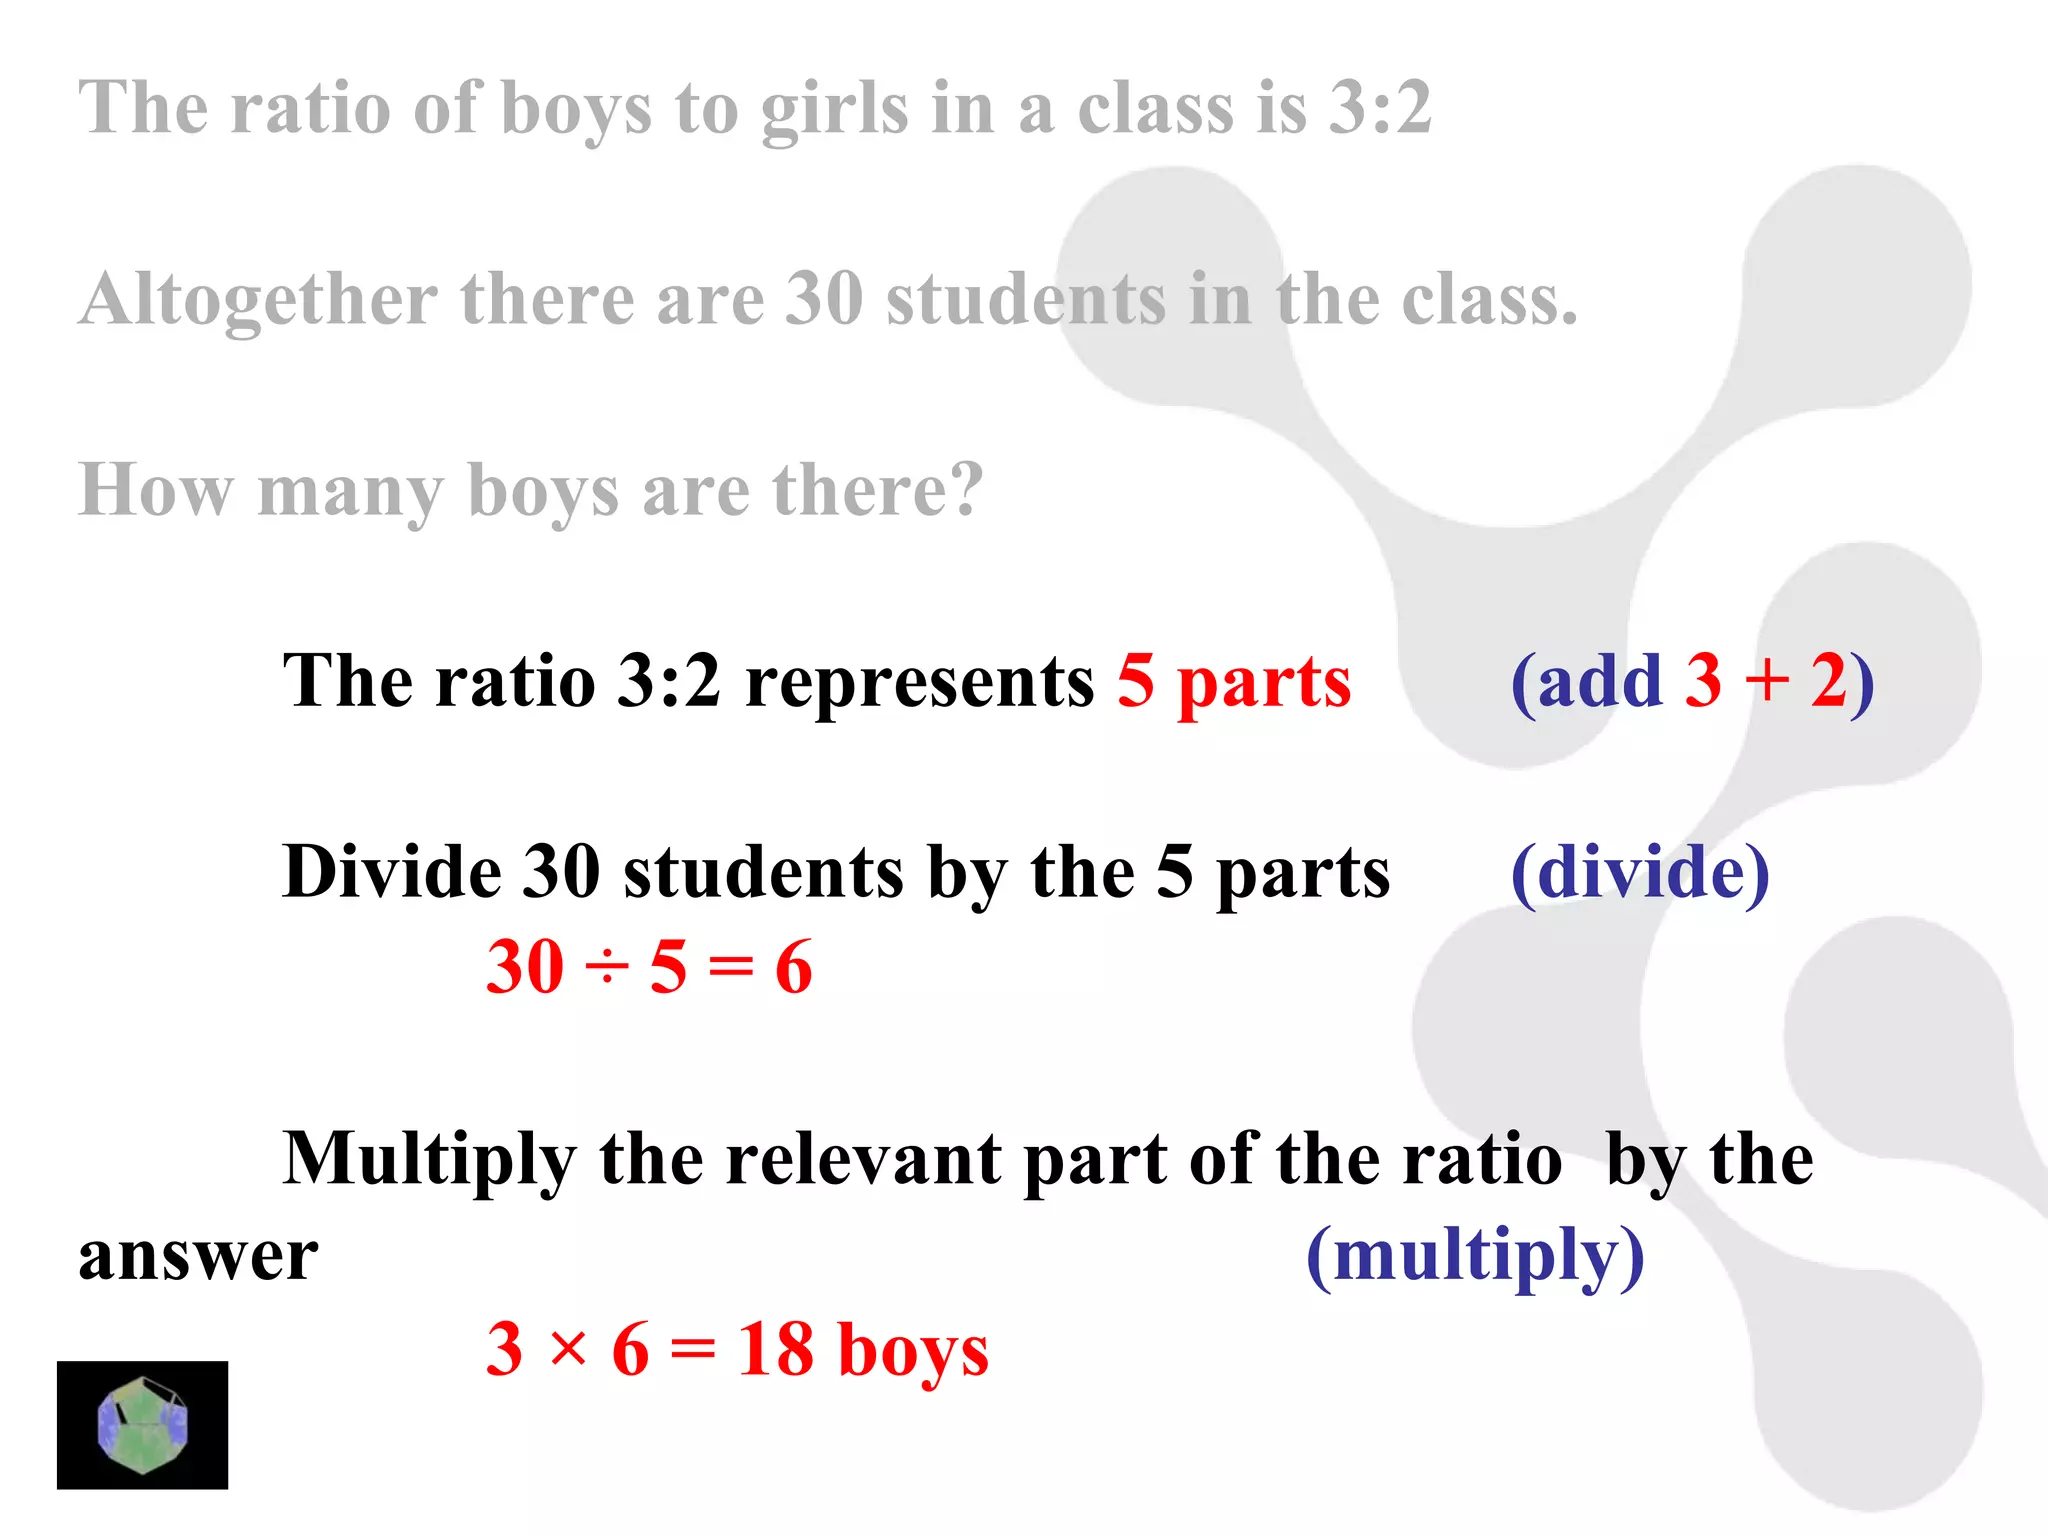
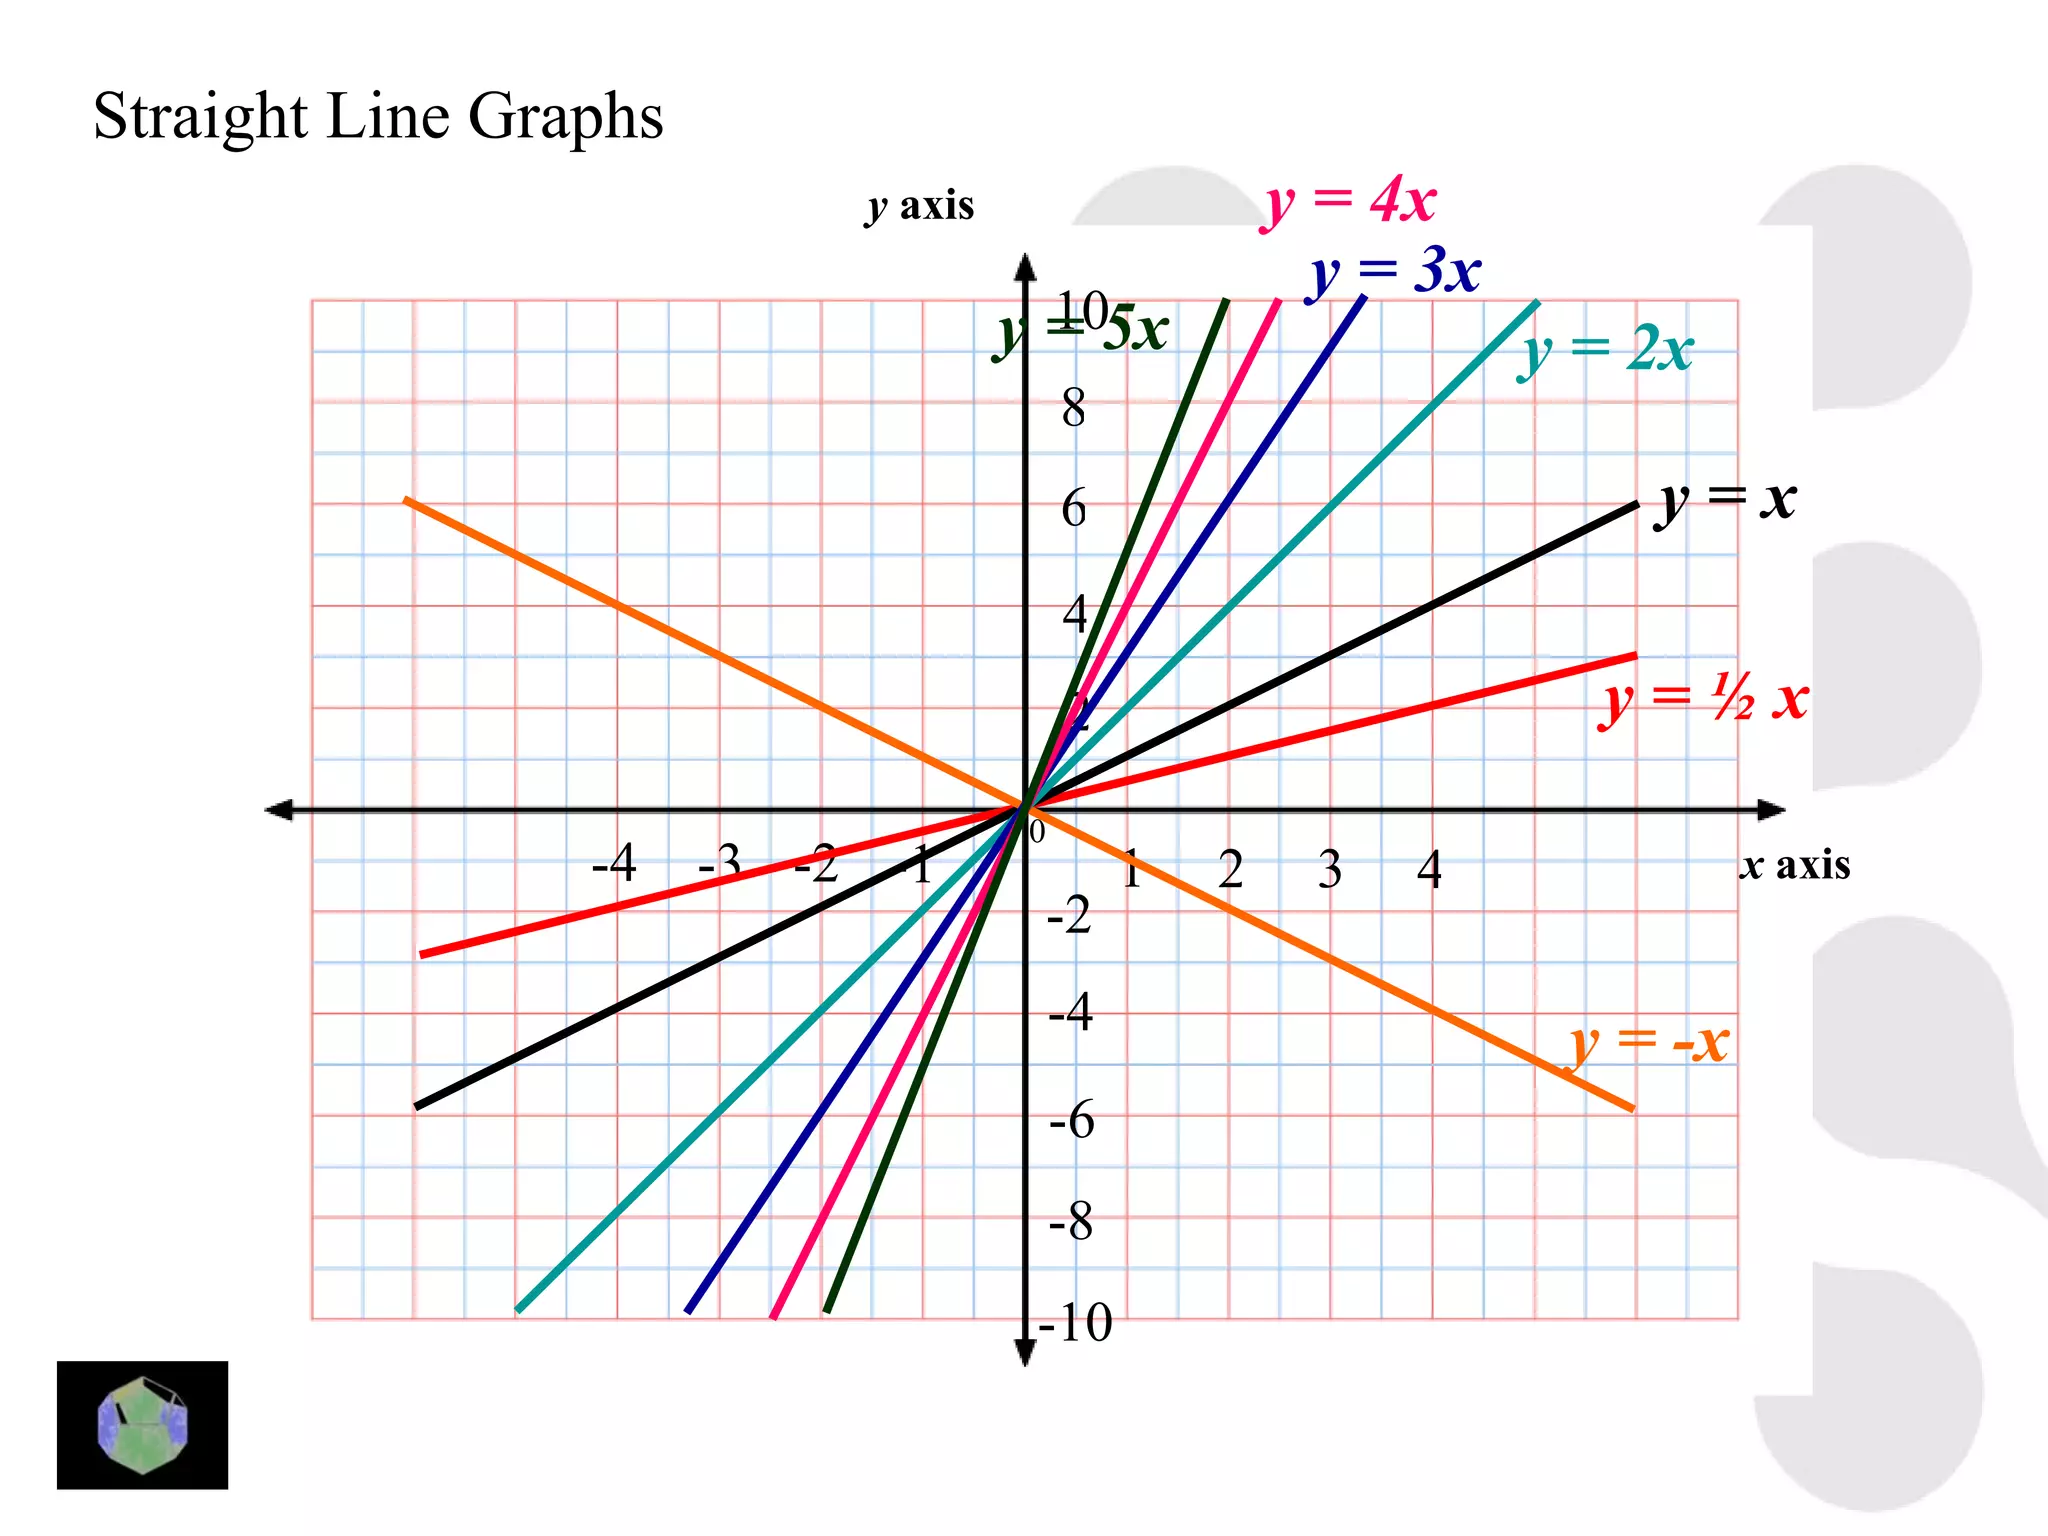
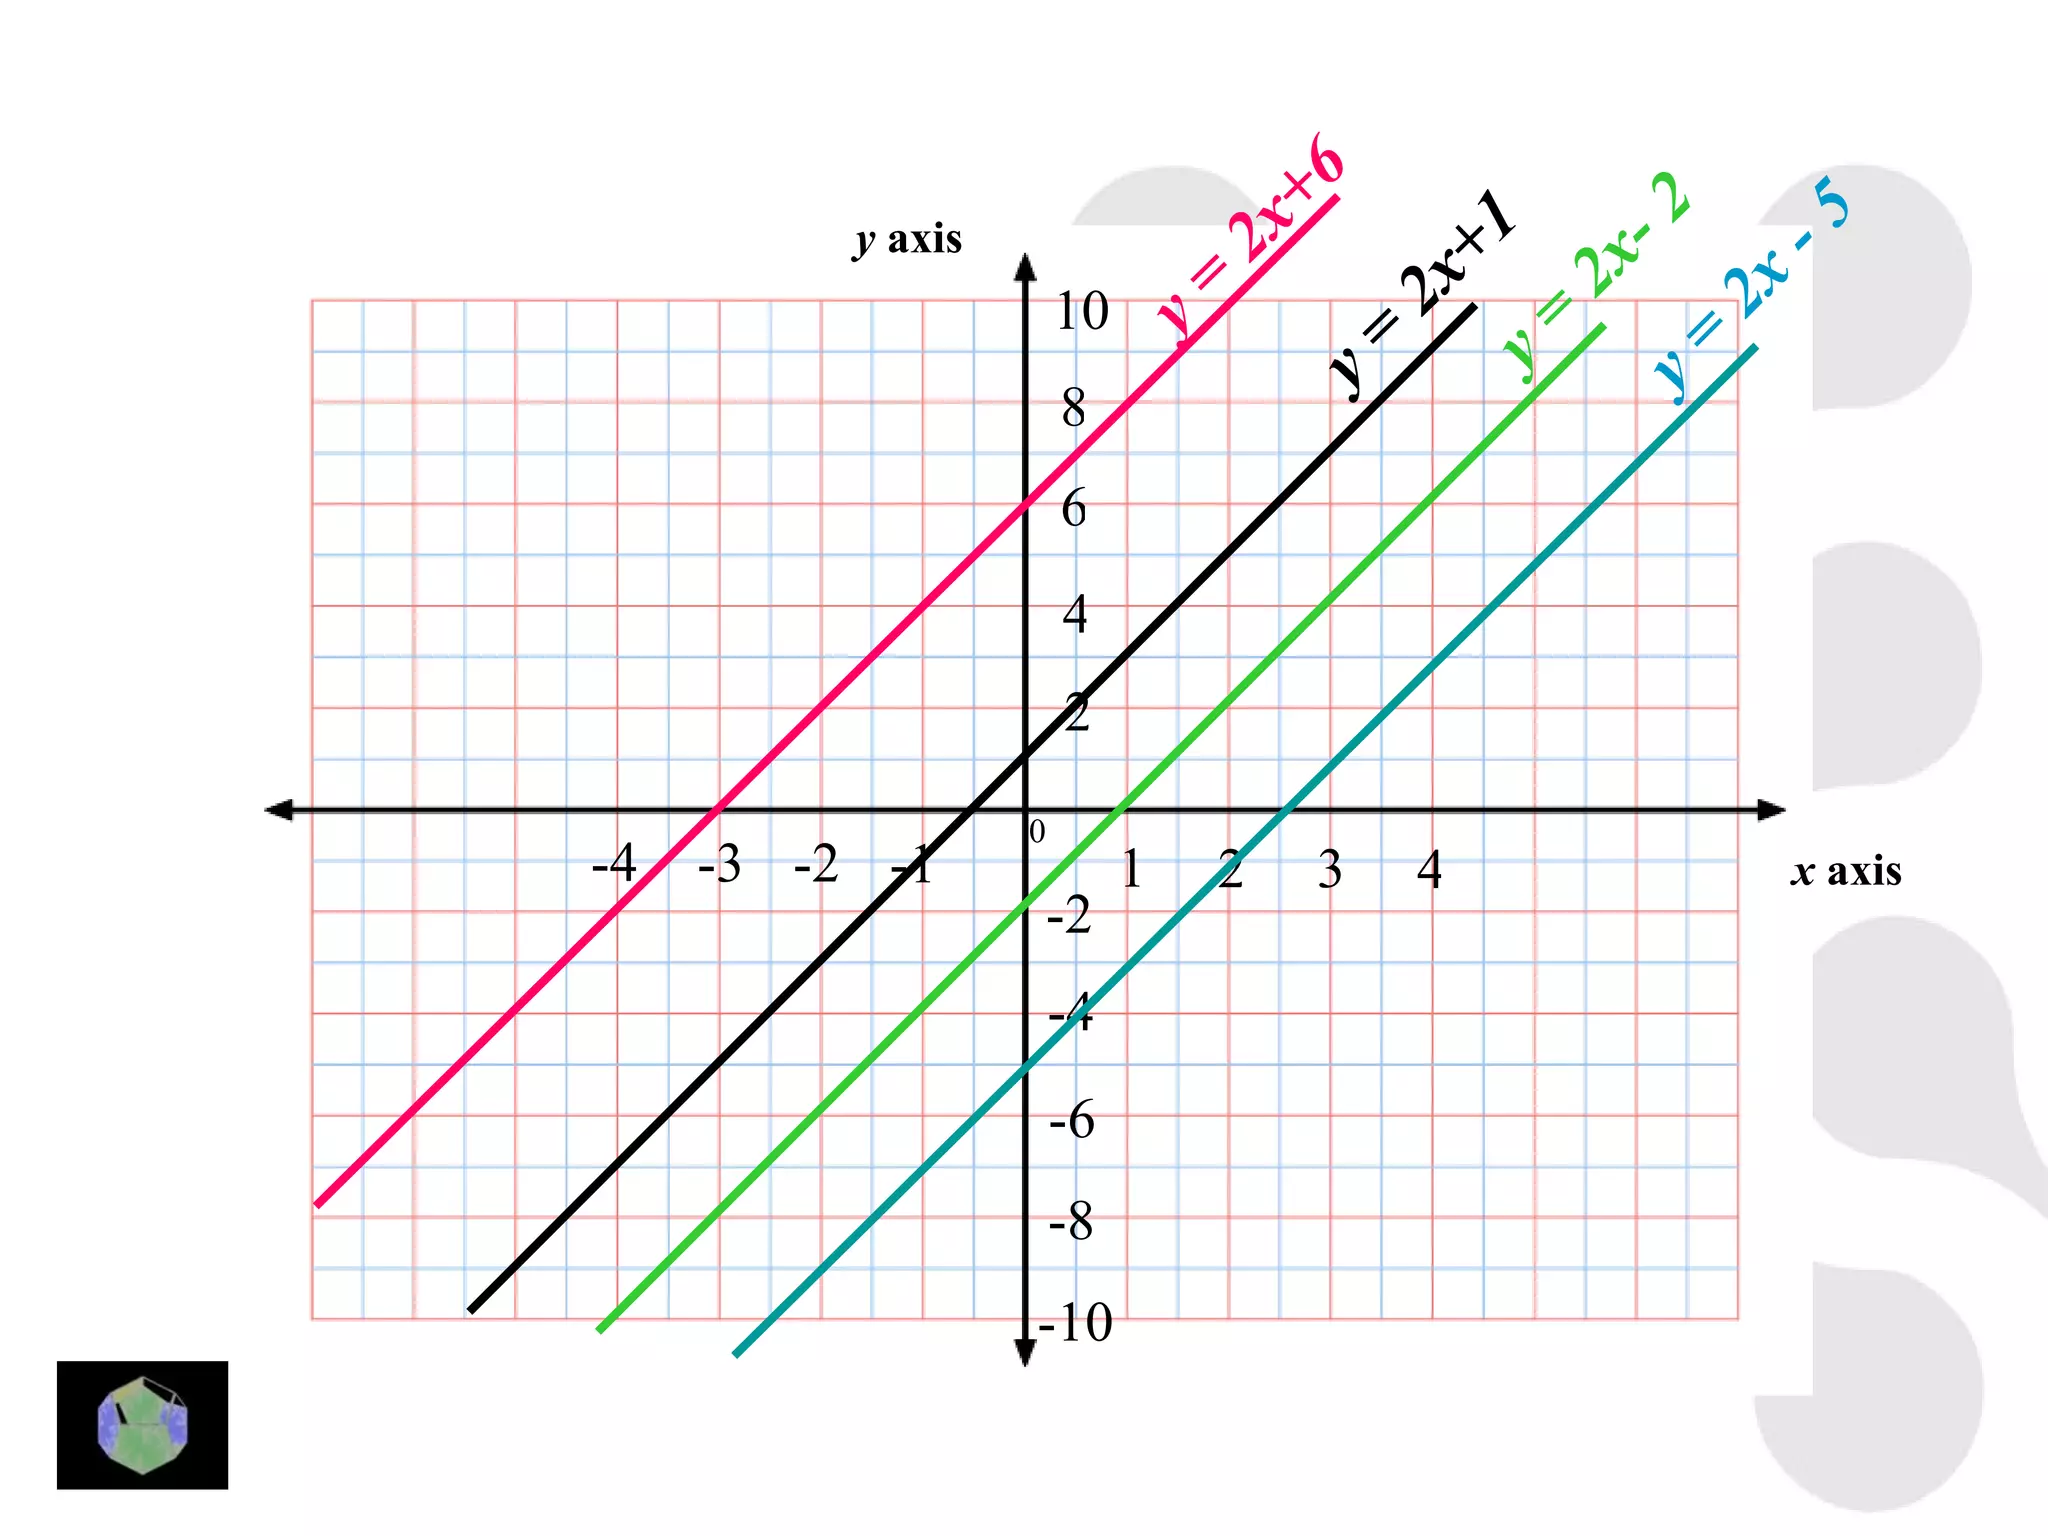
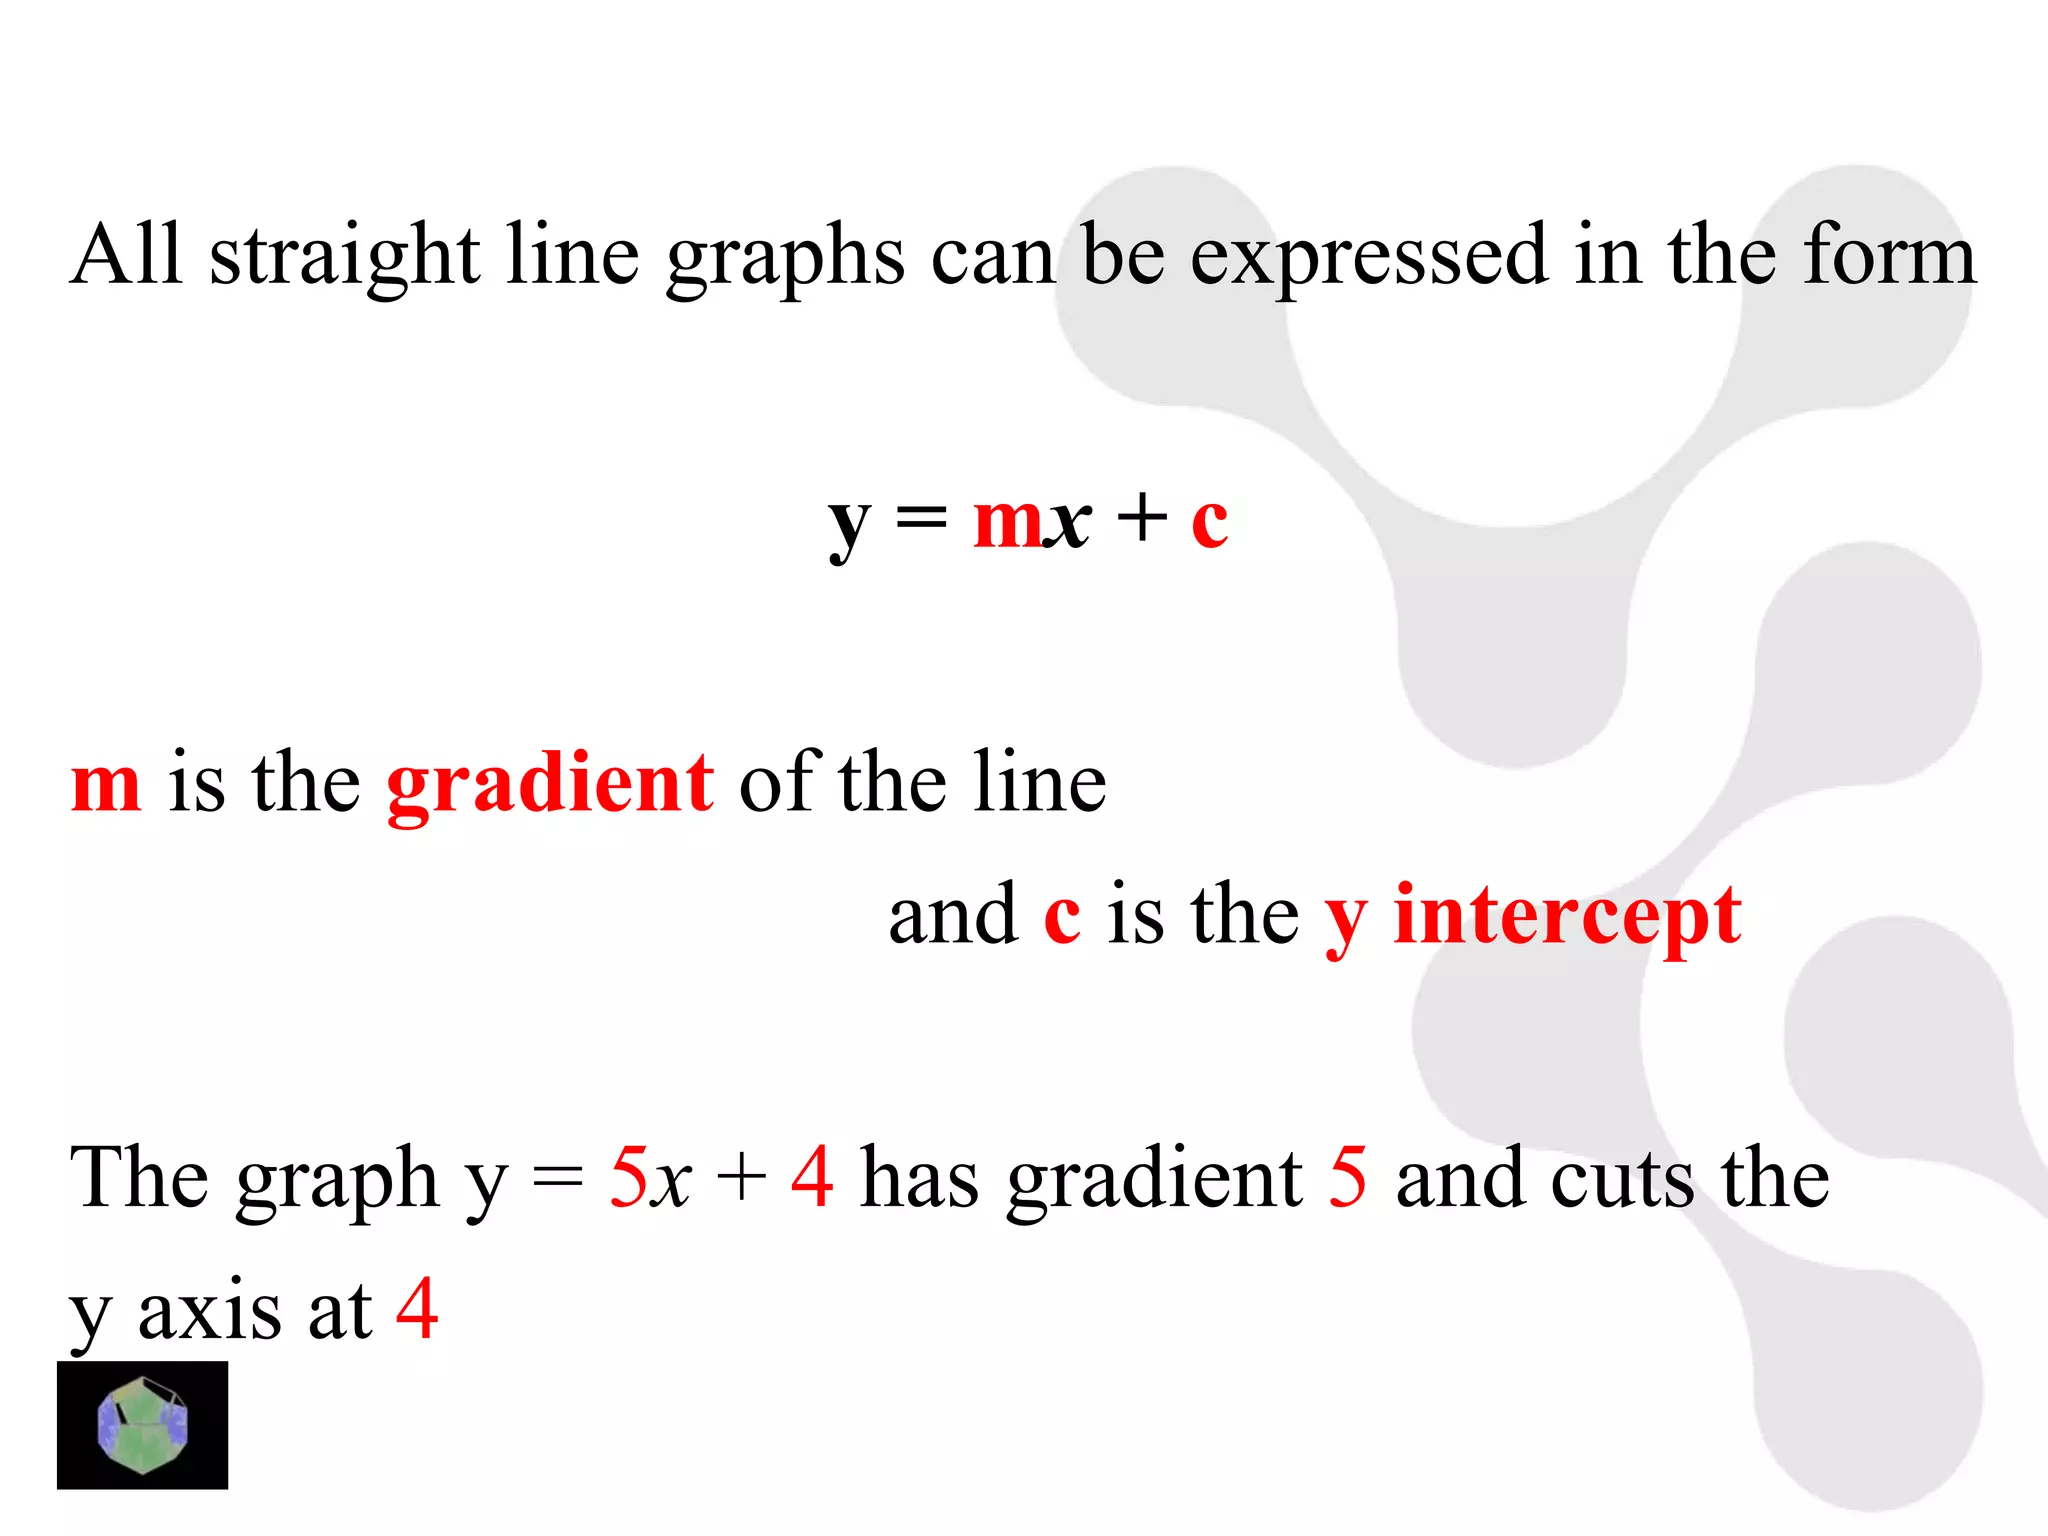
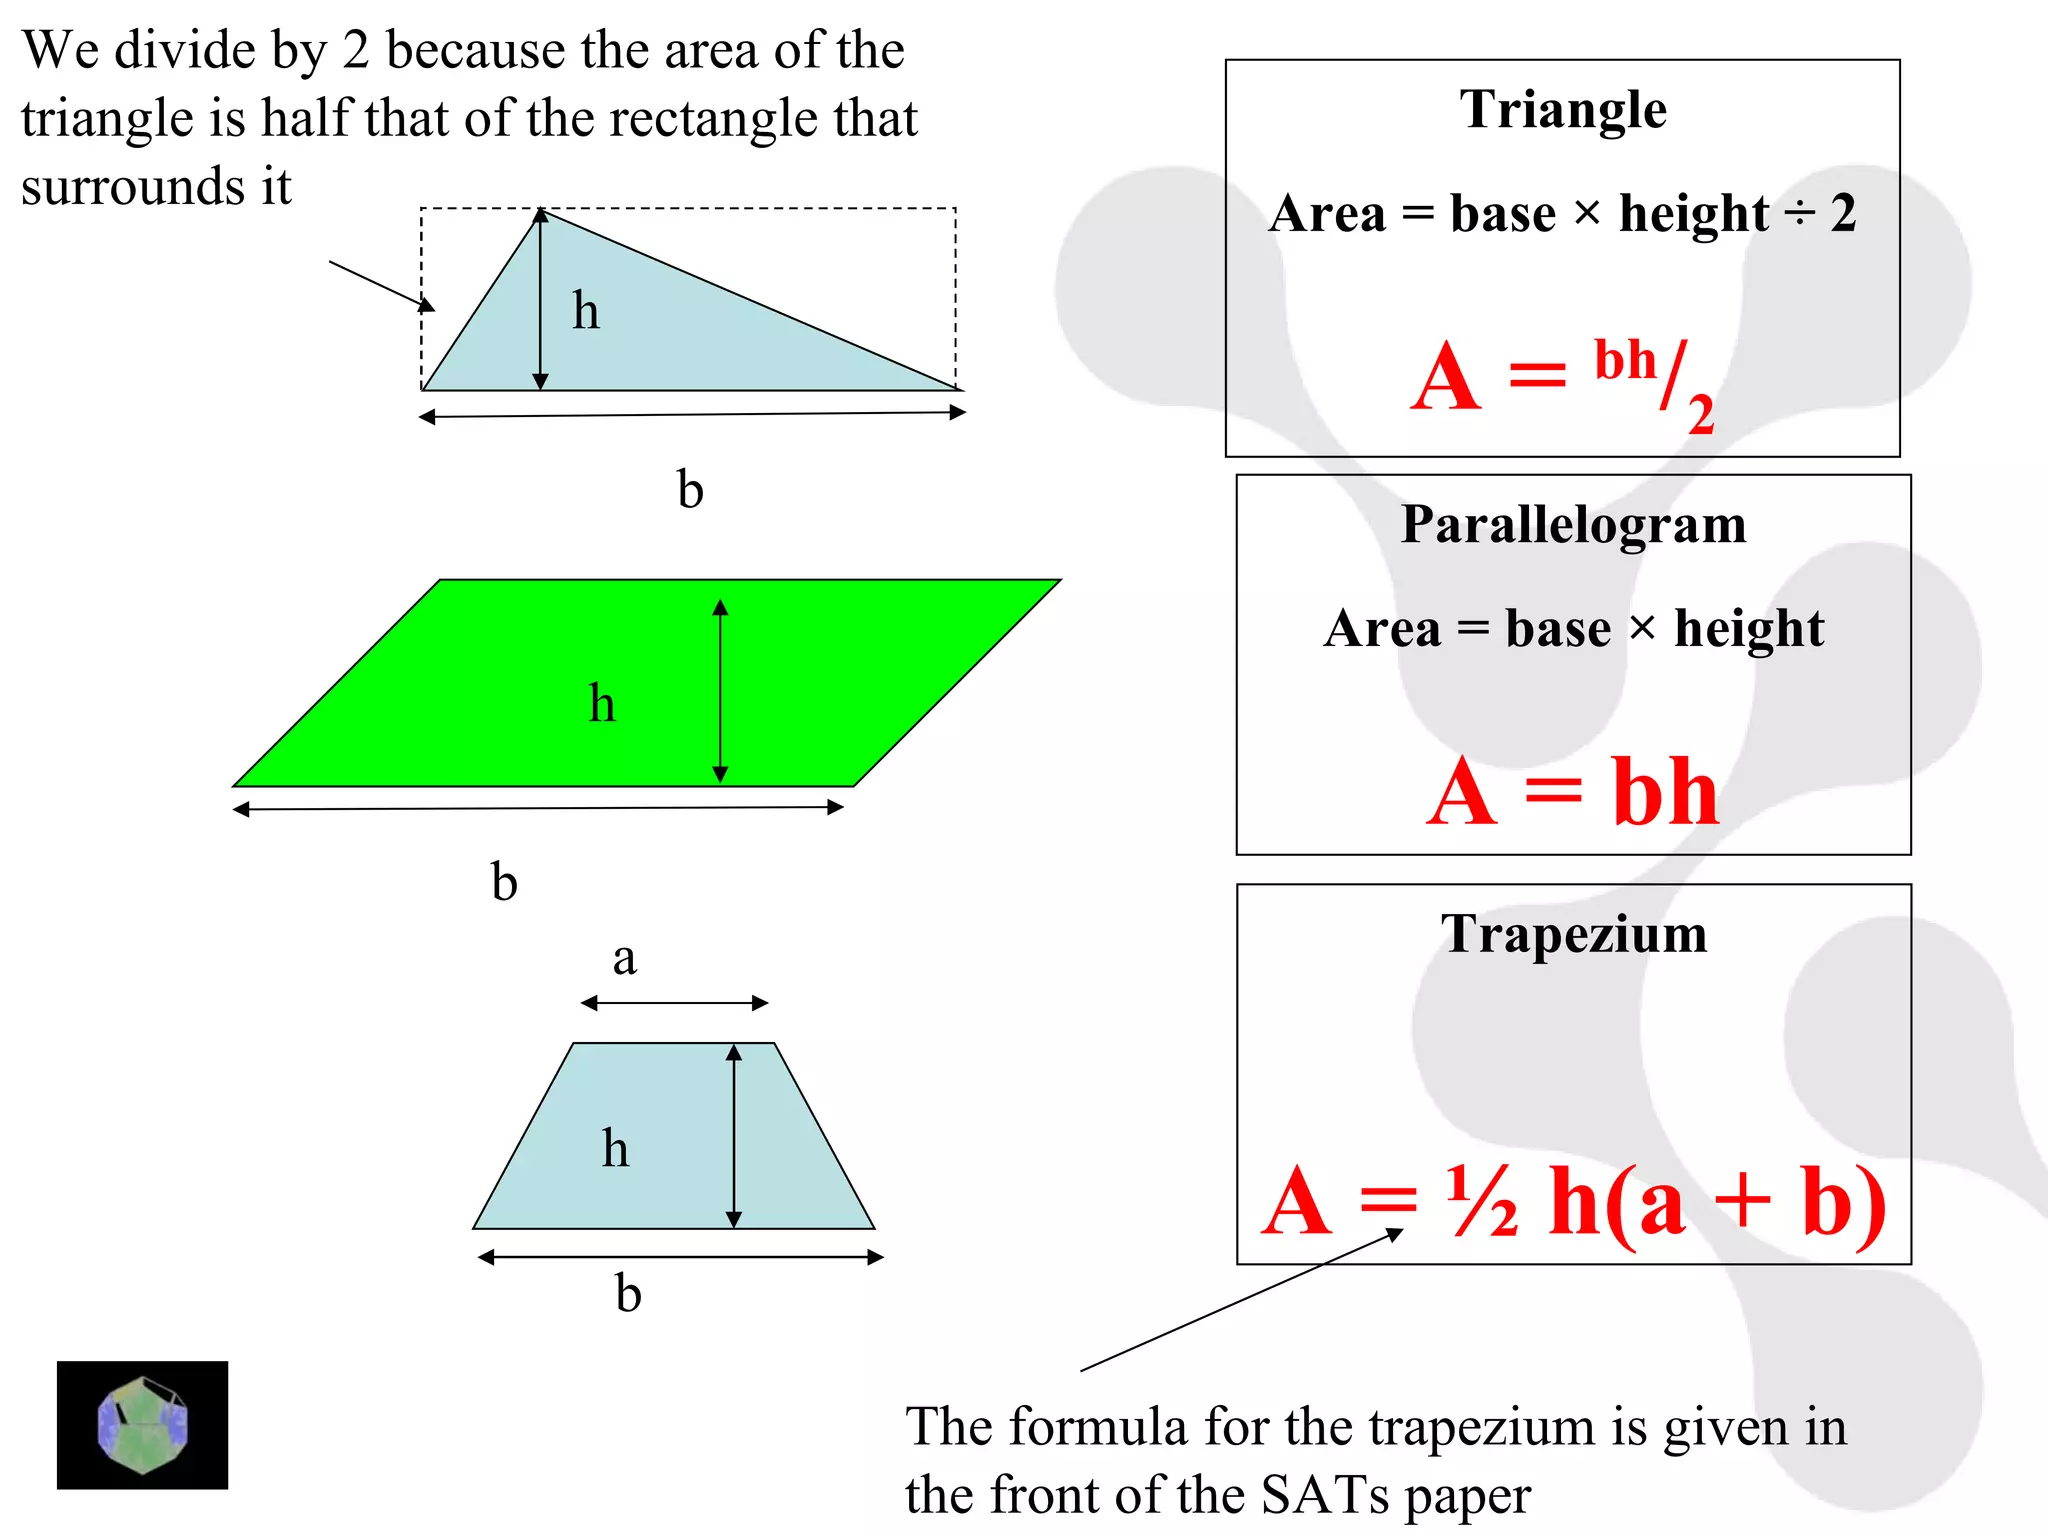
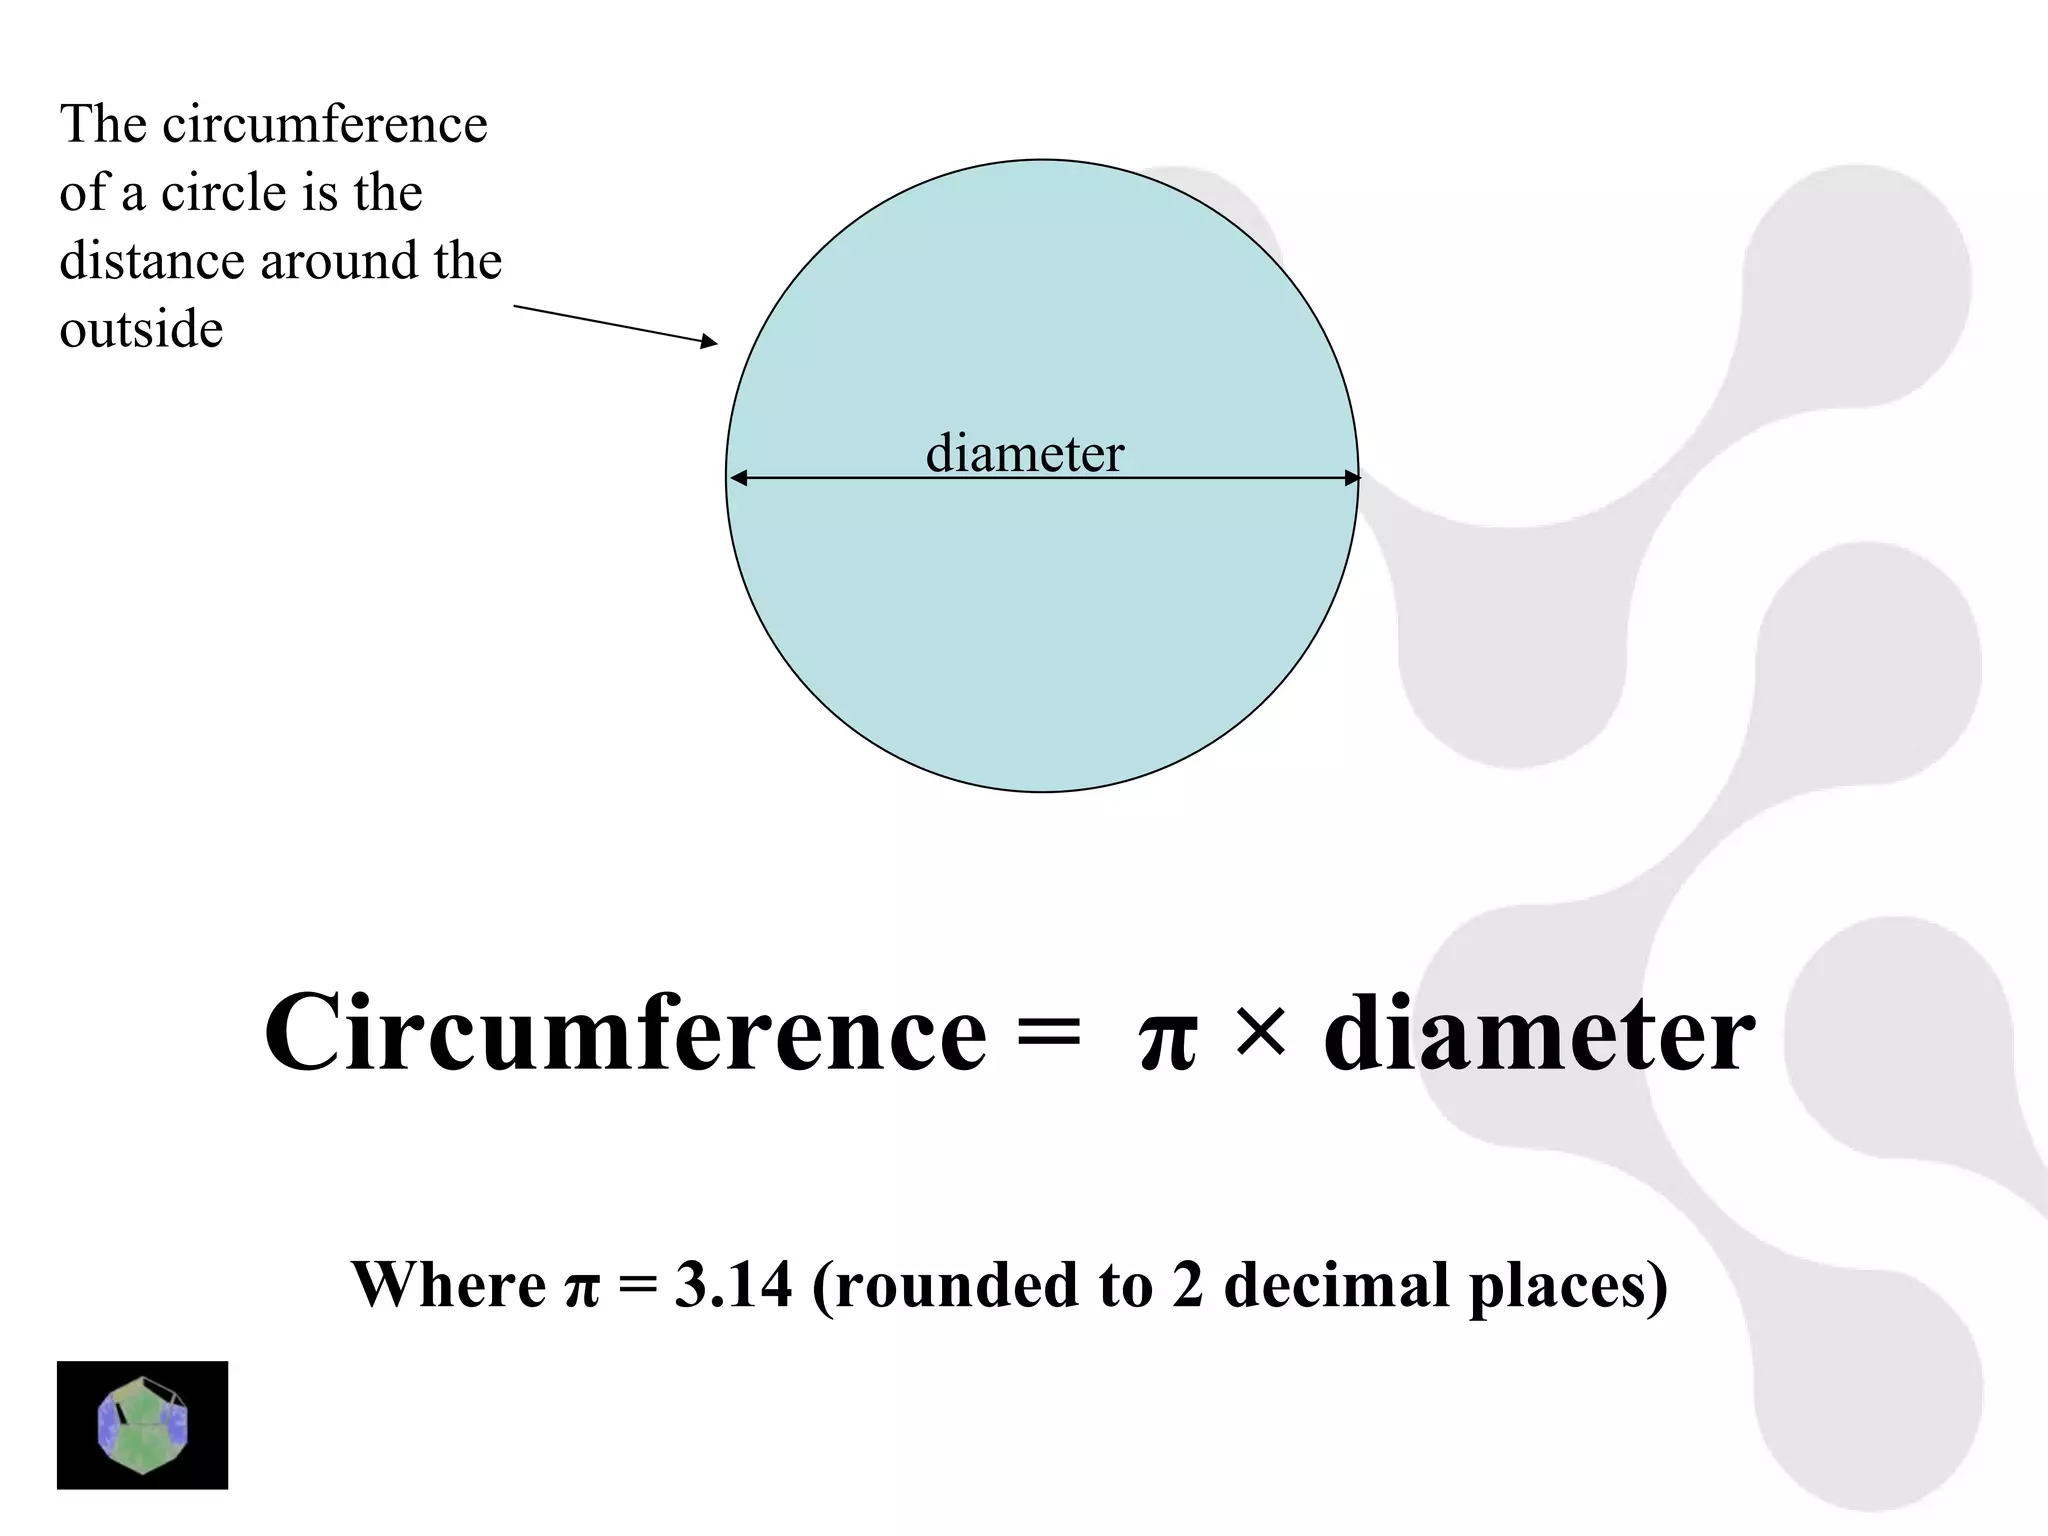
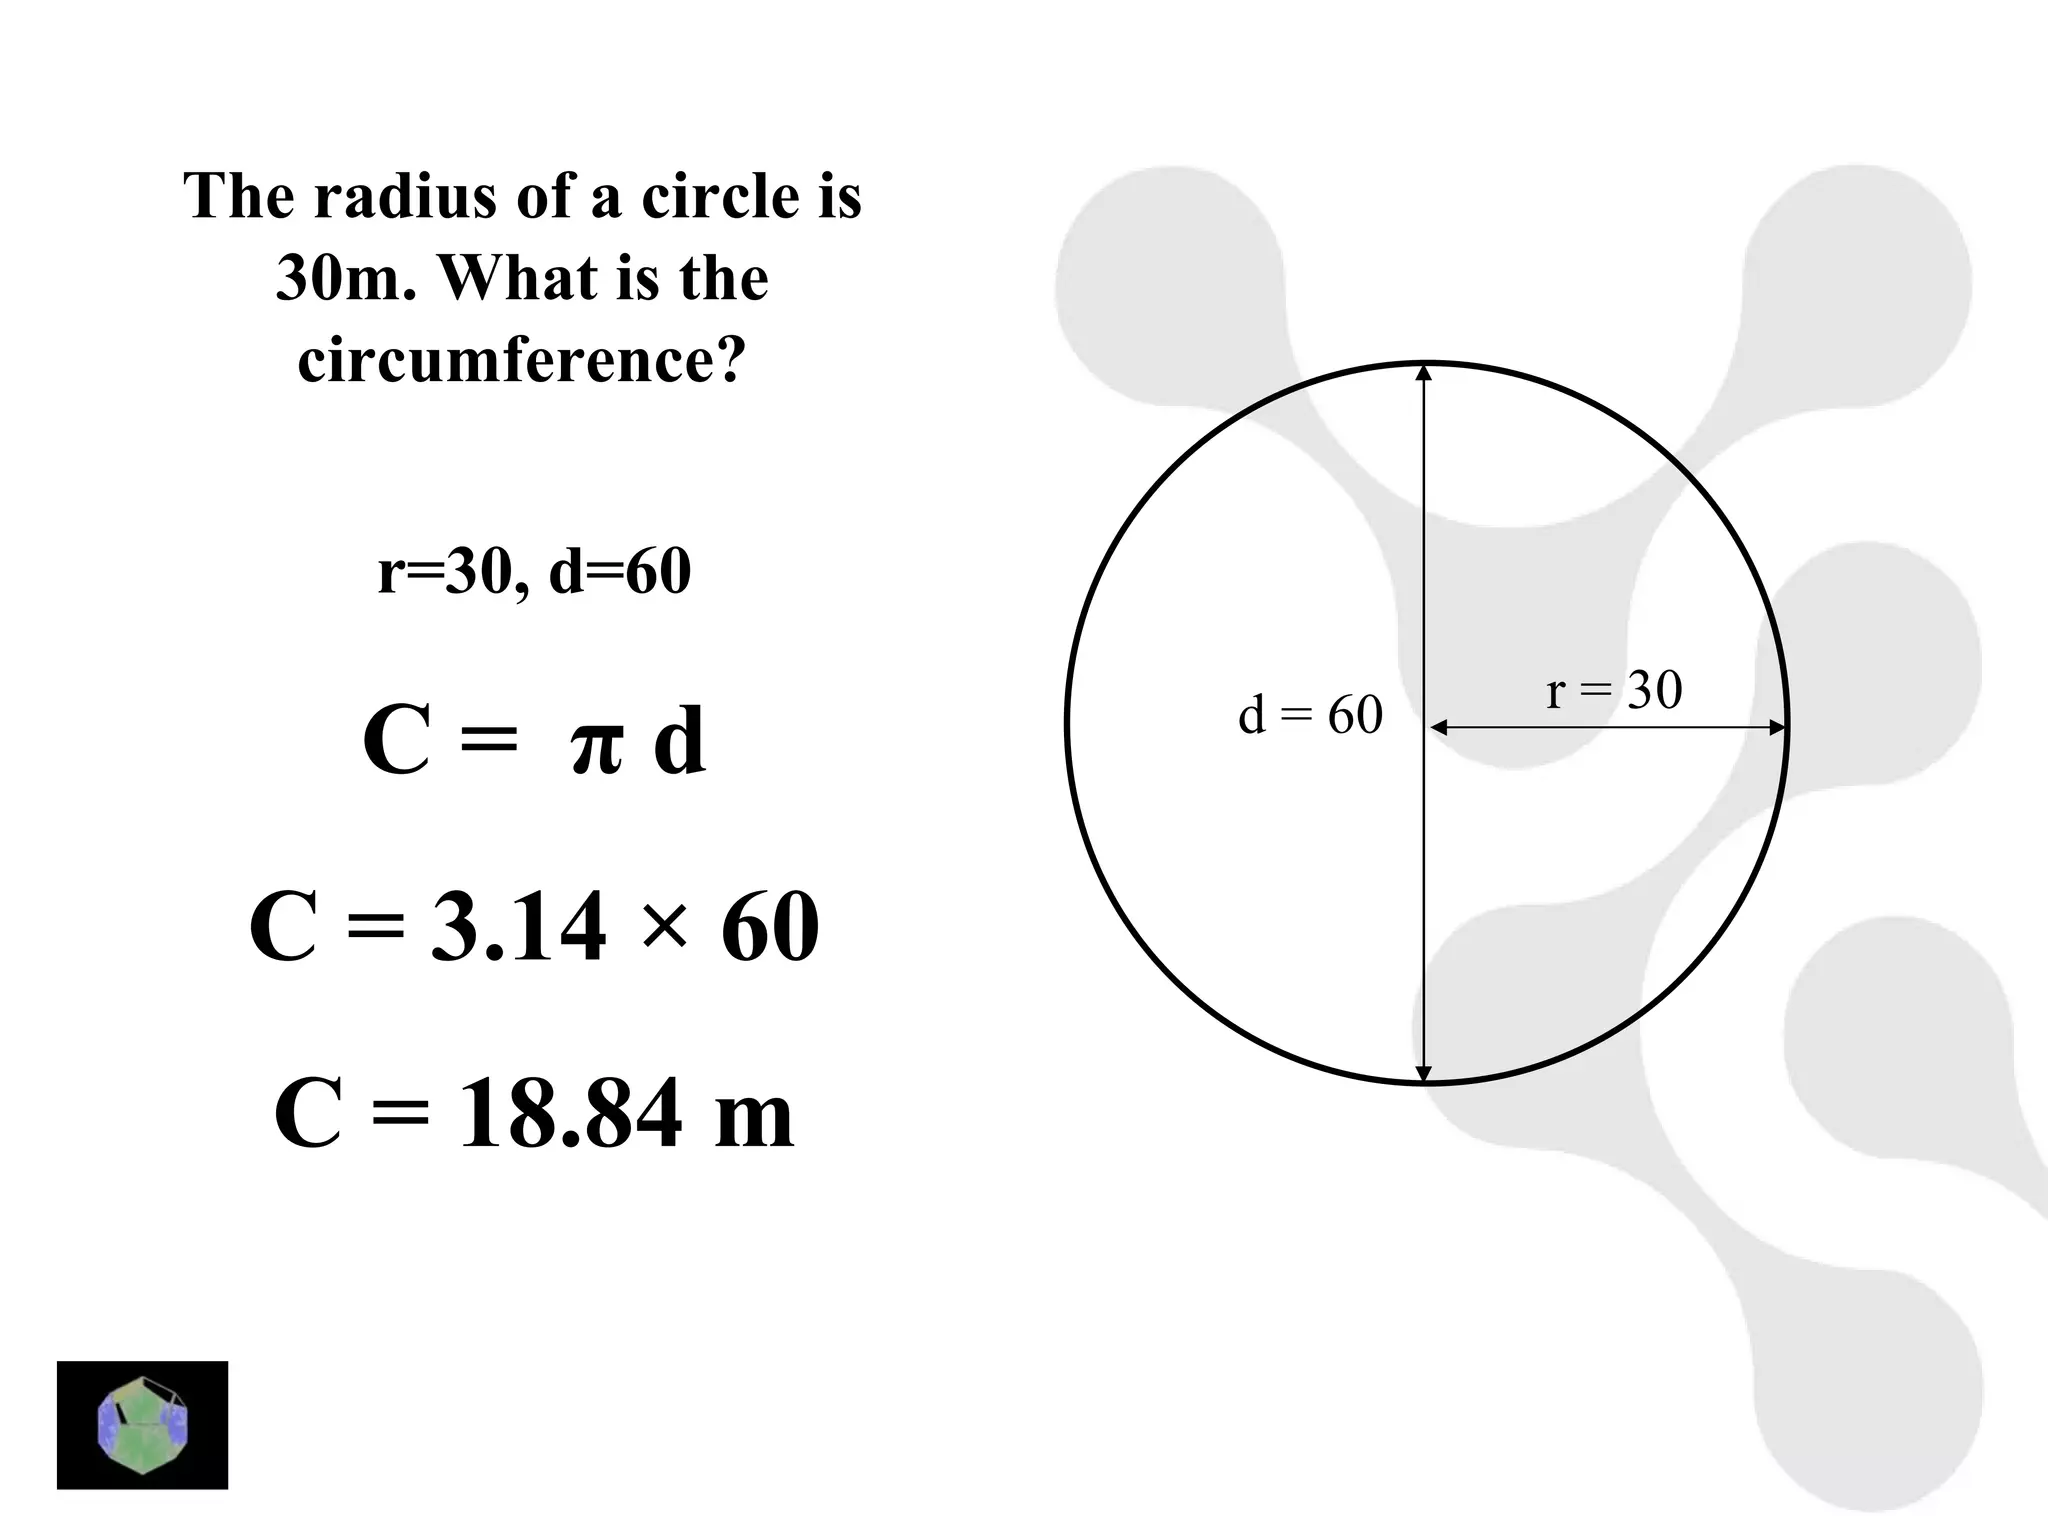
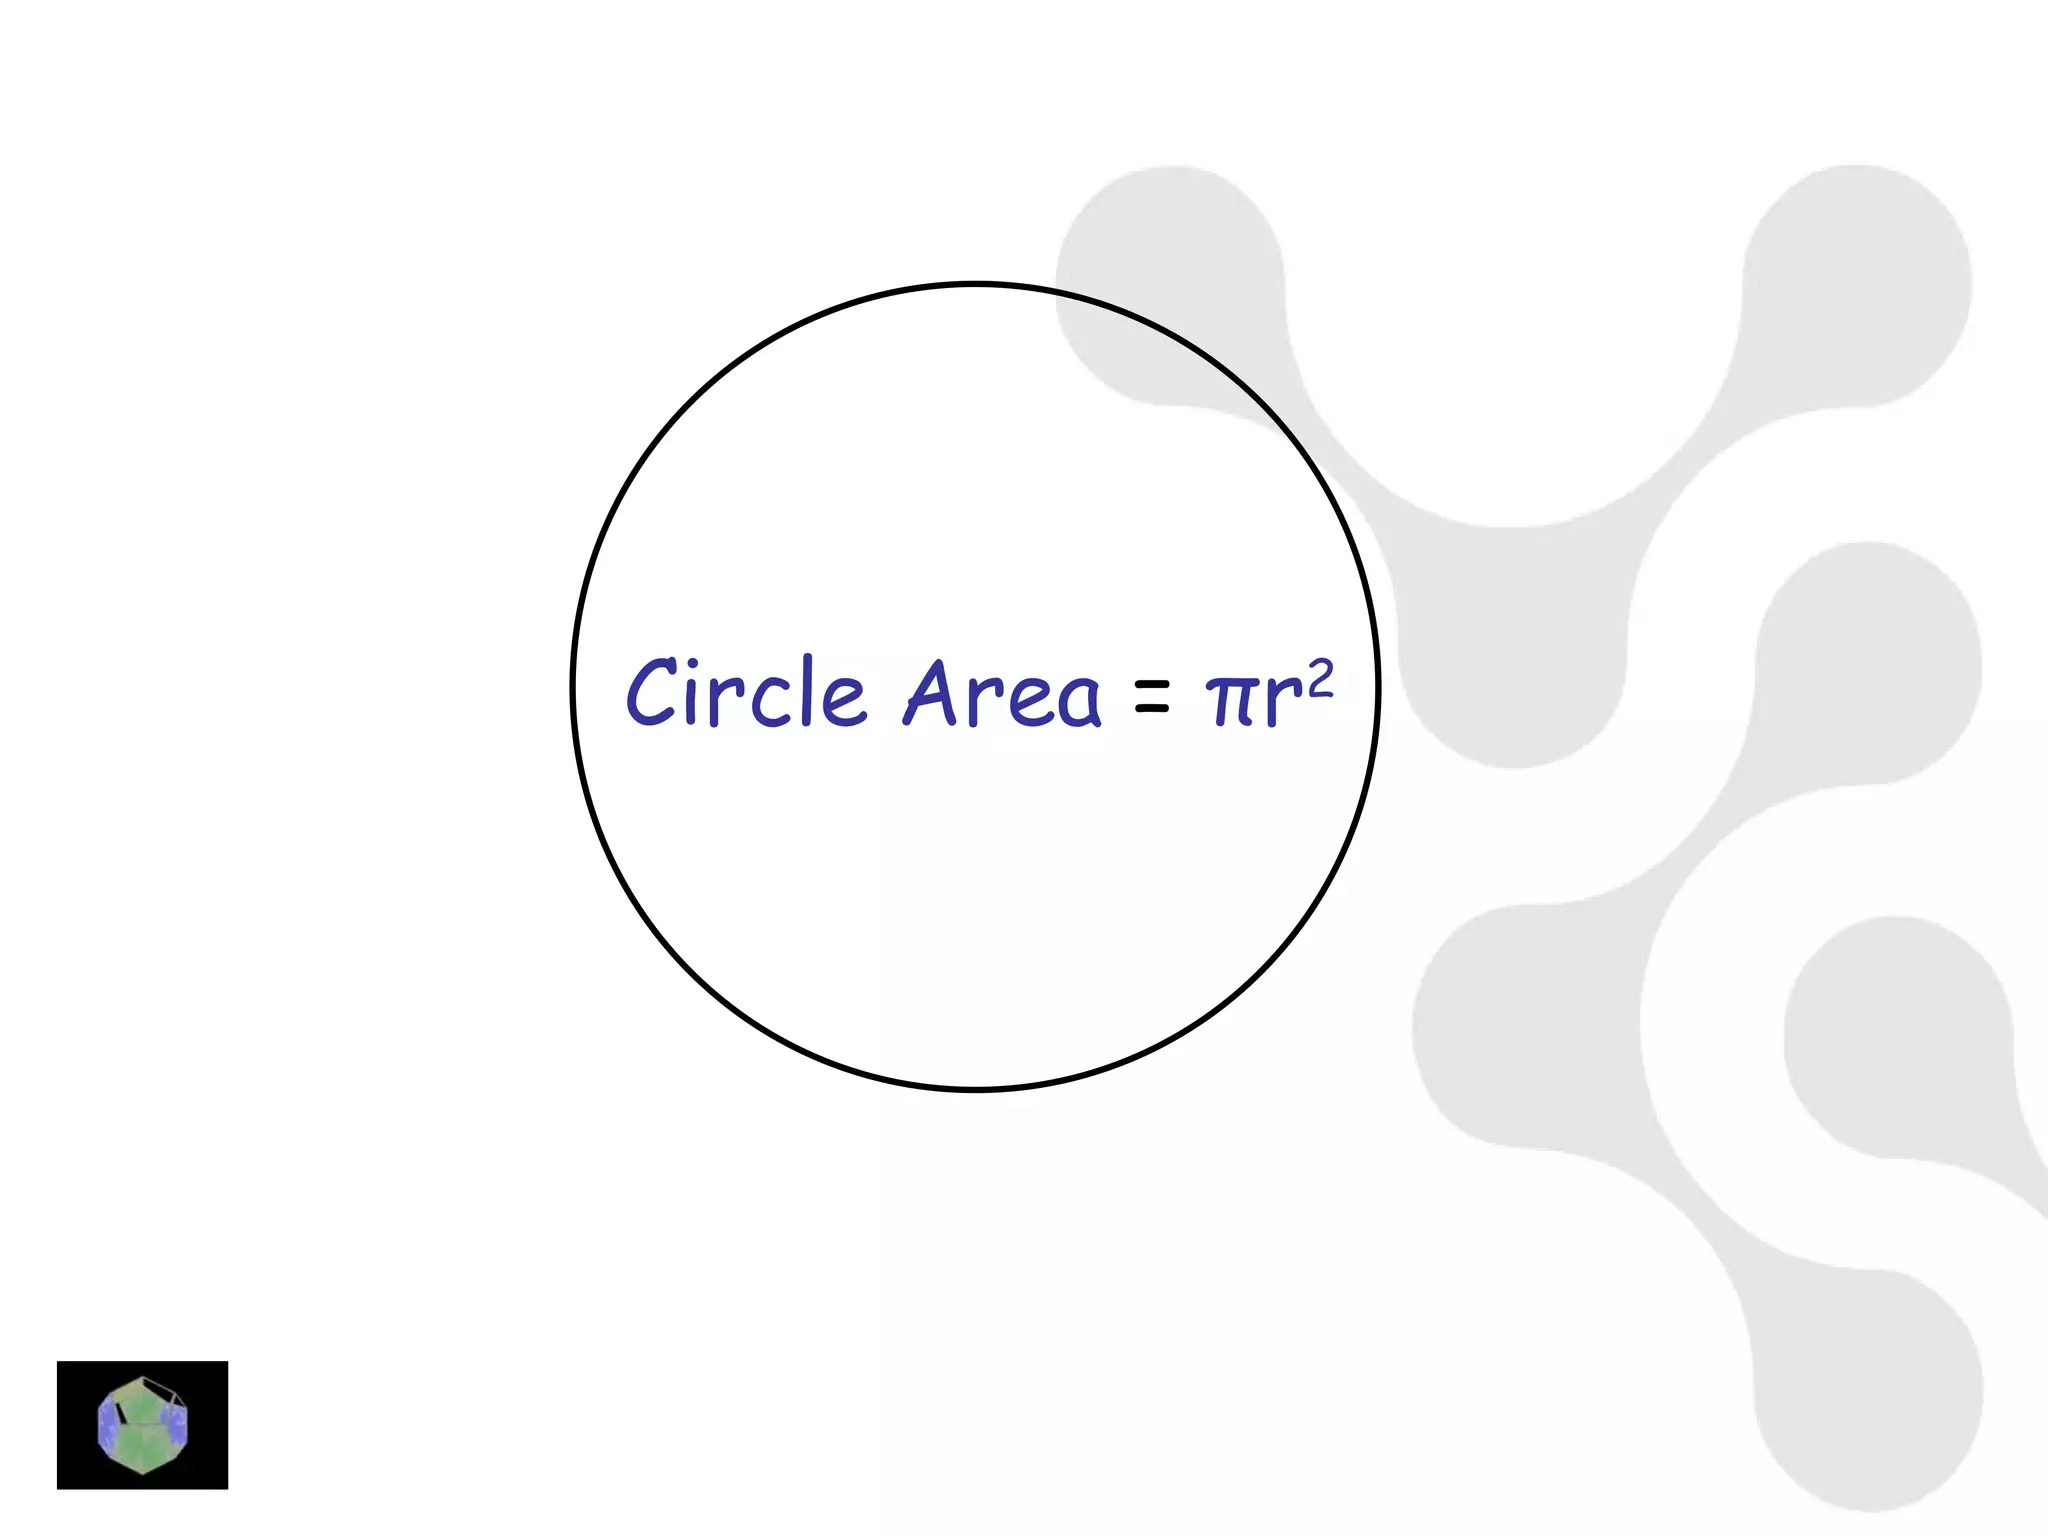
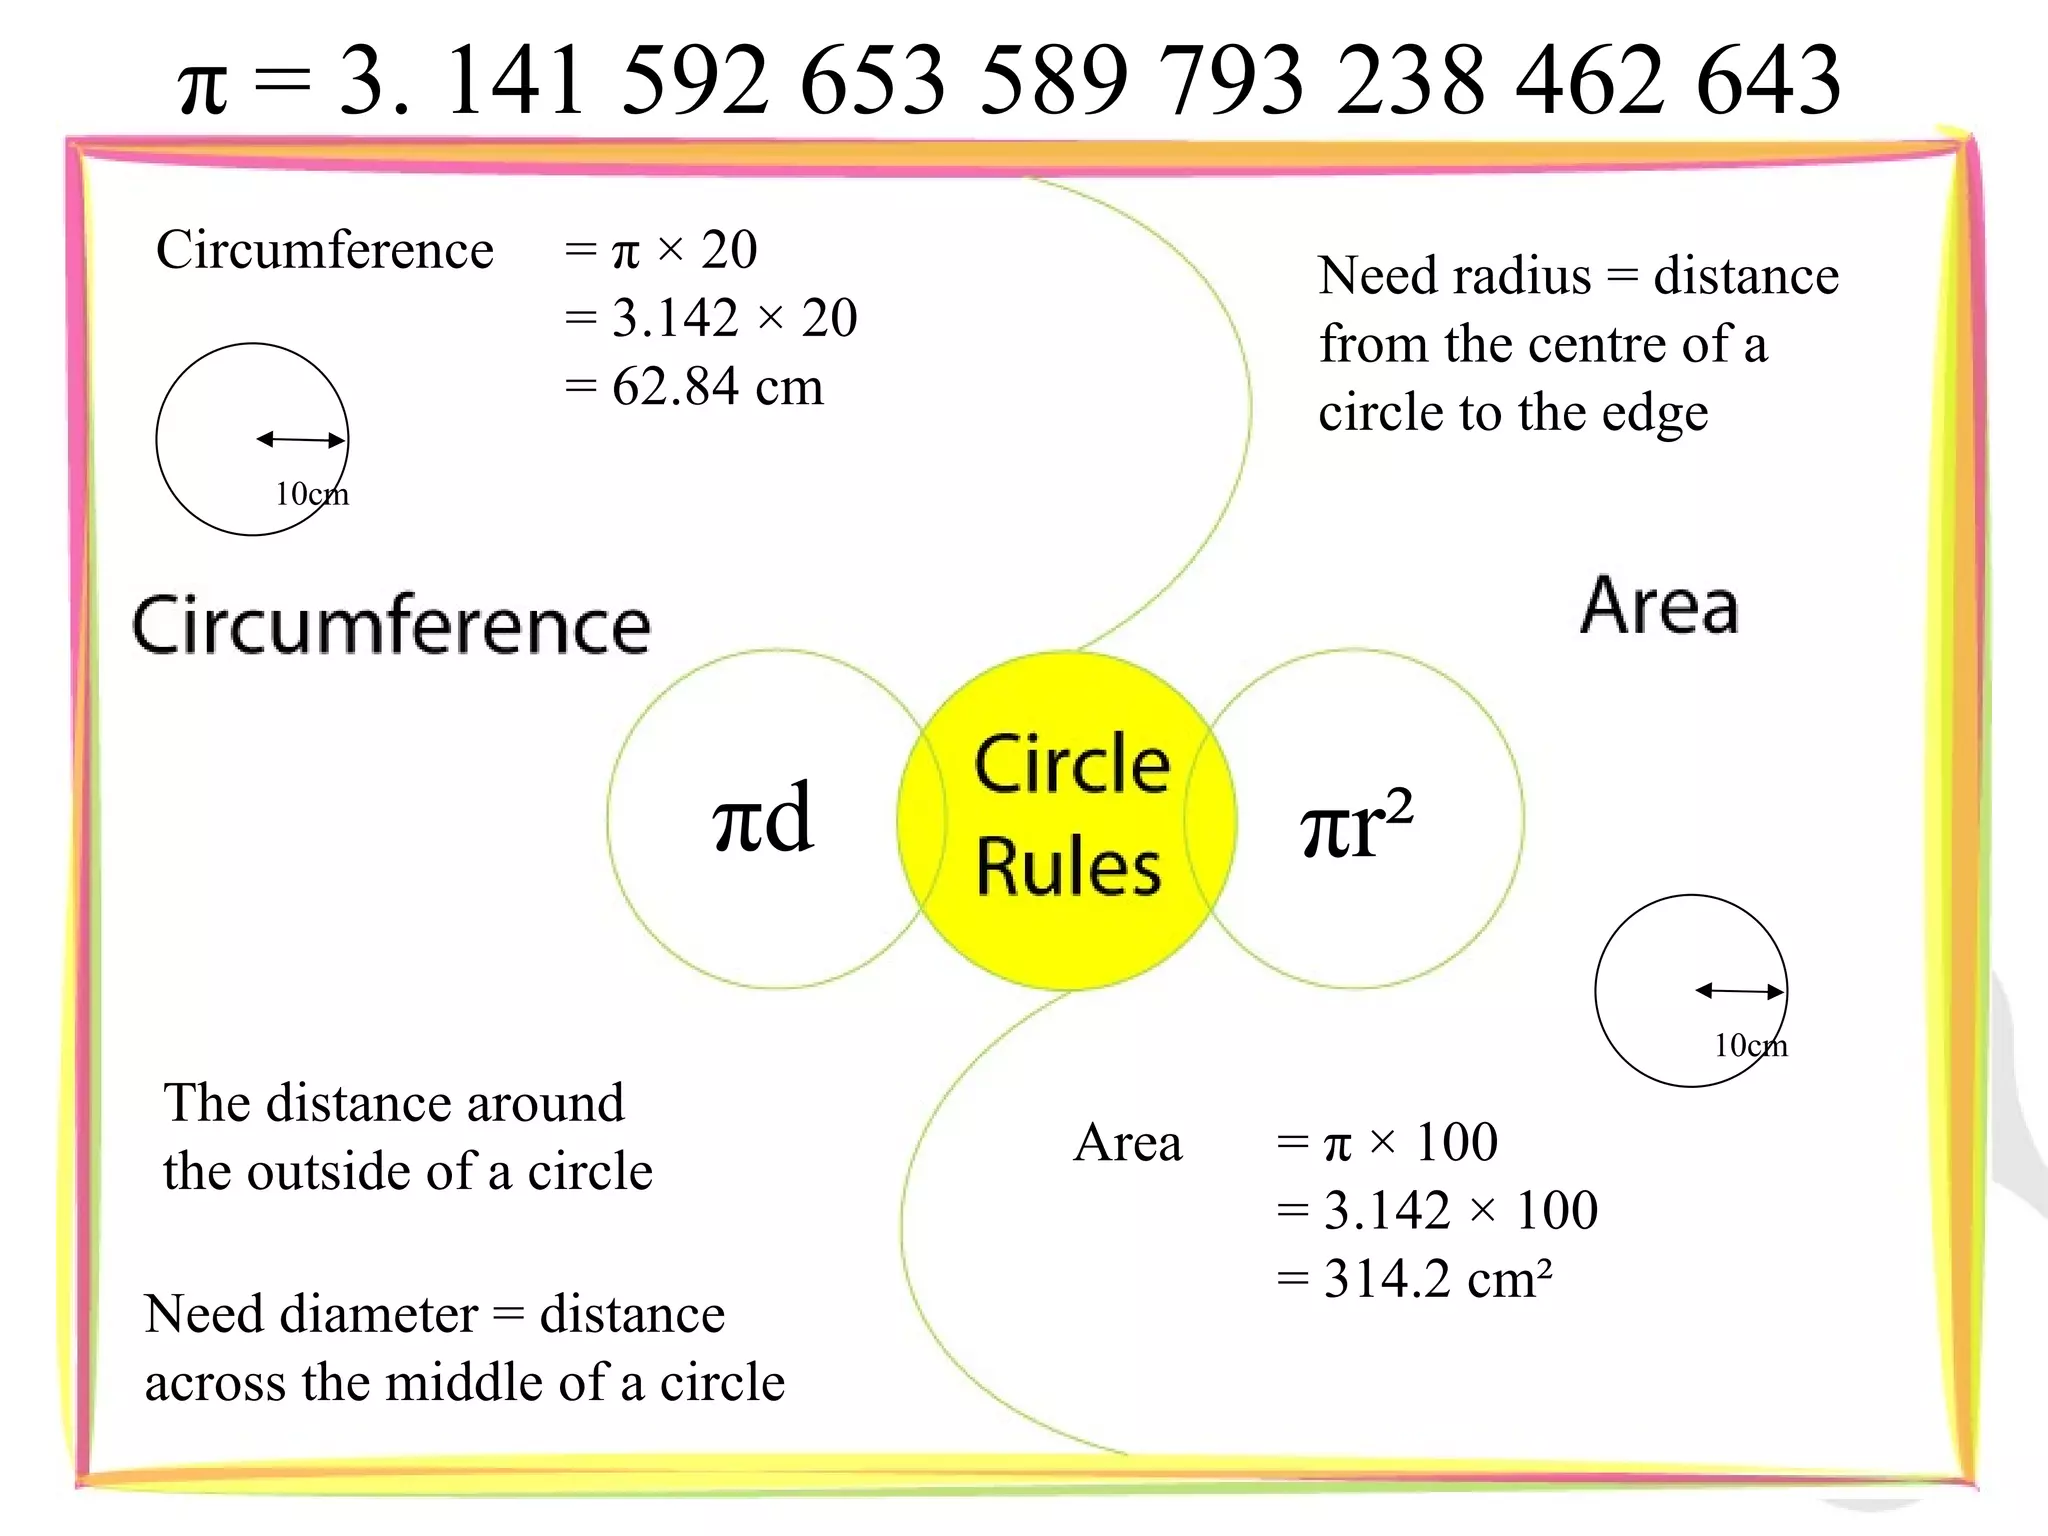
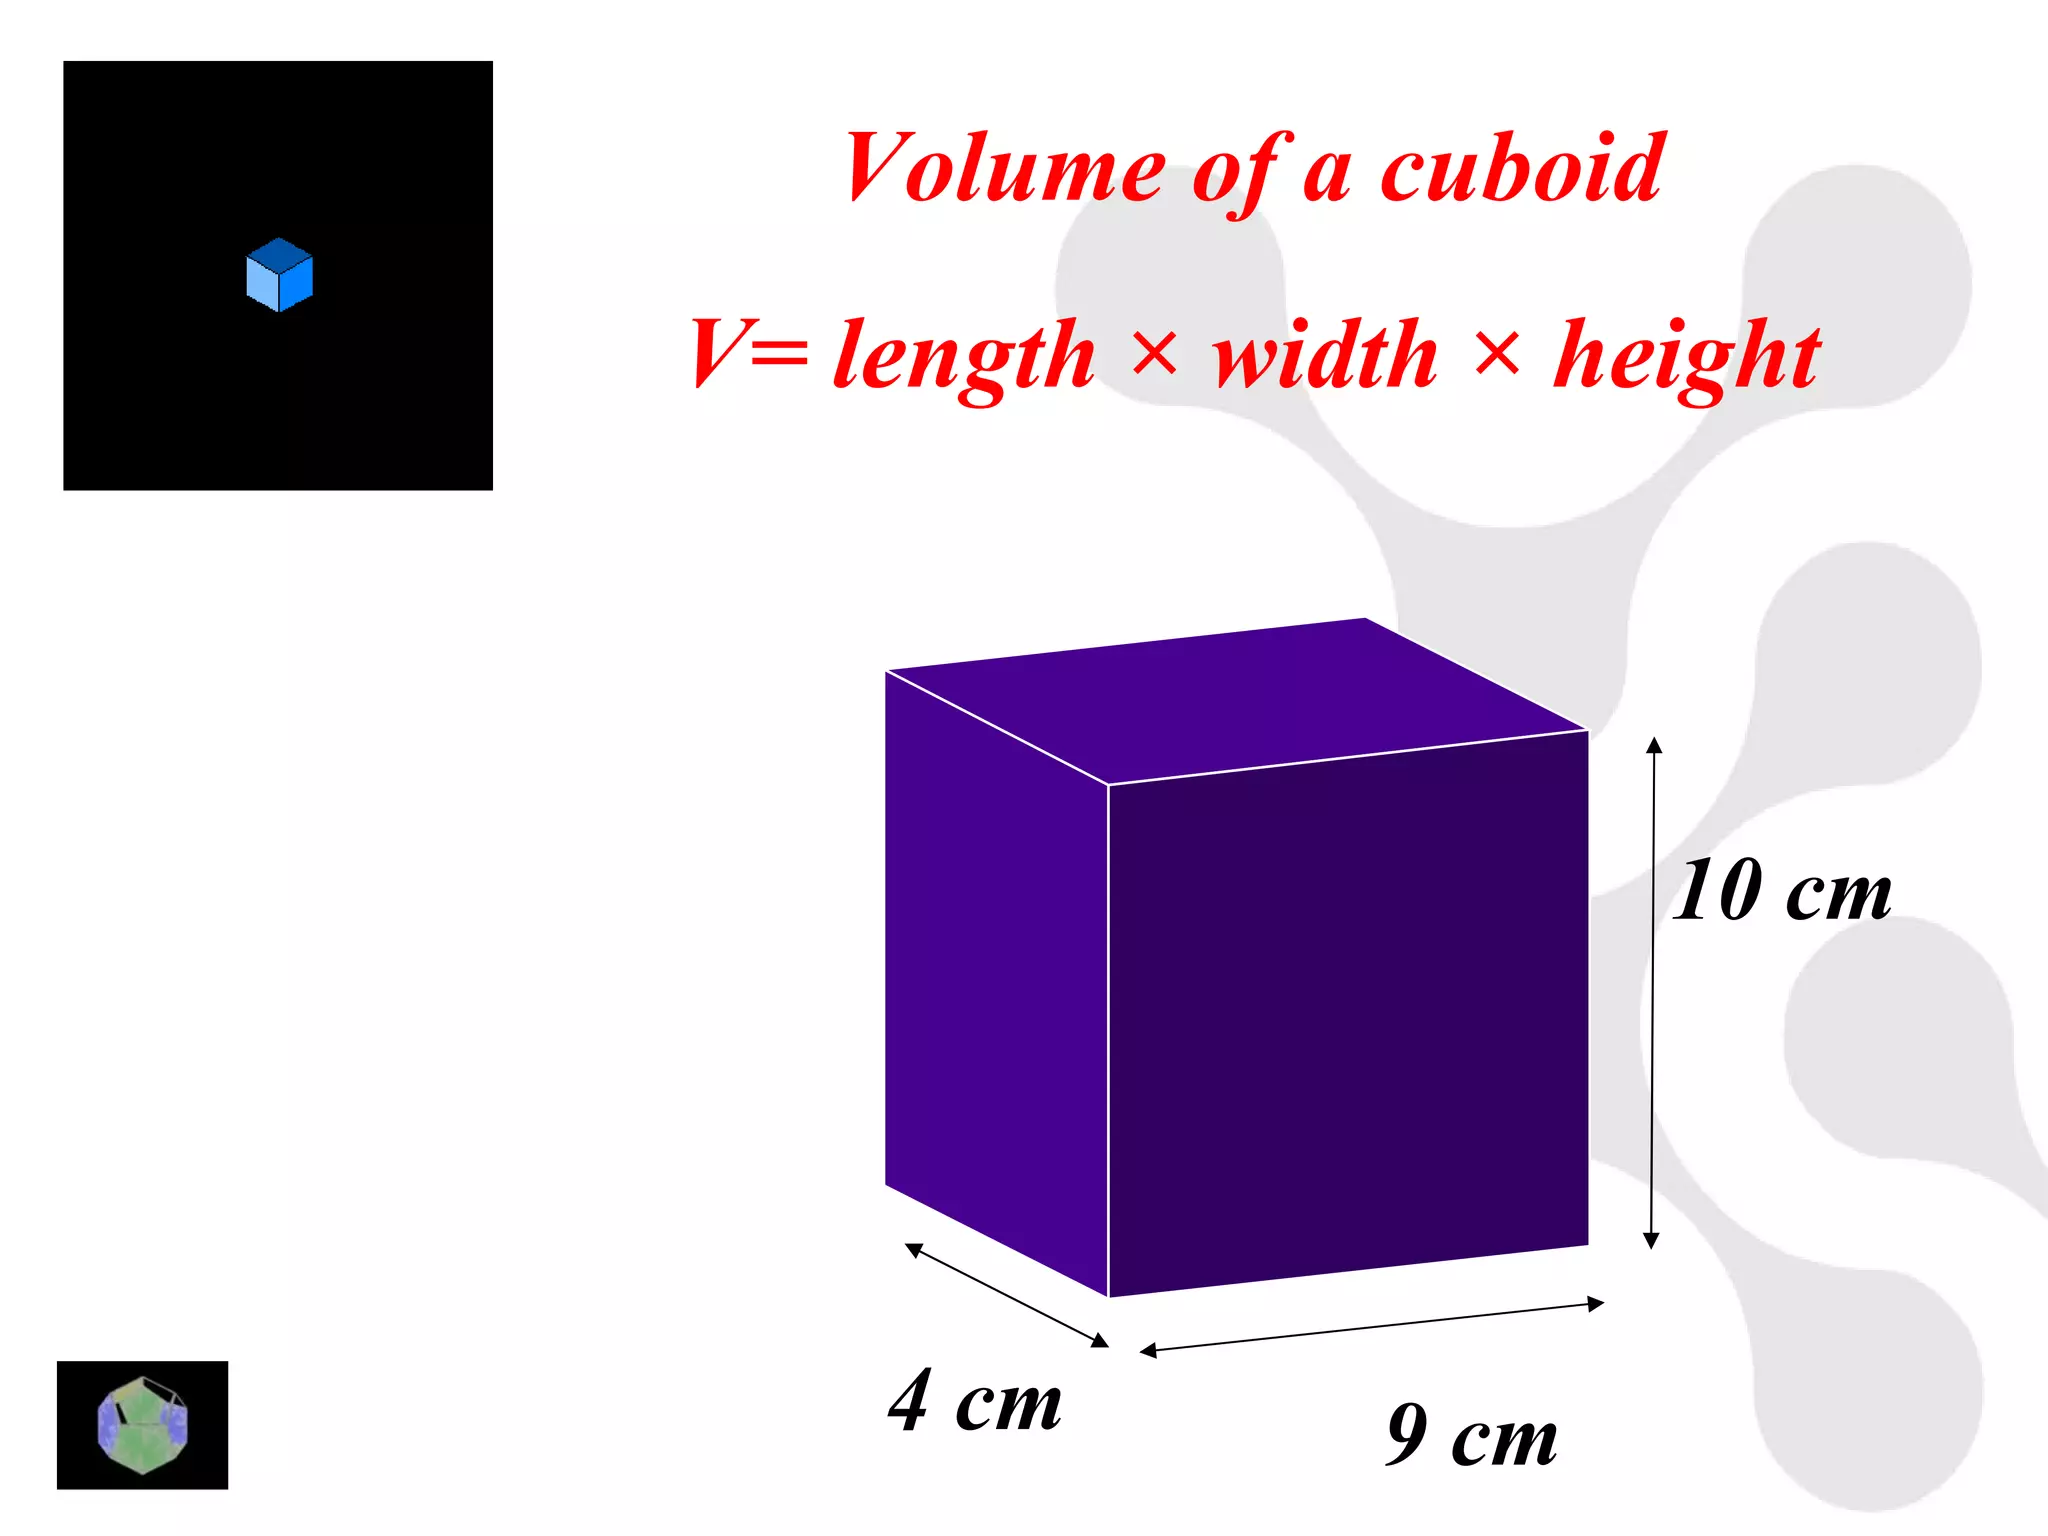
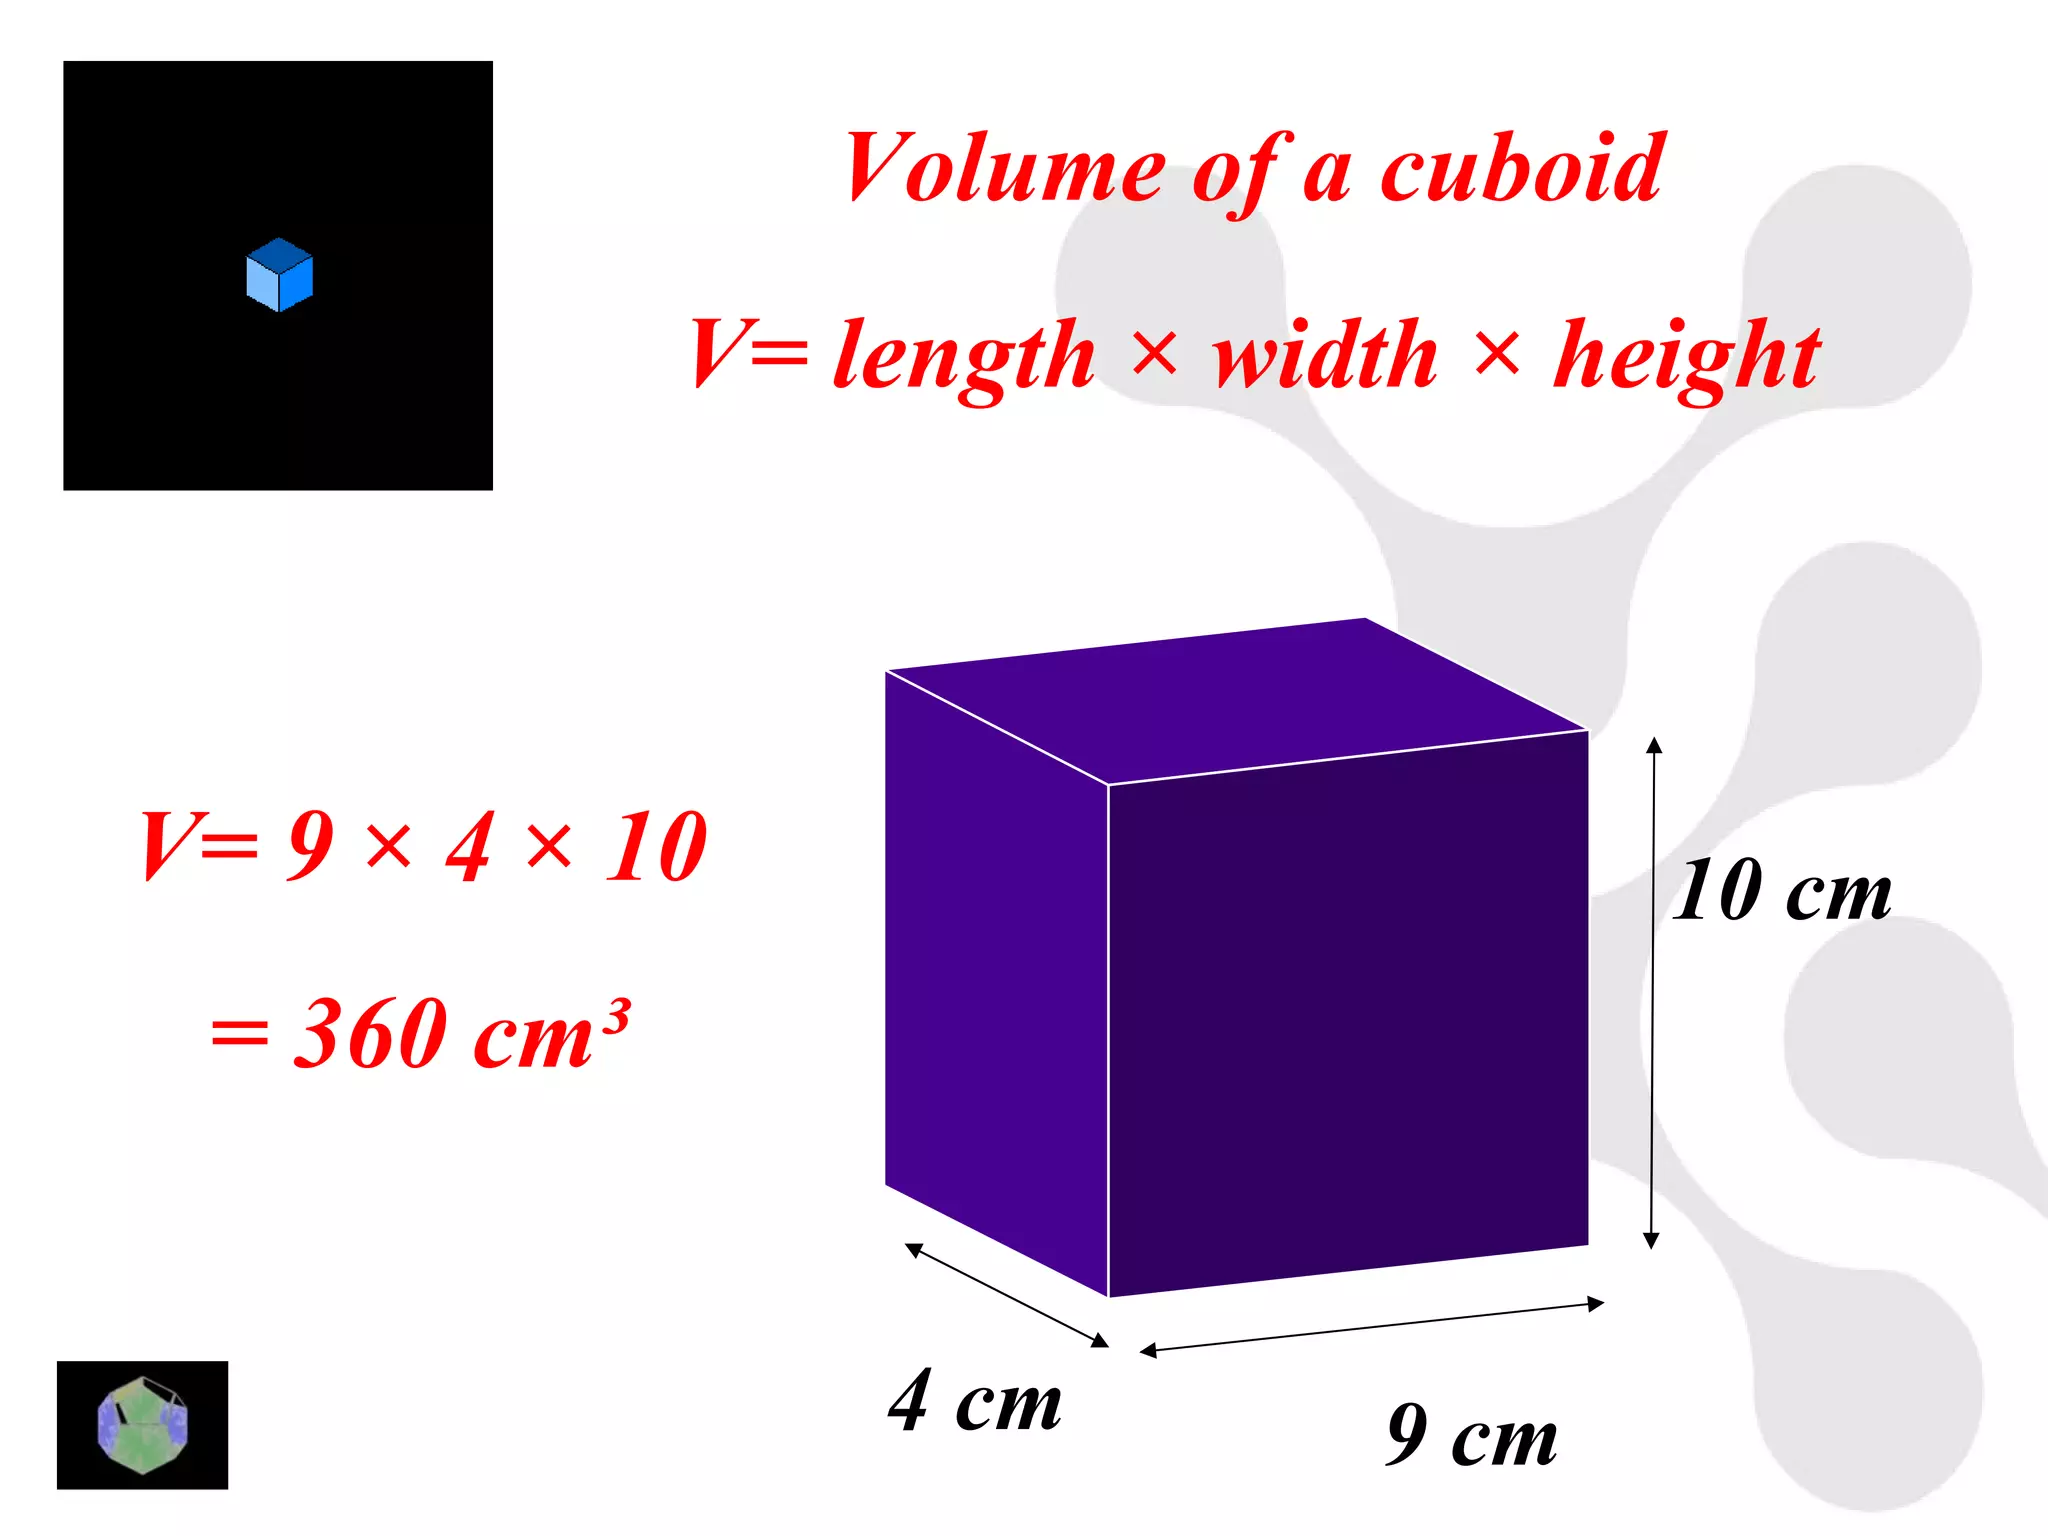
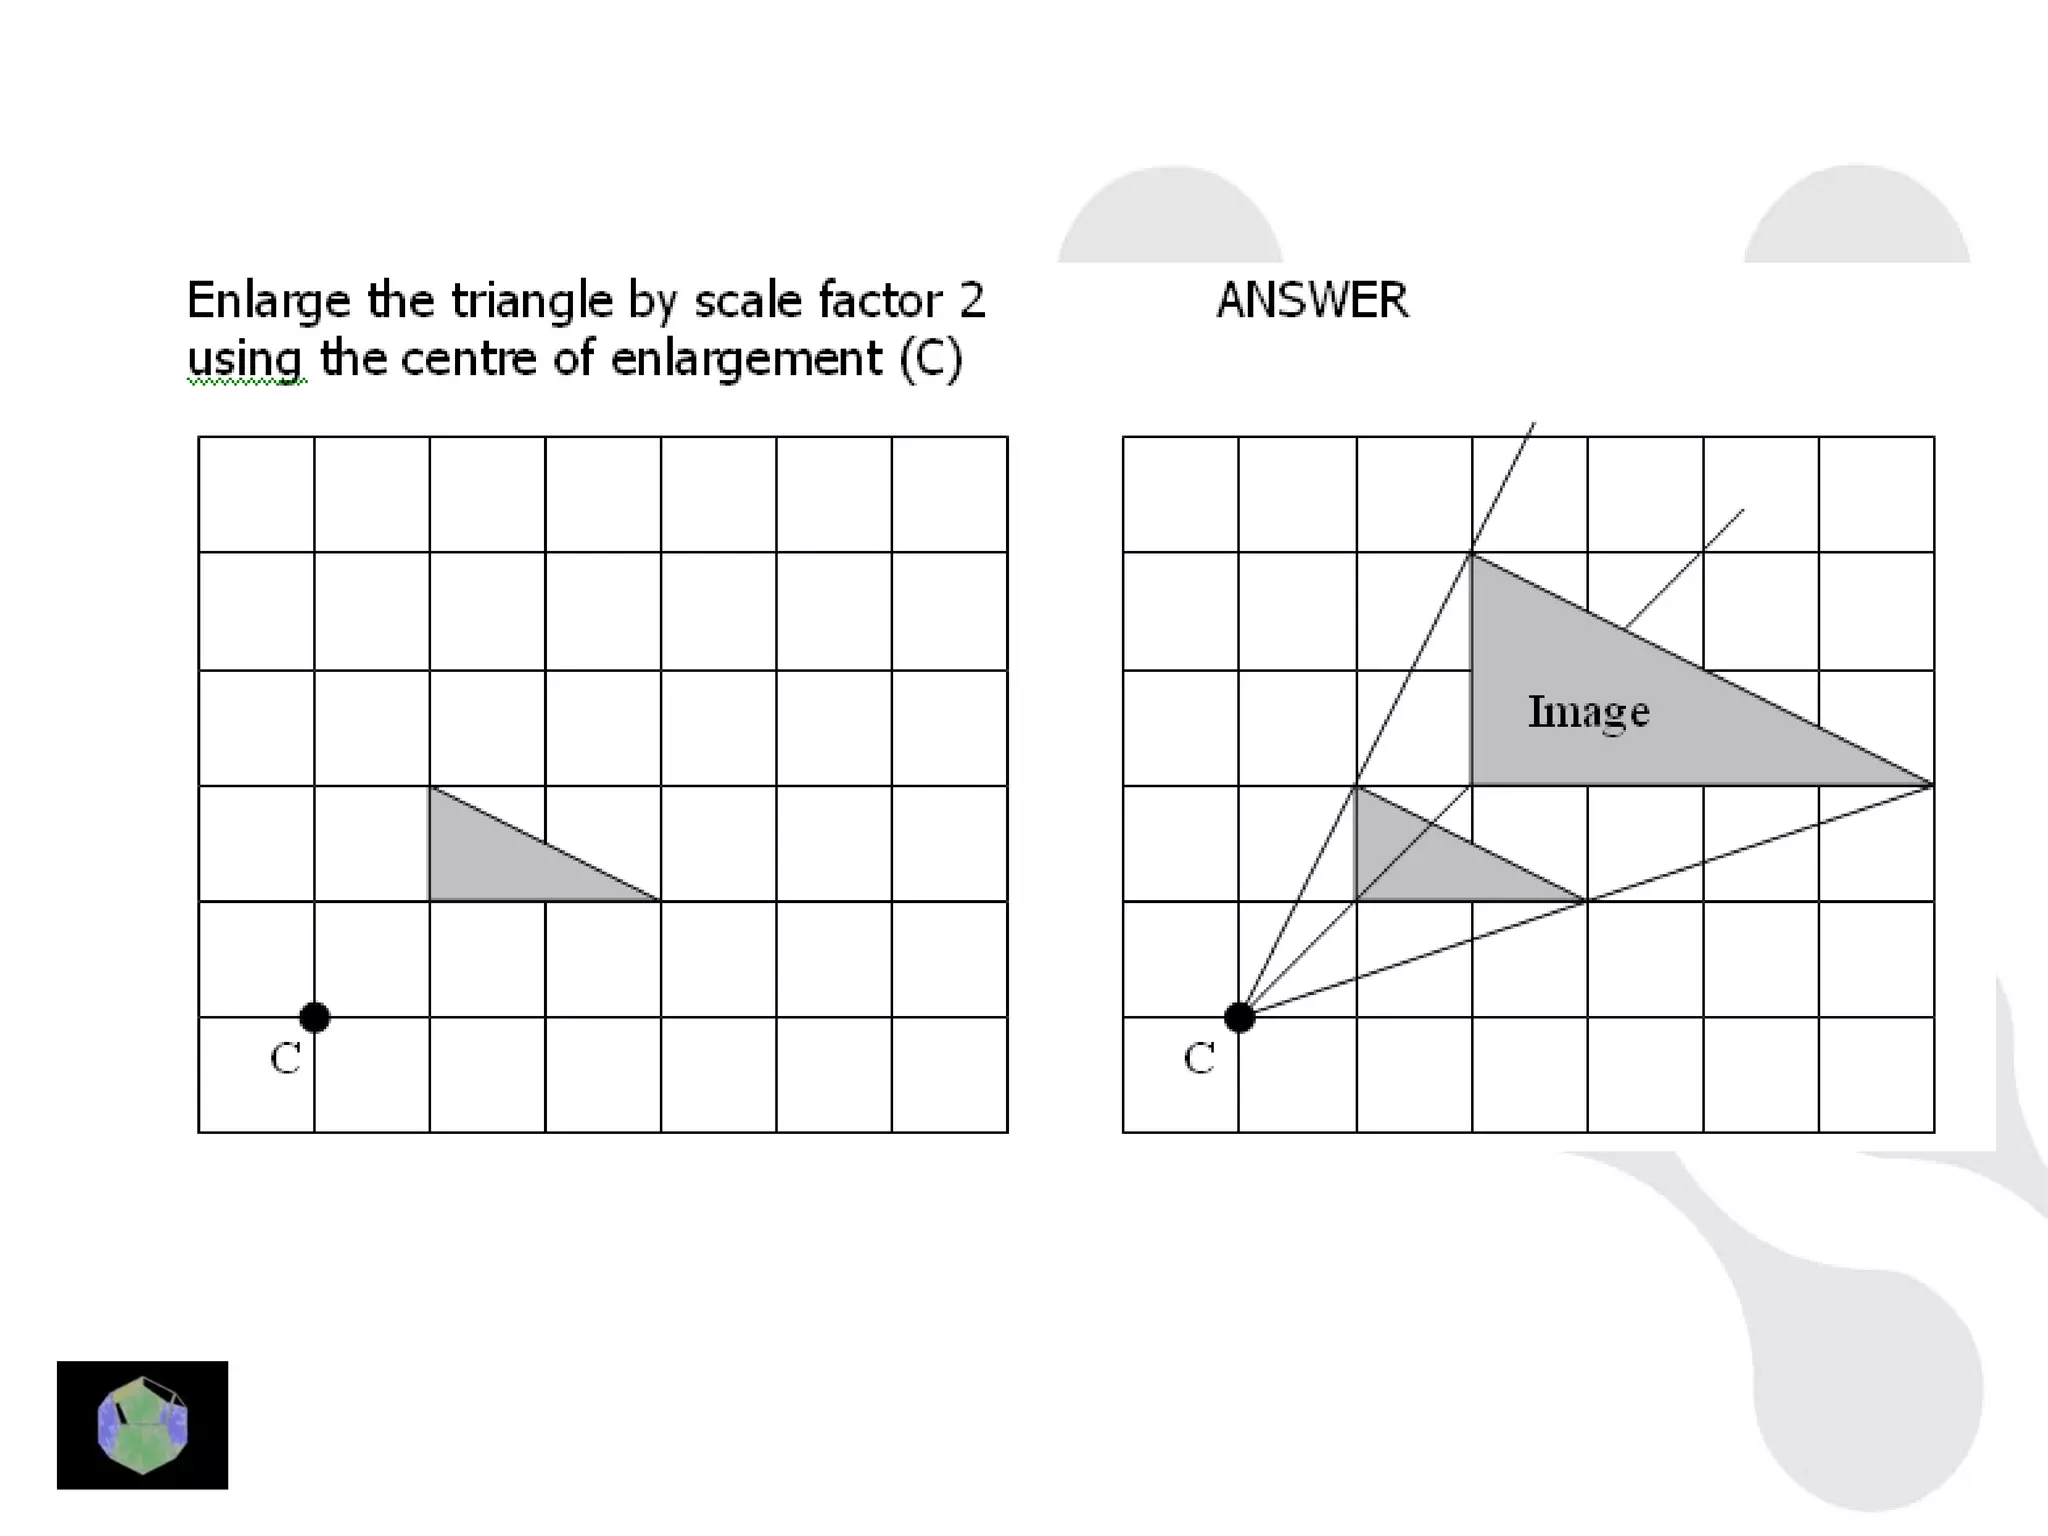
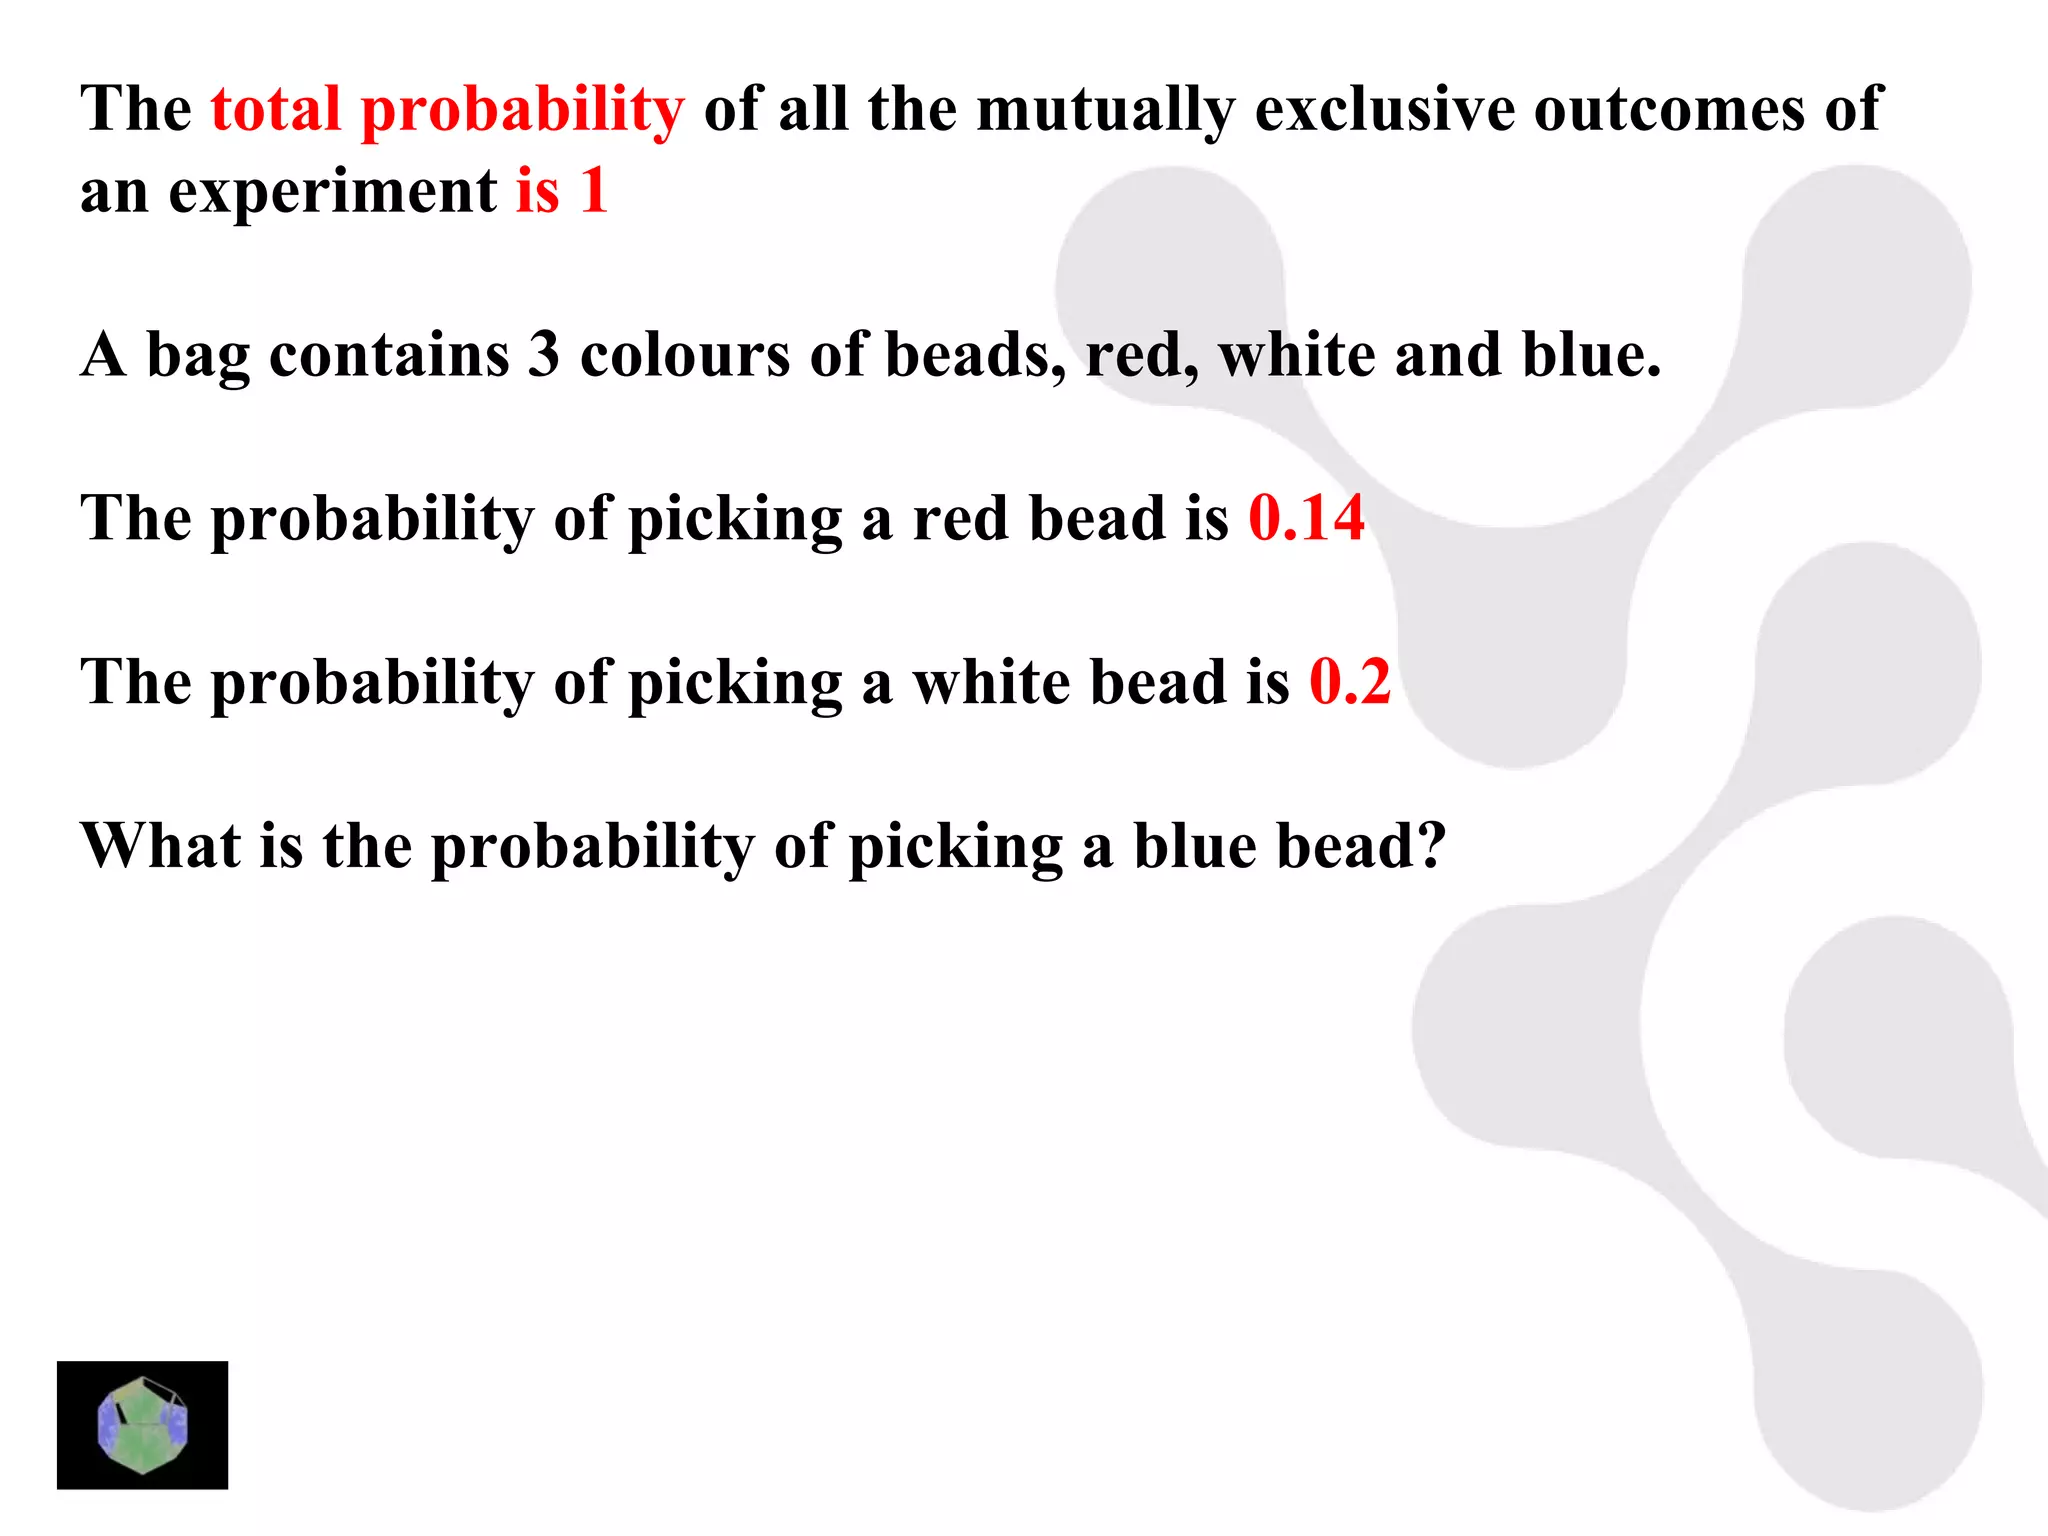
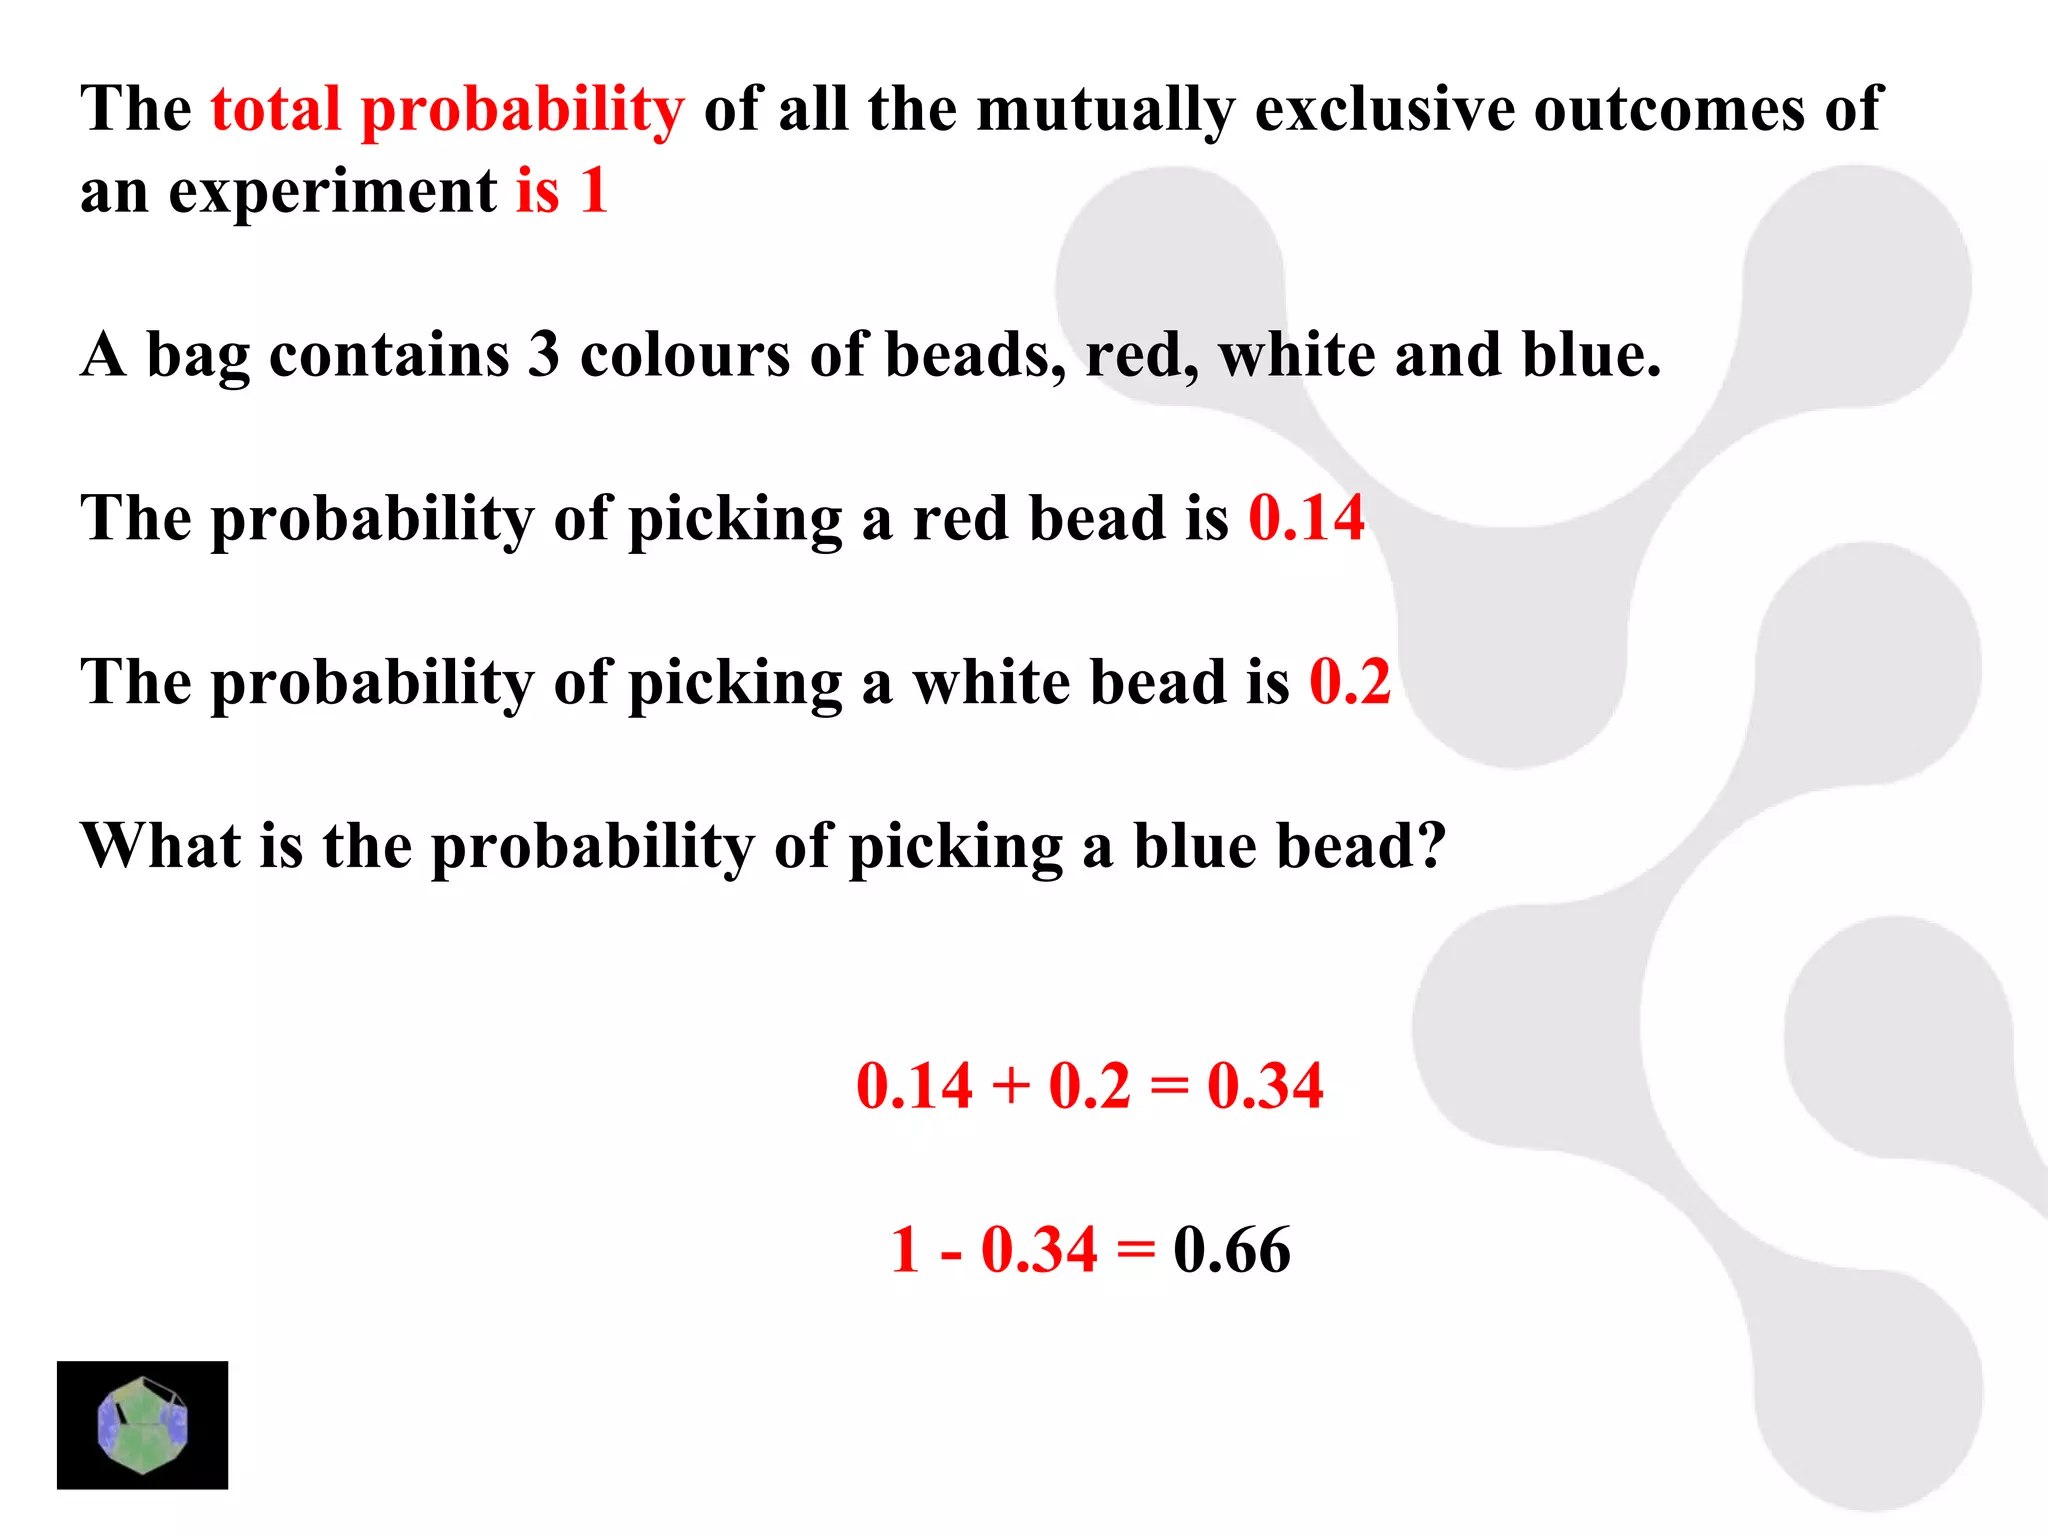
1) The document provides information about key stage 3 mathematics including solving equations using trial and improvement, percentages, ratios, sequences, straight line graphs, properties of shapes, and properties of polygons.
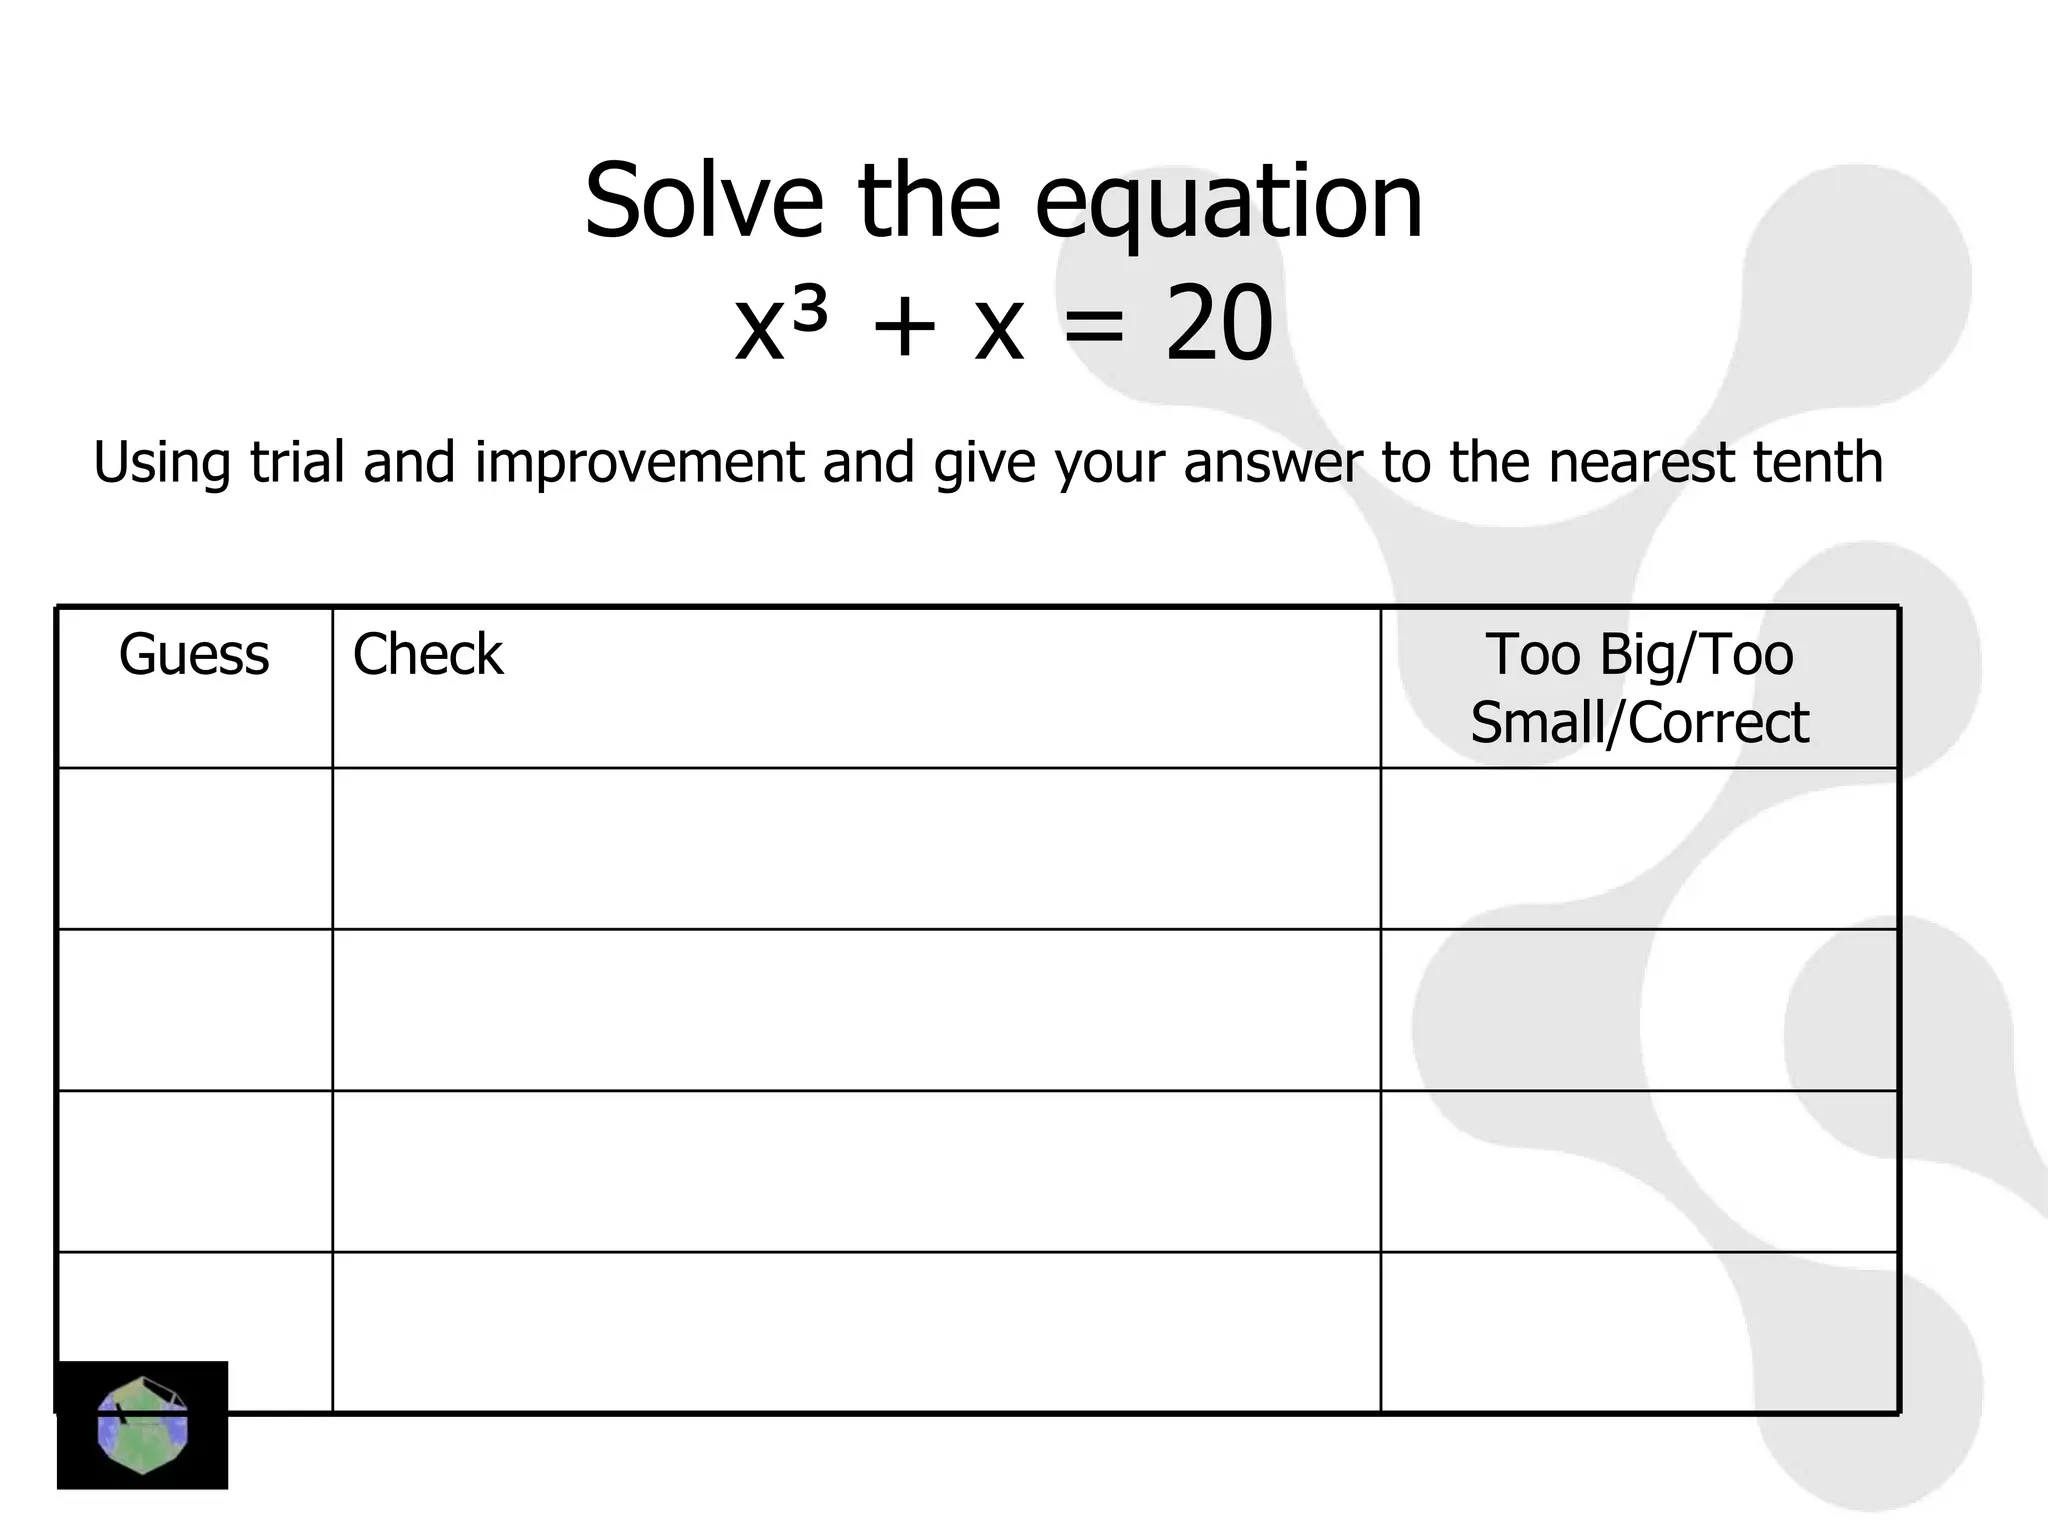
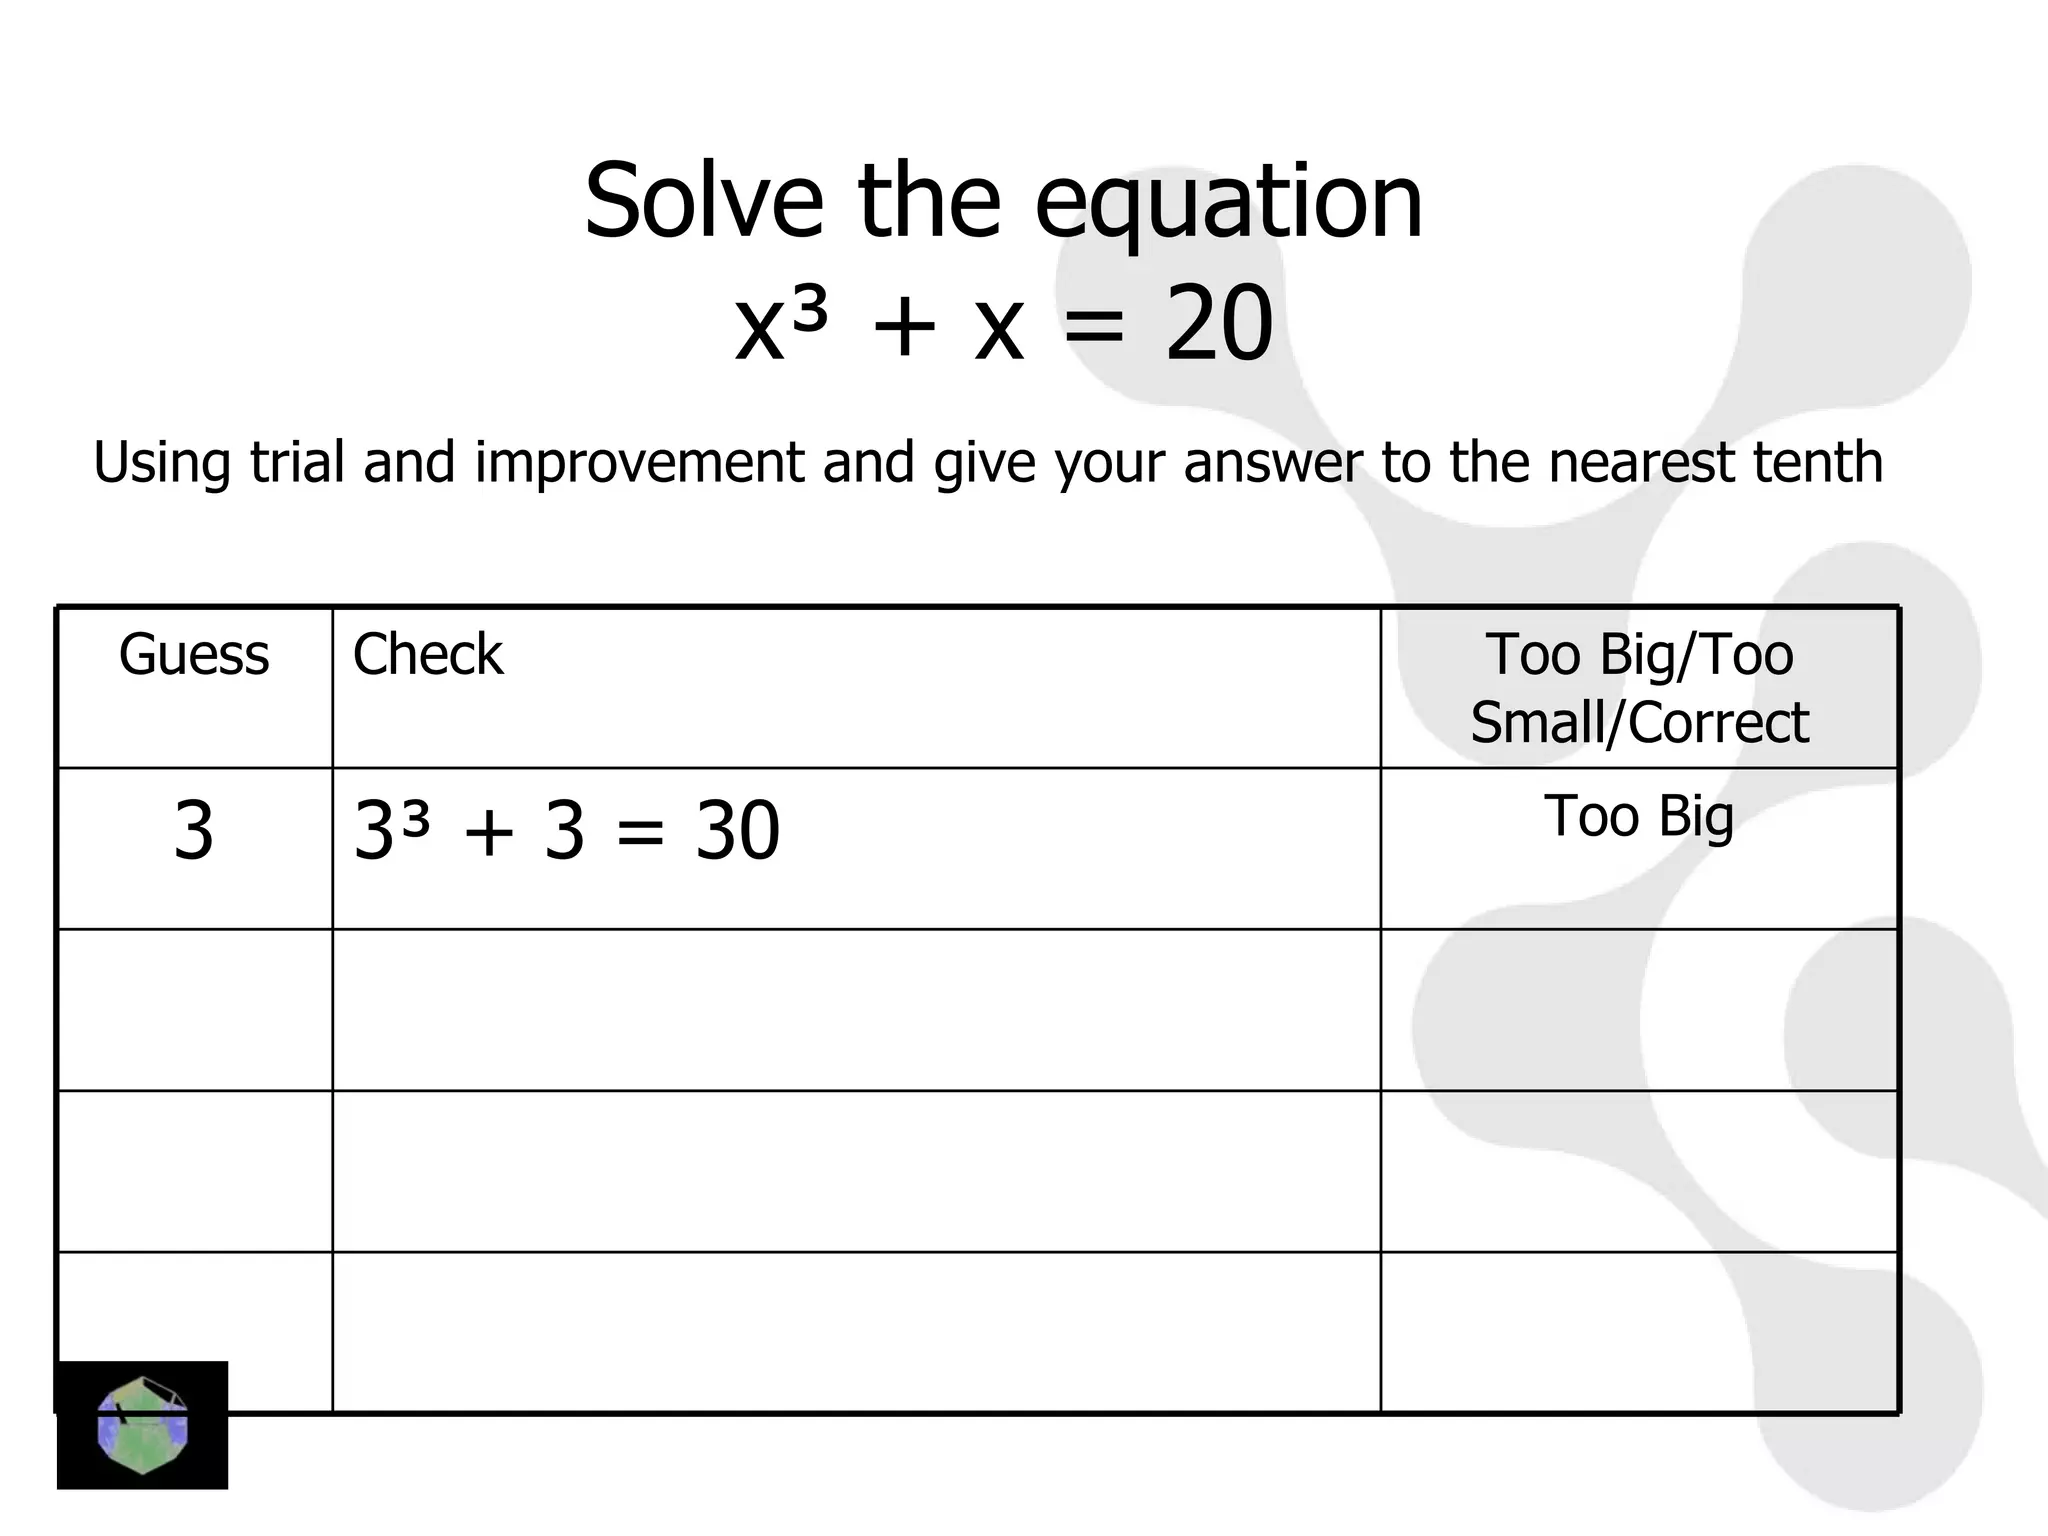
2) It gives examples of solving equations like x3 + x = 20 using guesses and checks to find the solution to the nearest tenth.
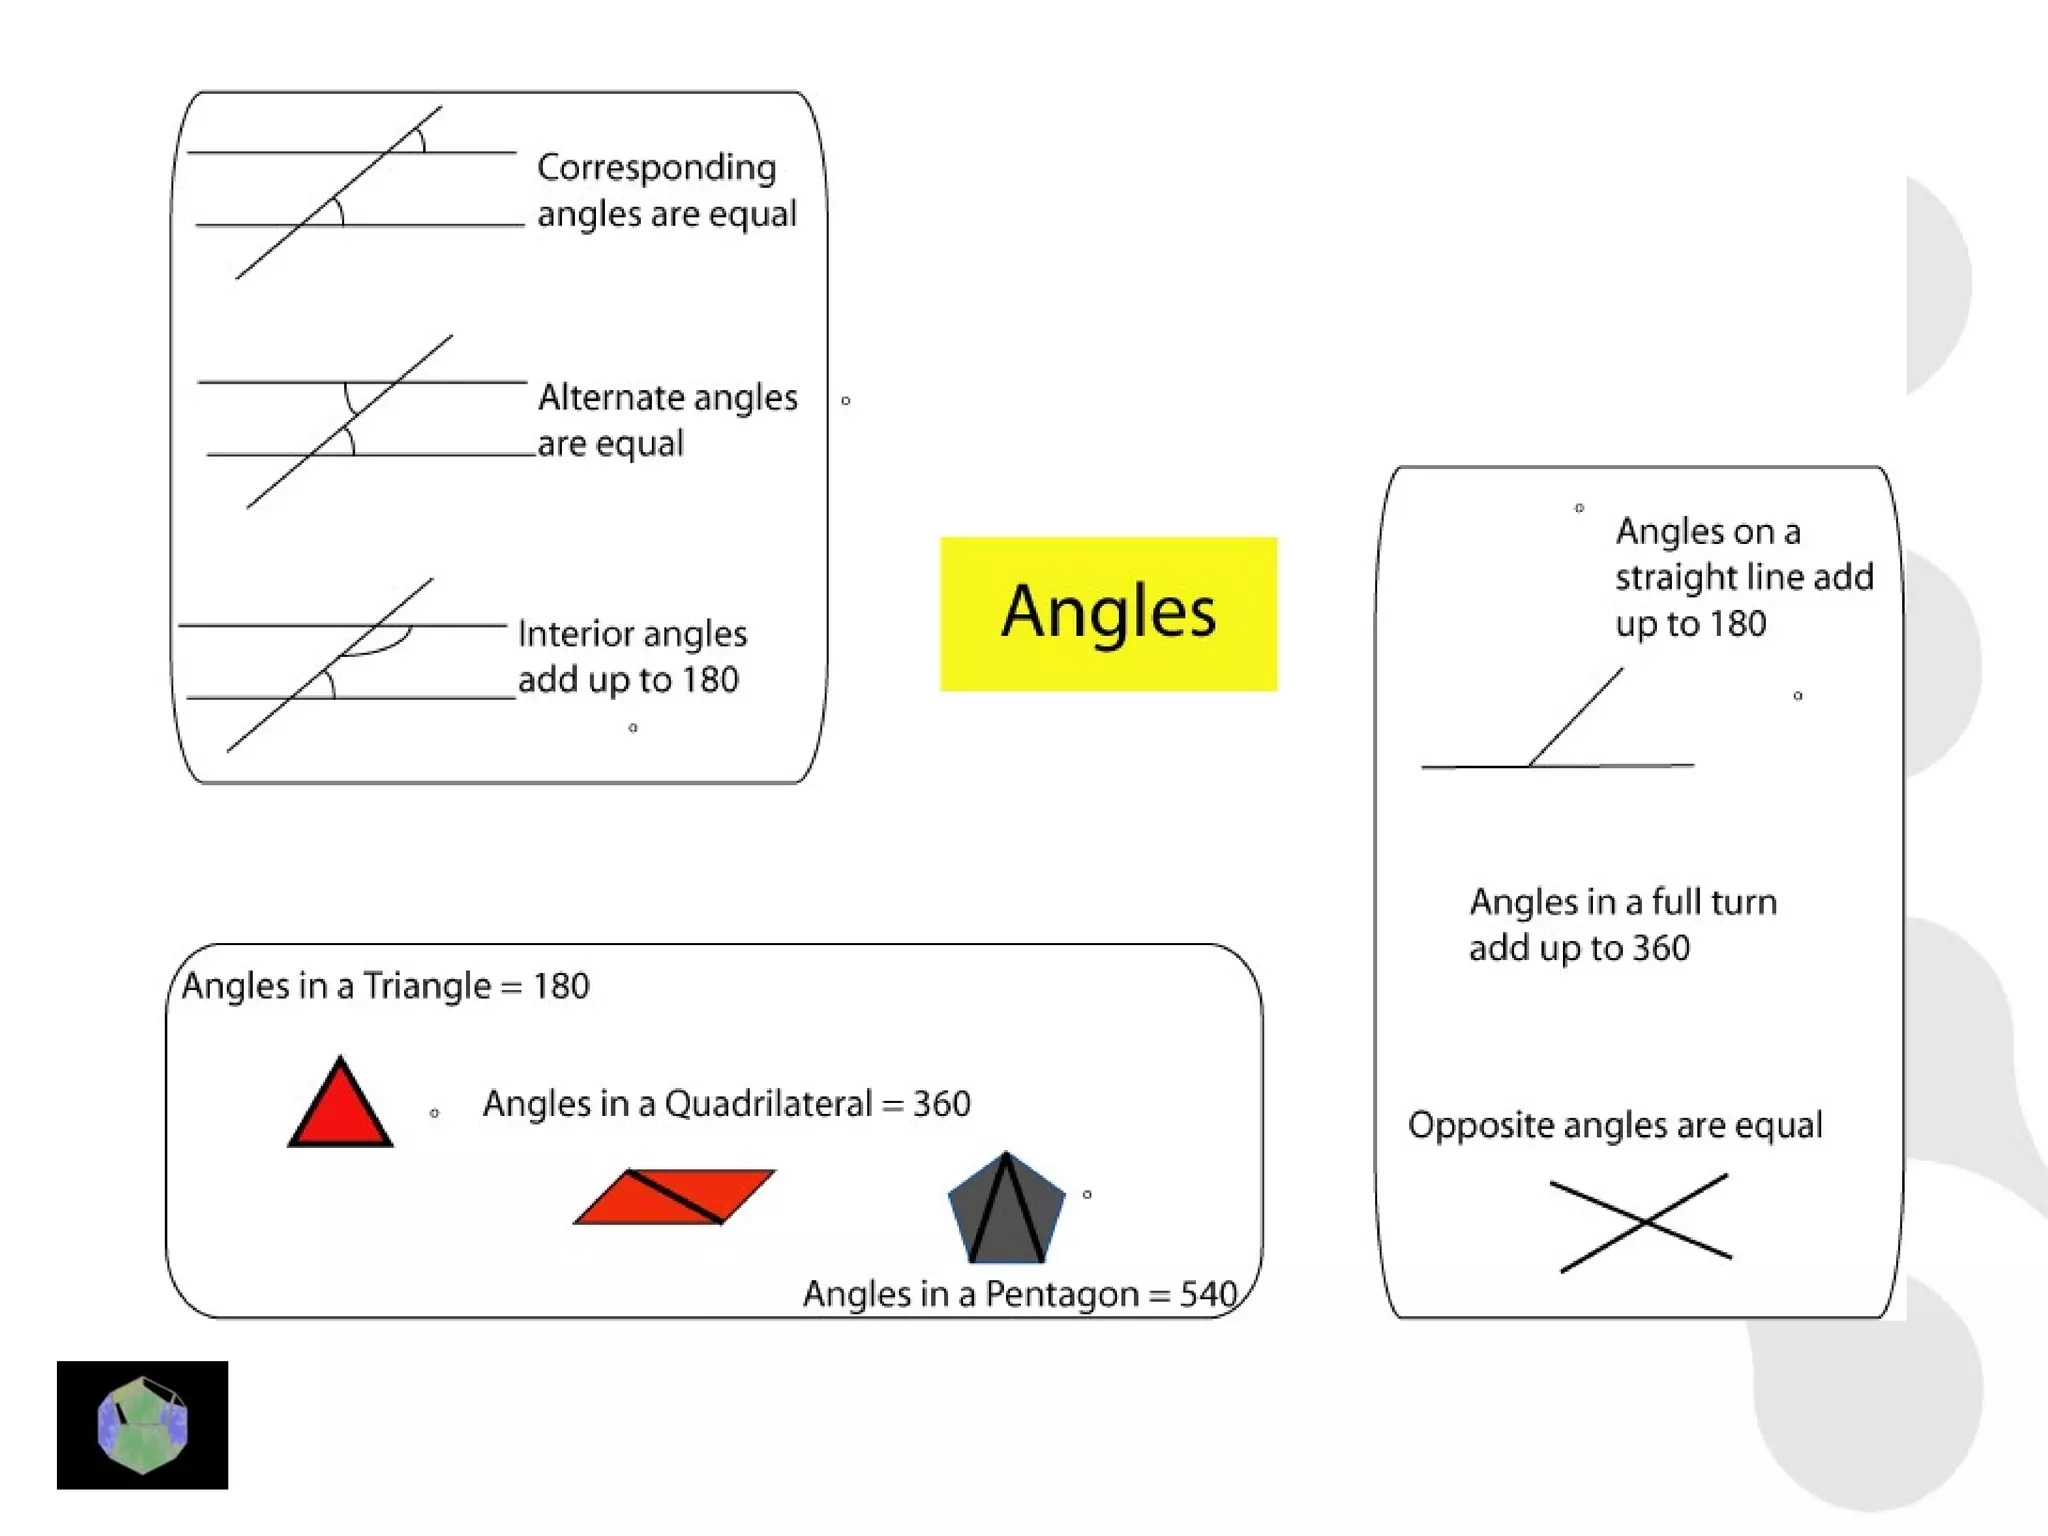
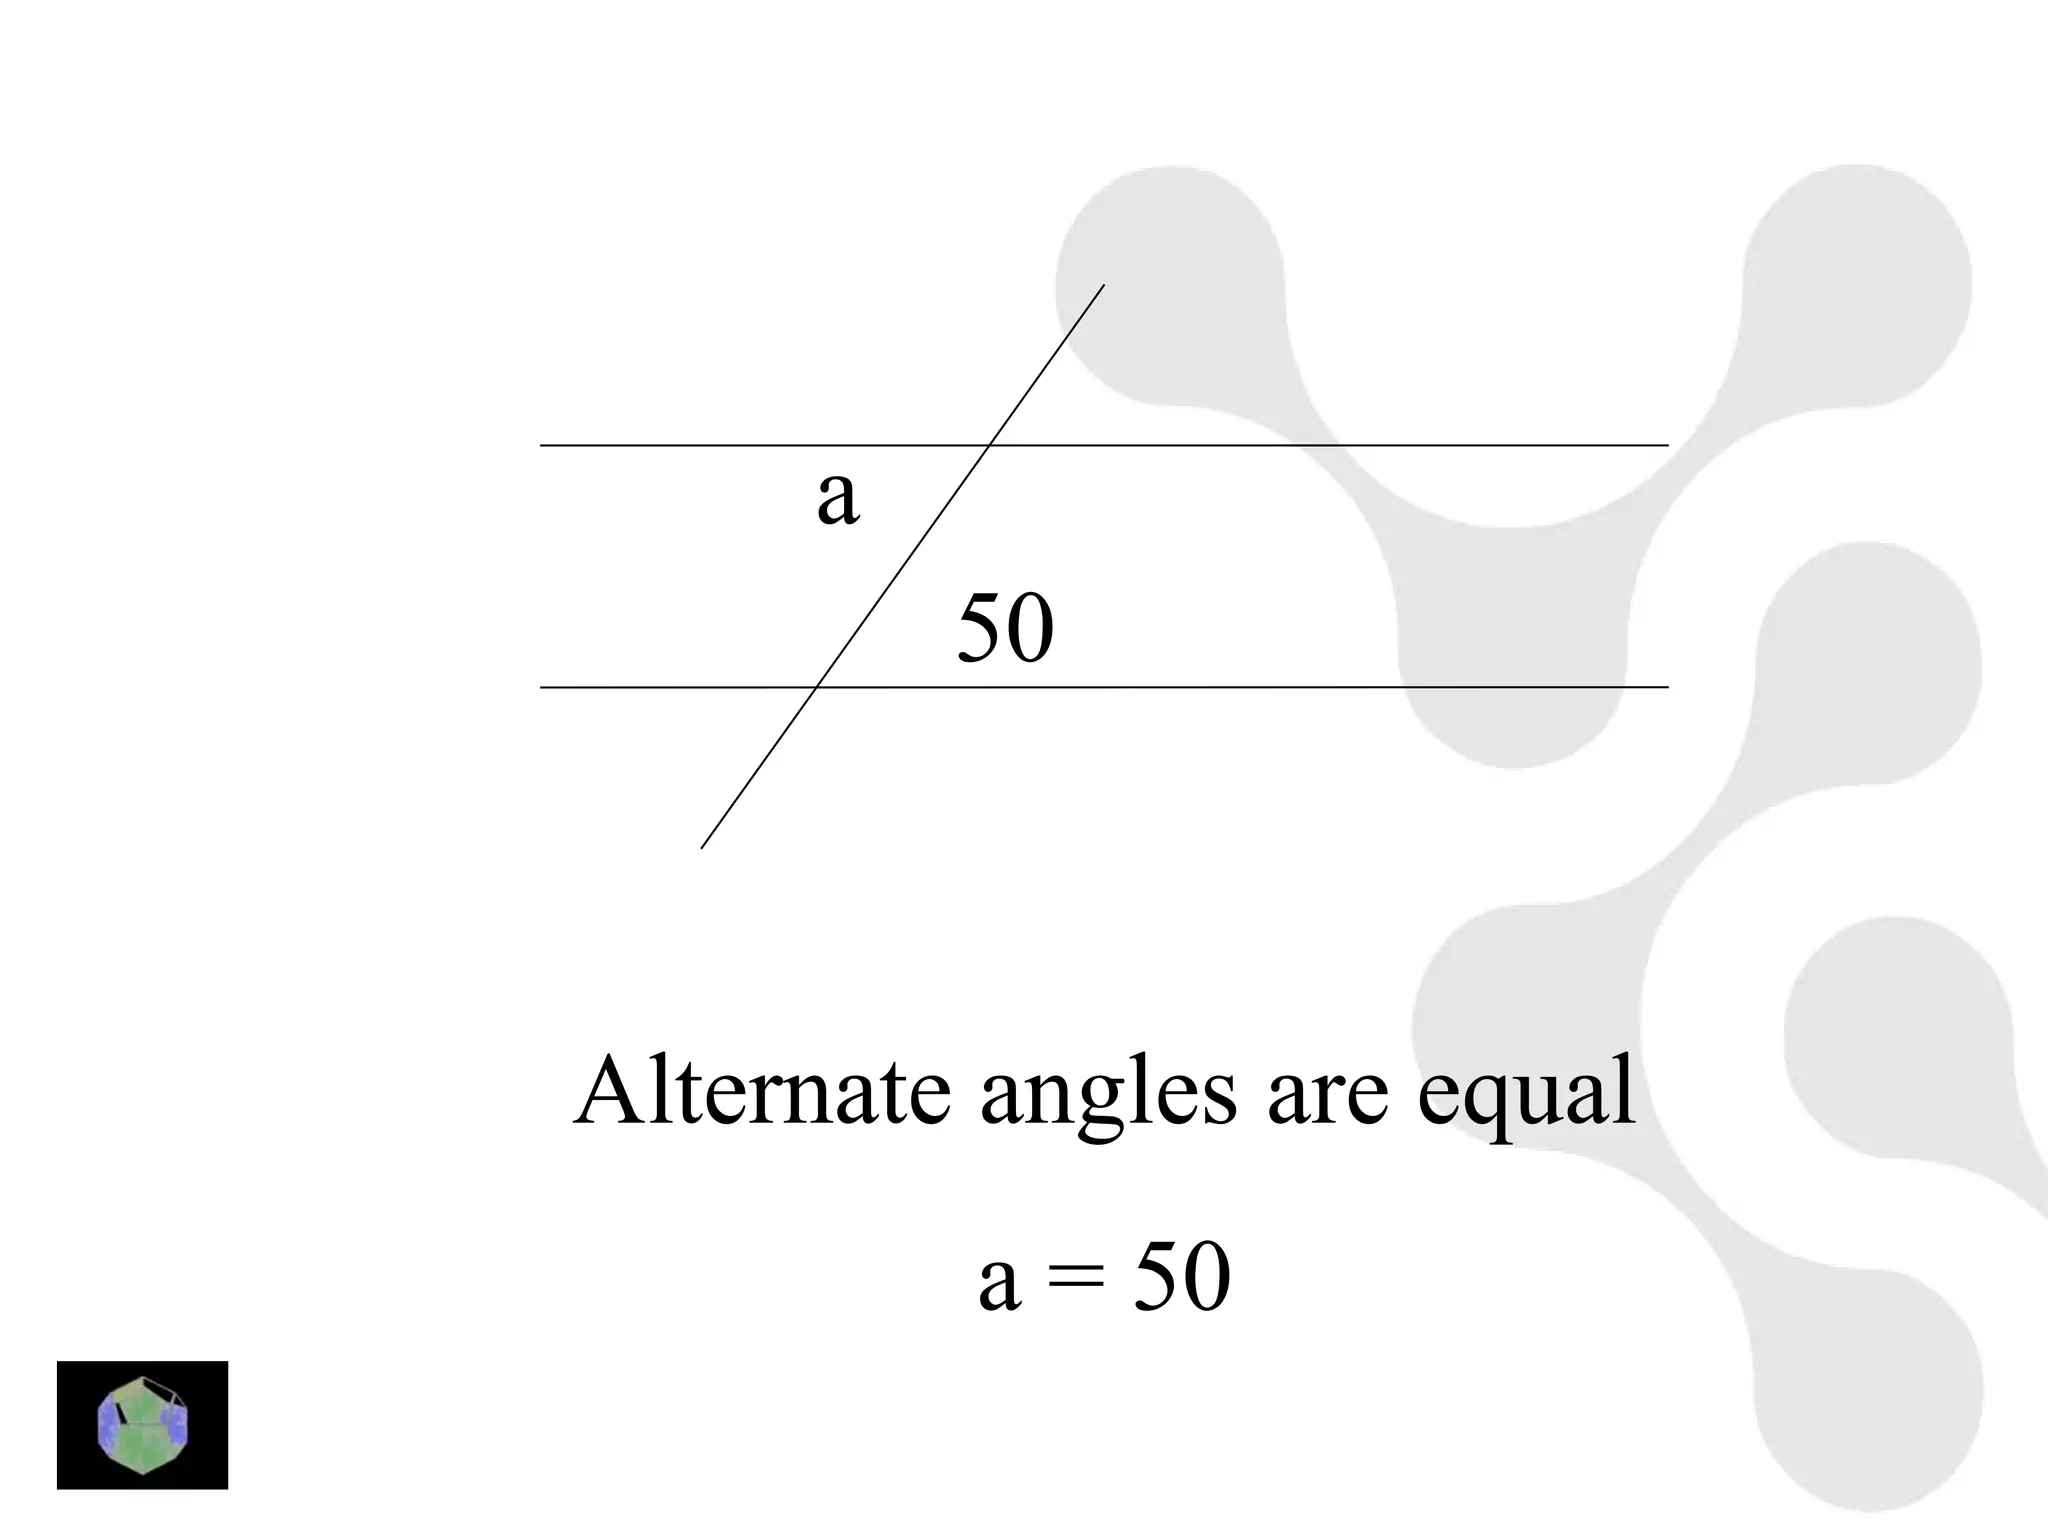
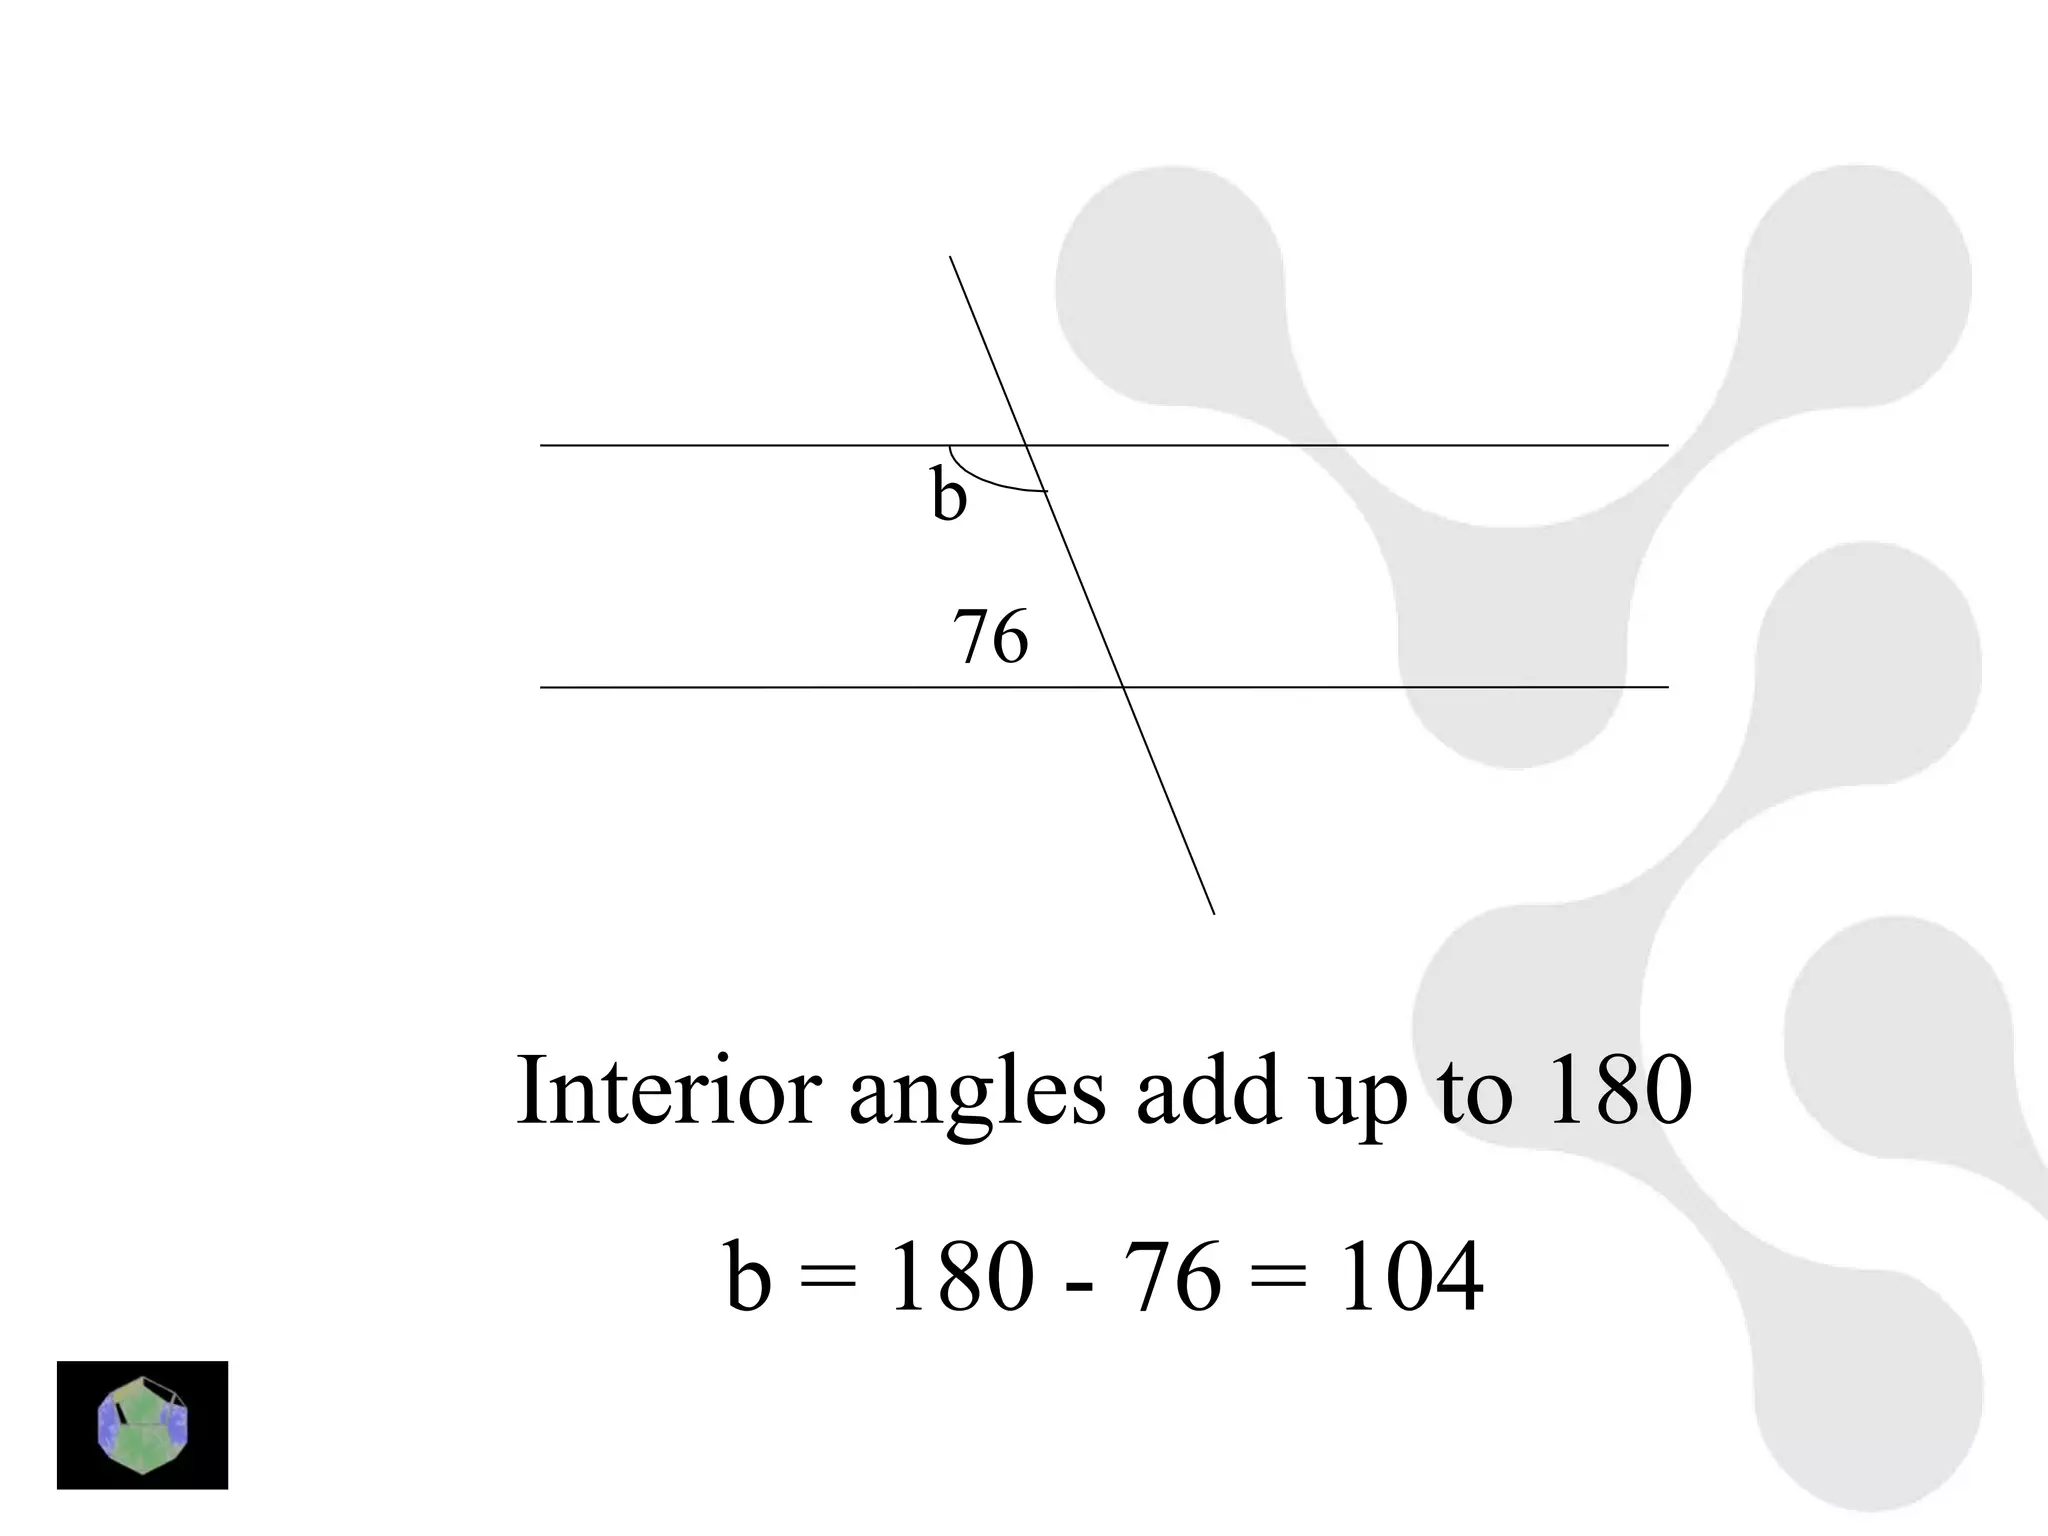
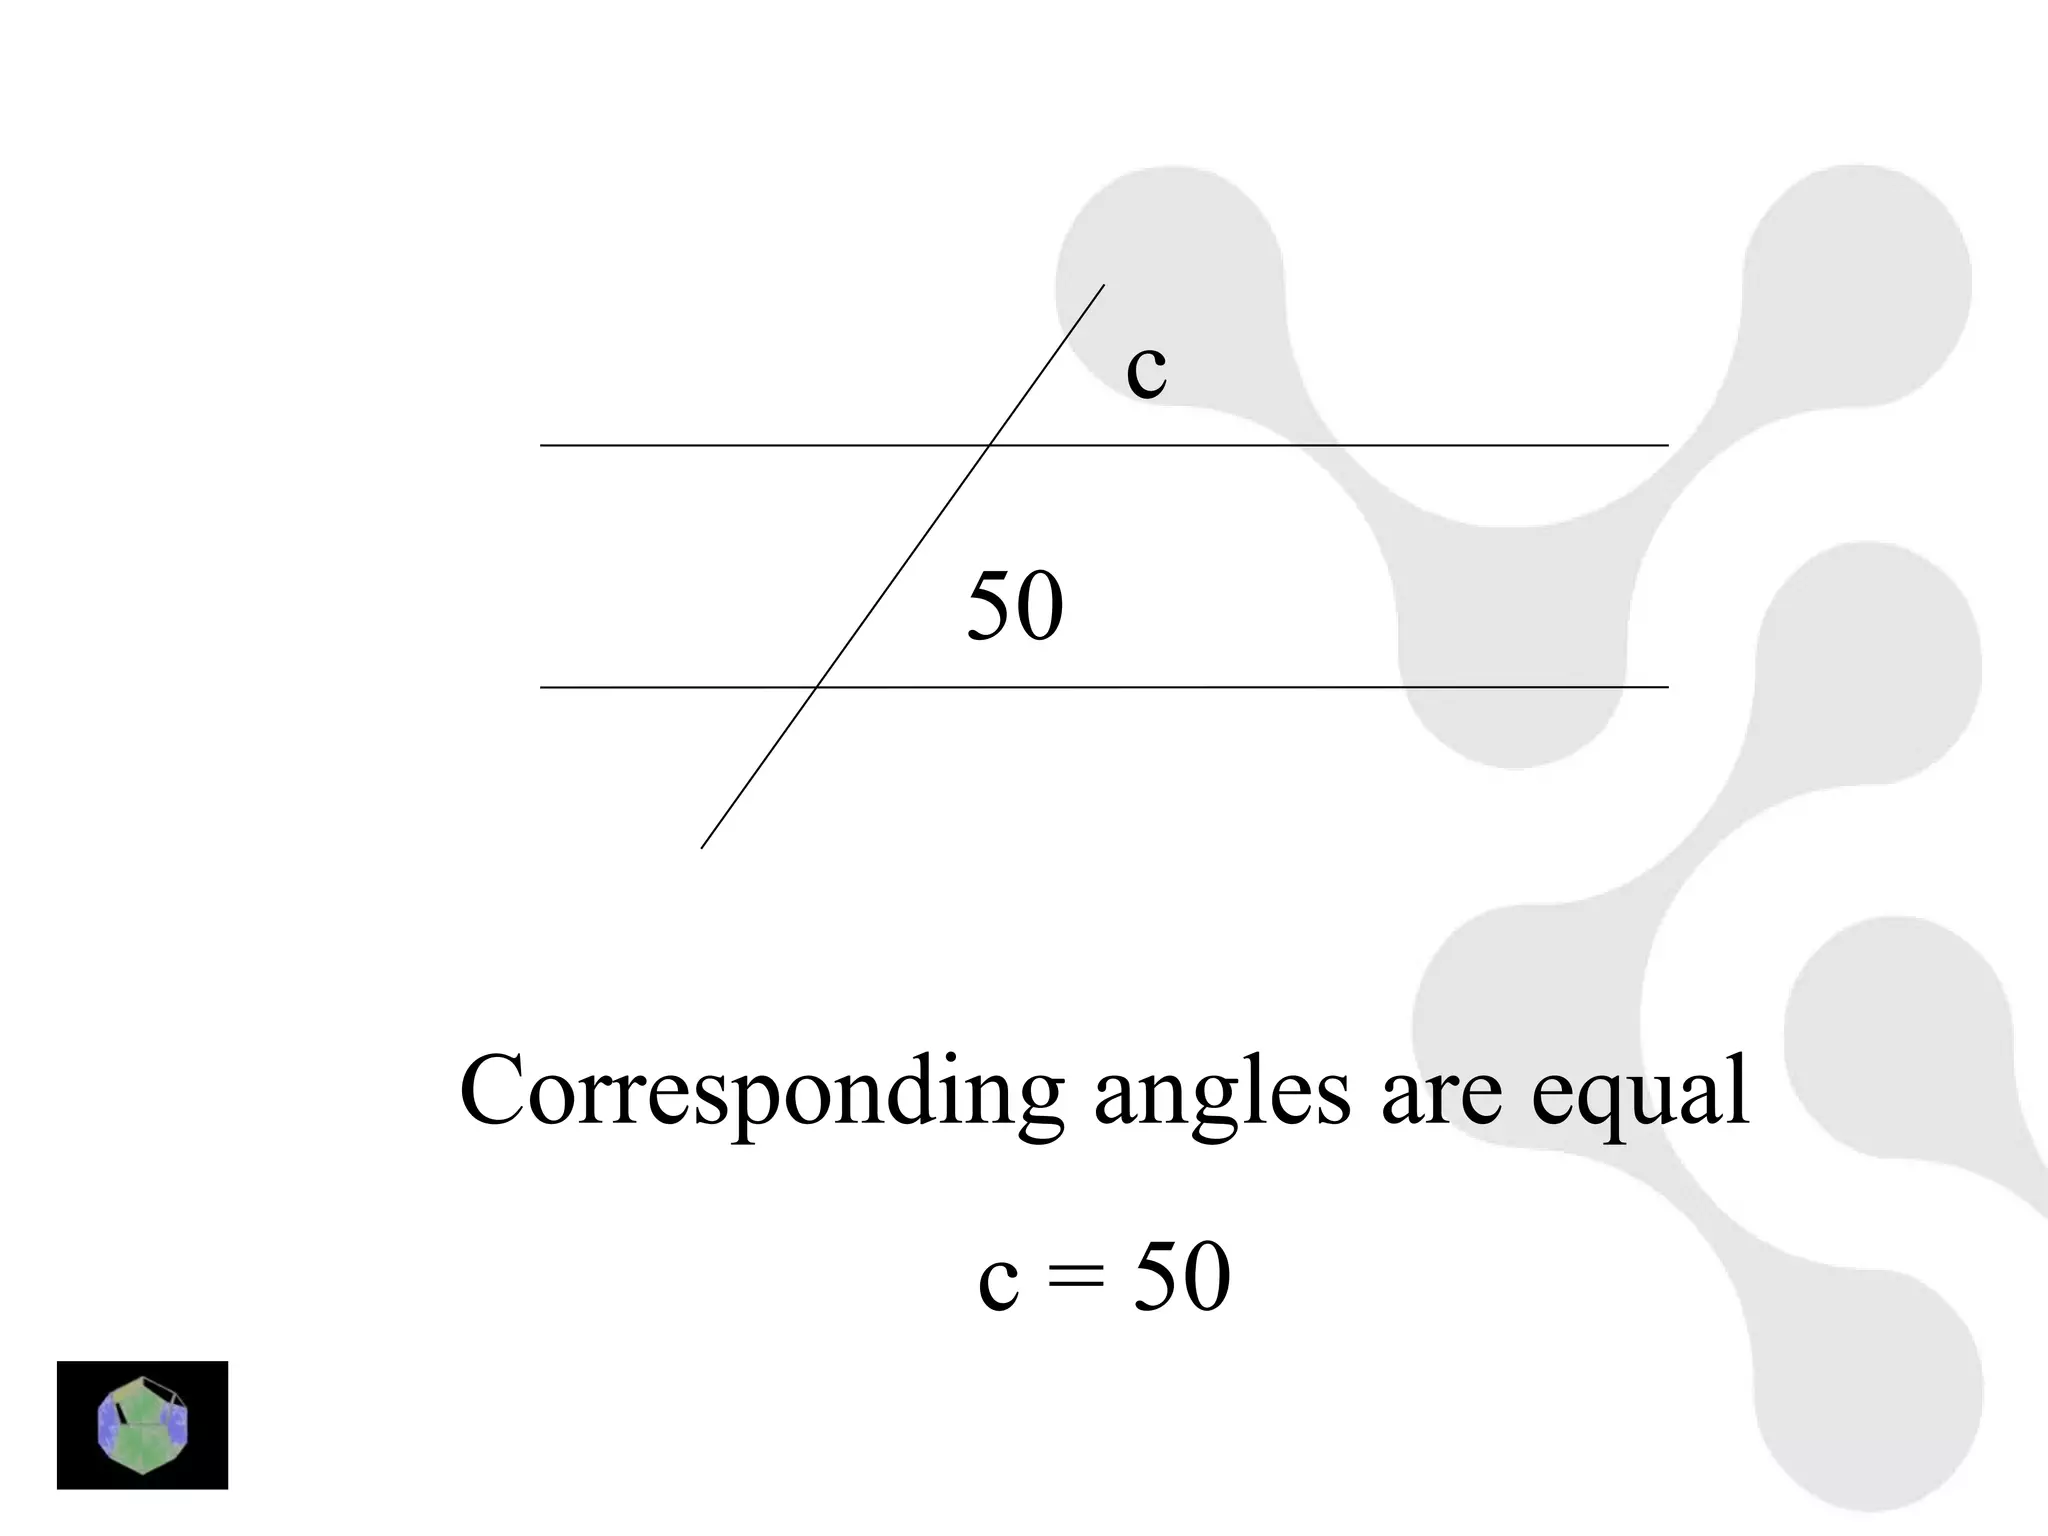
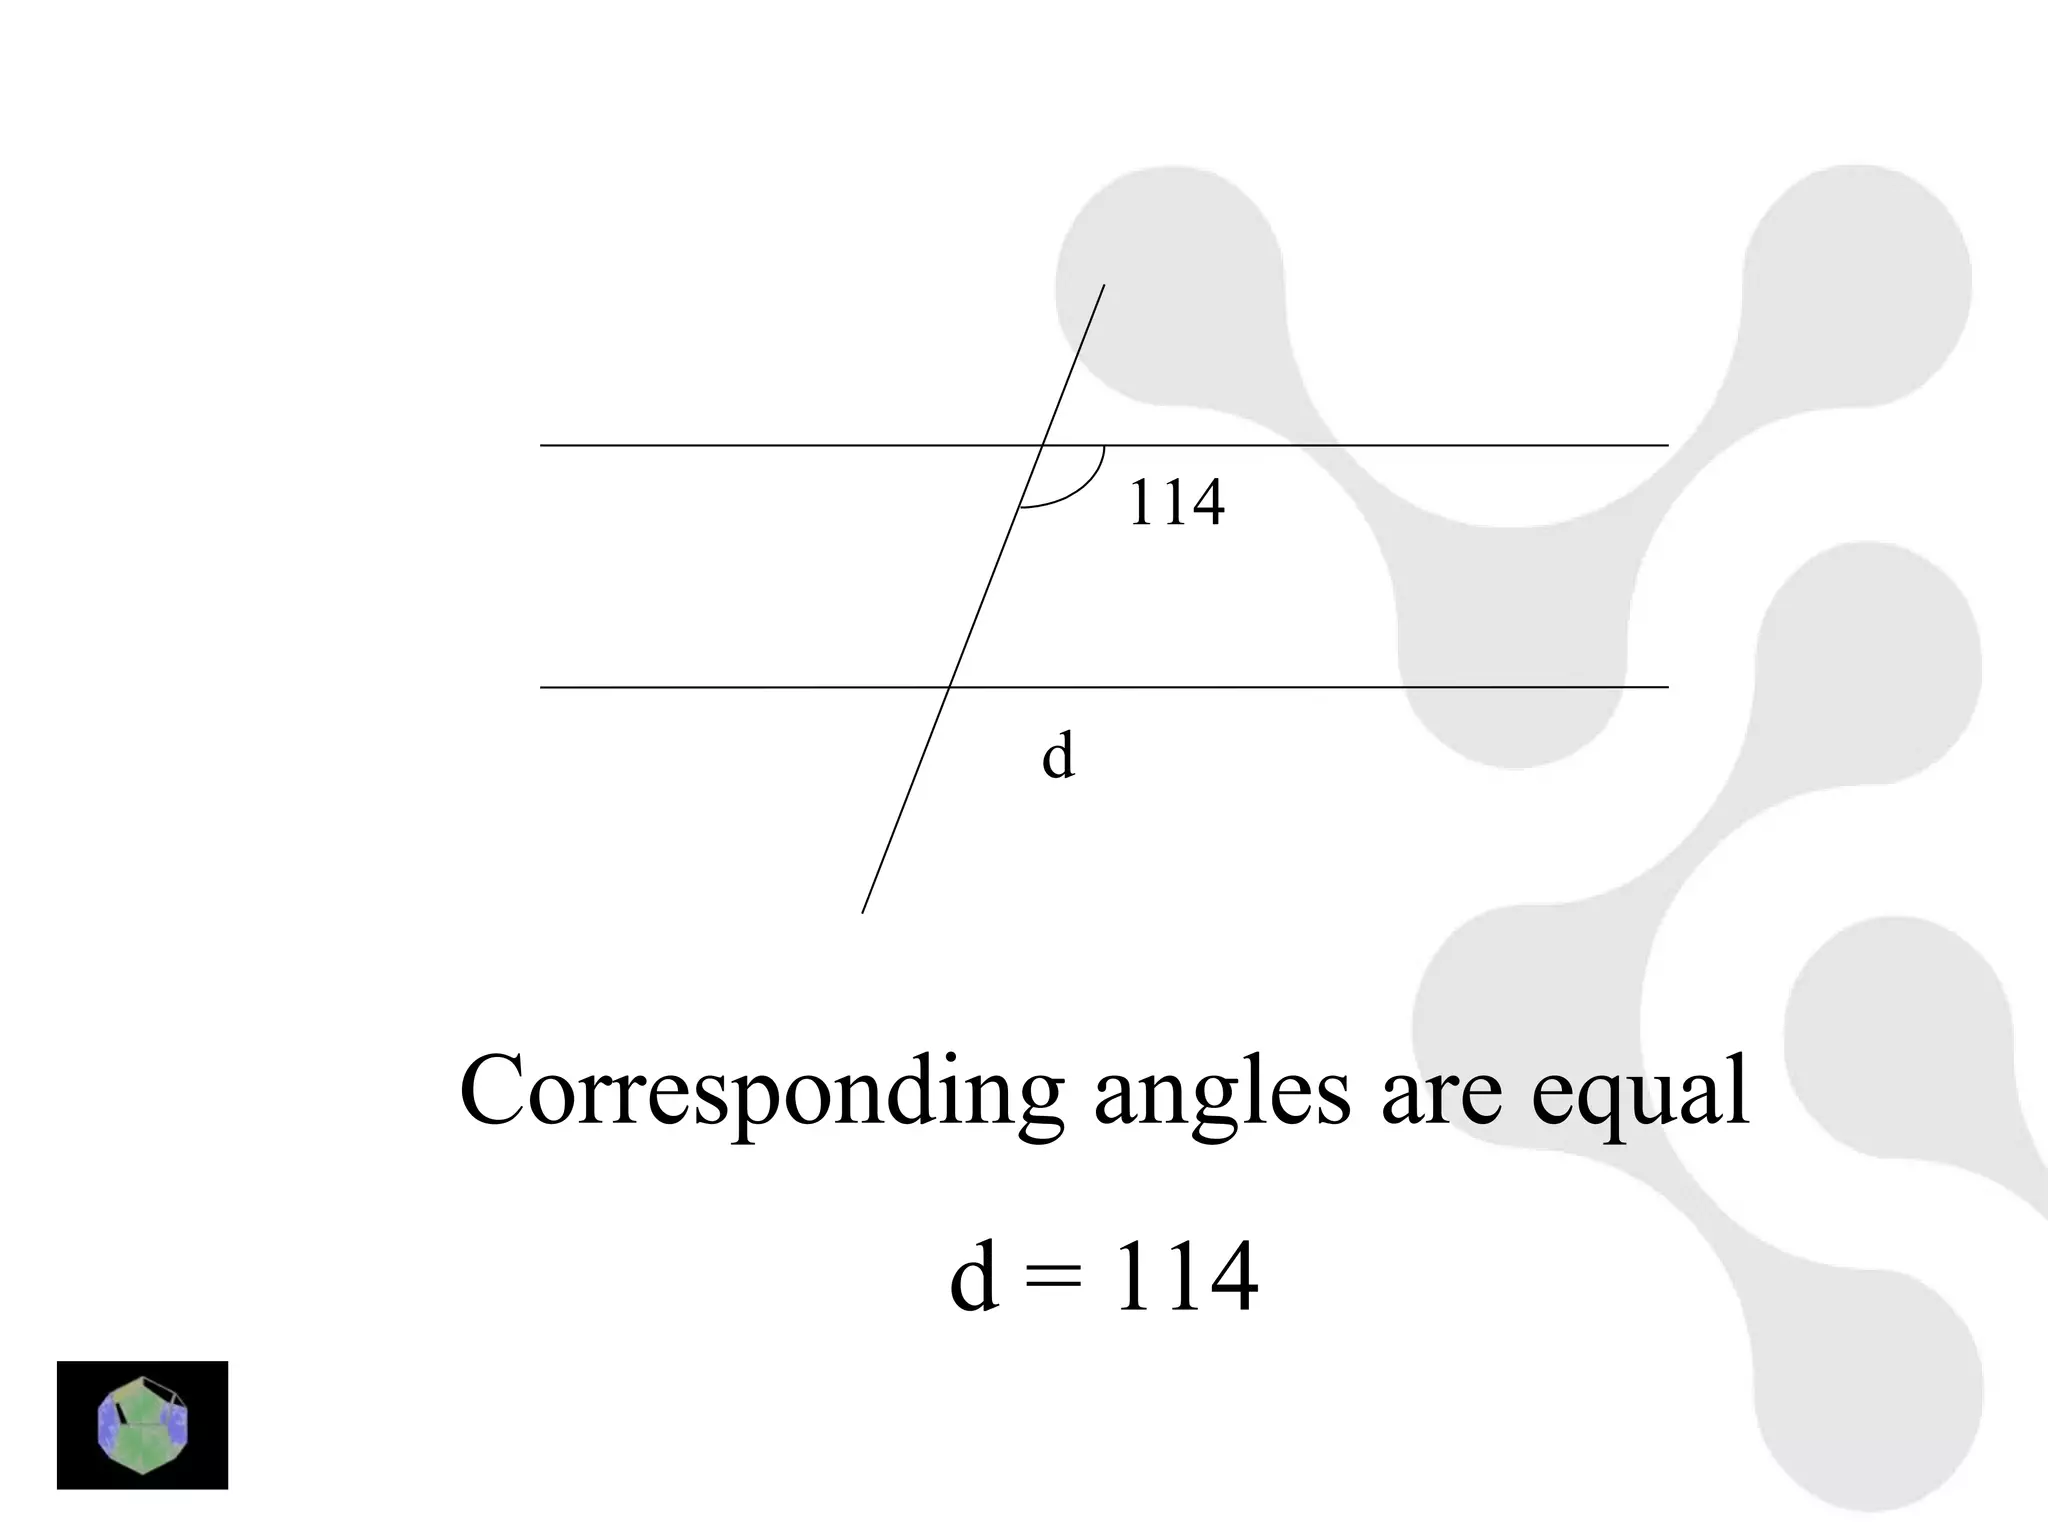
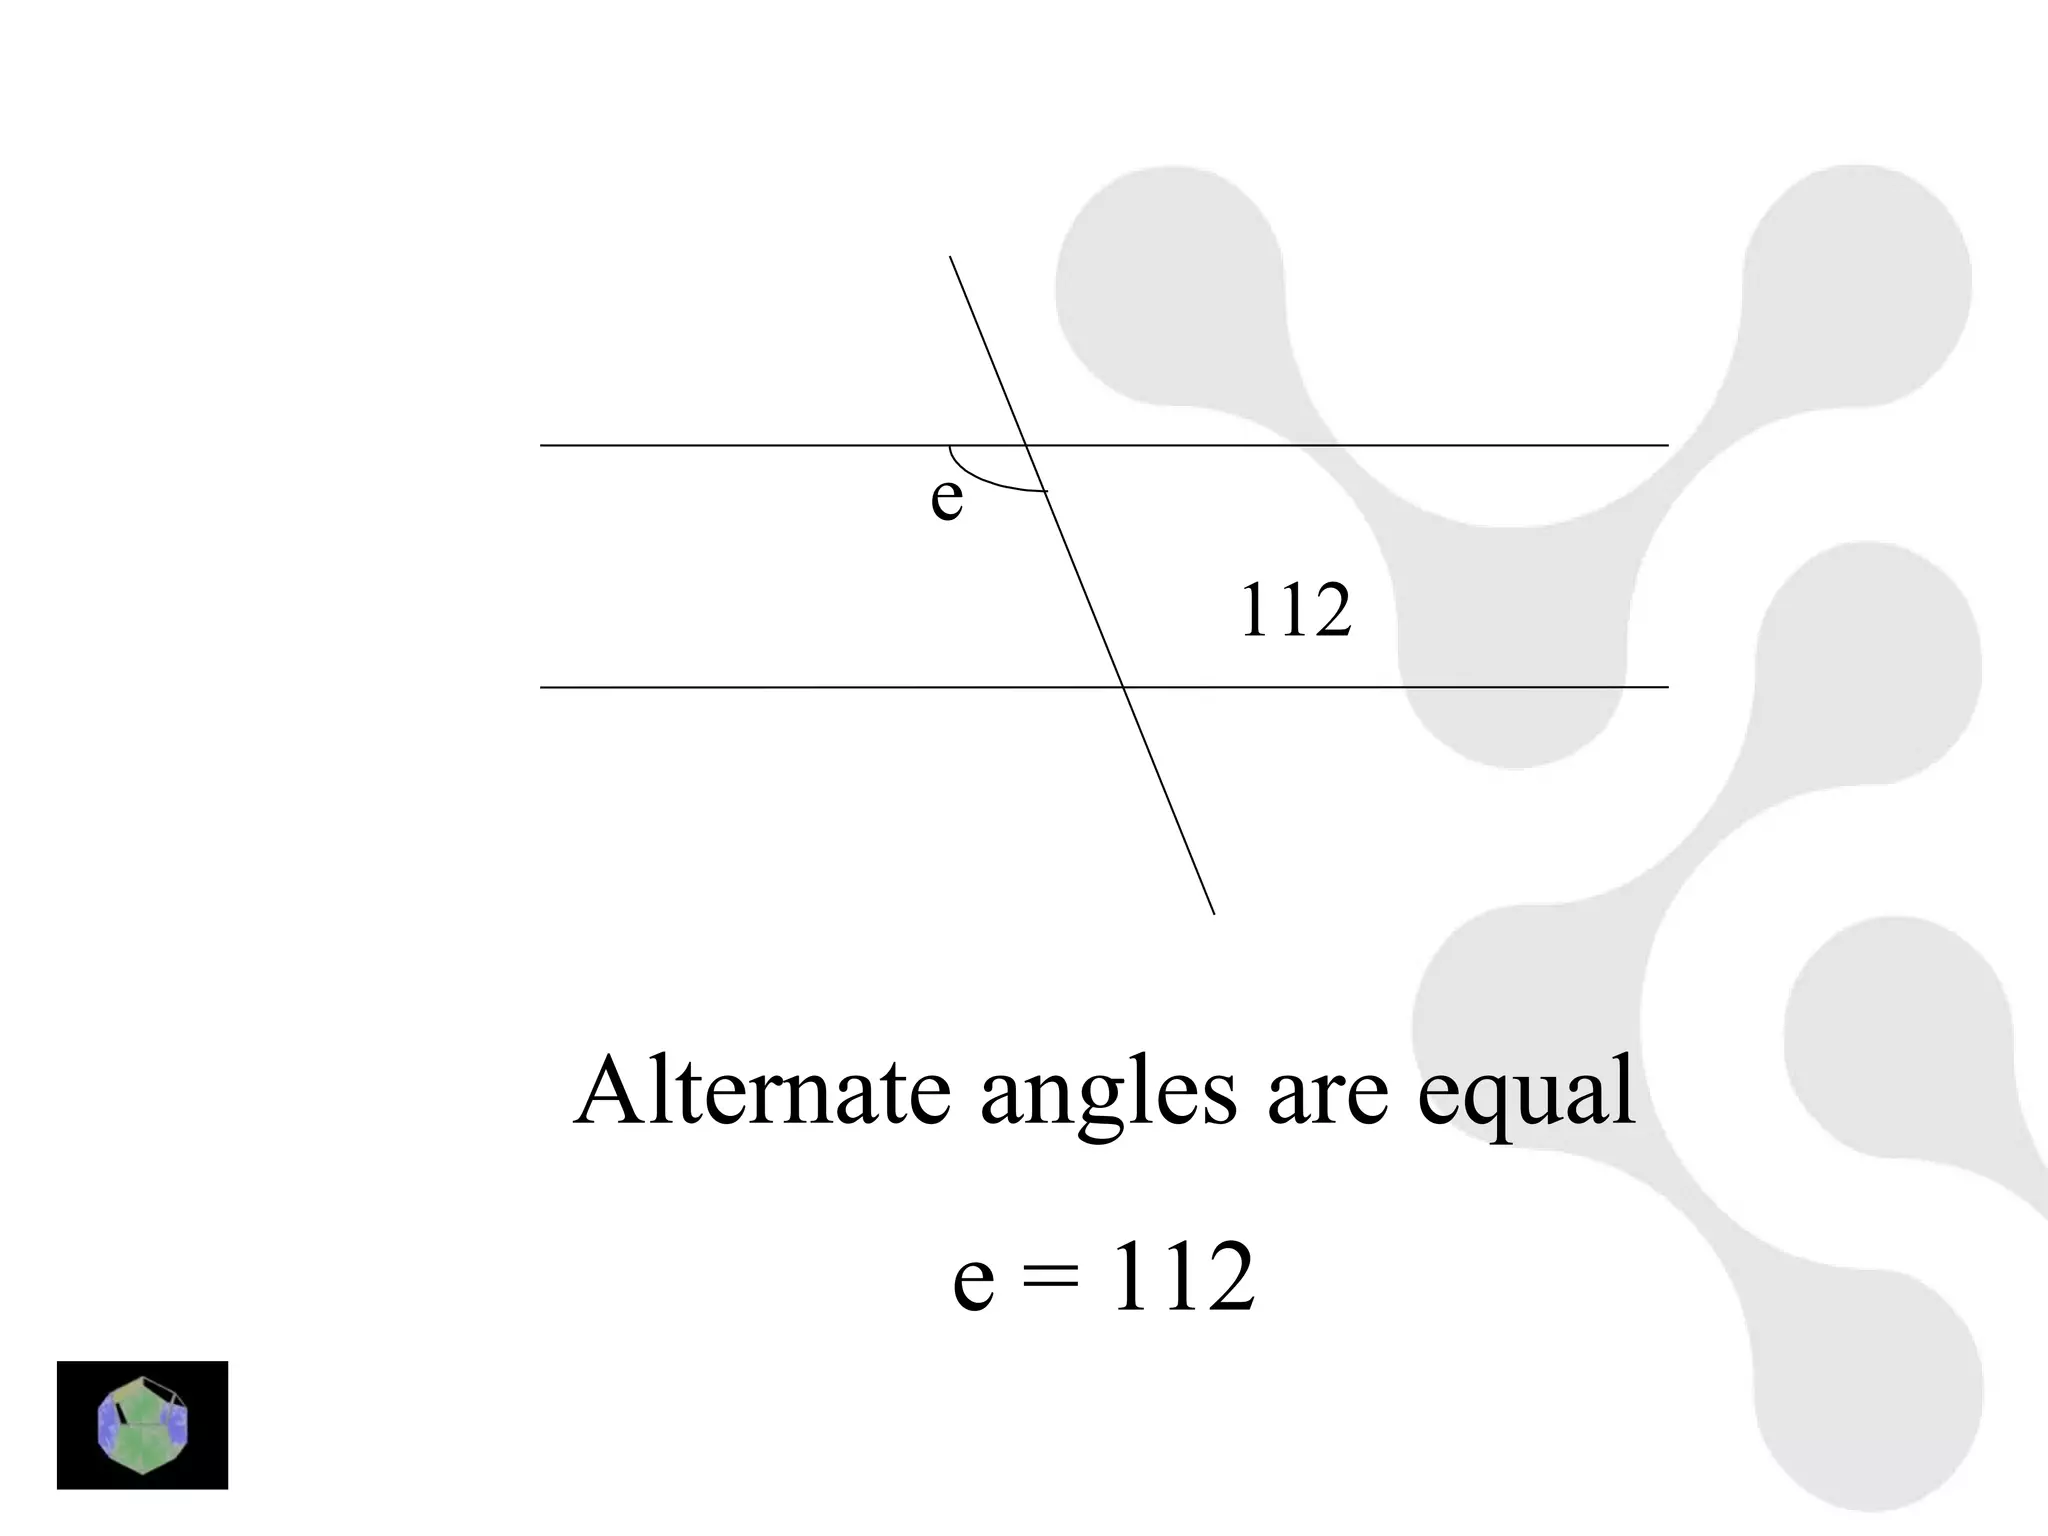
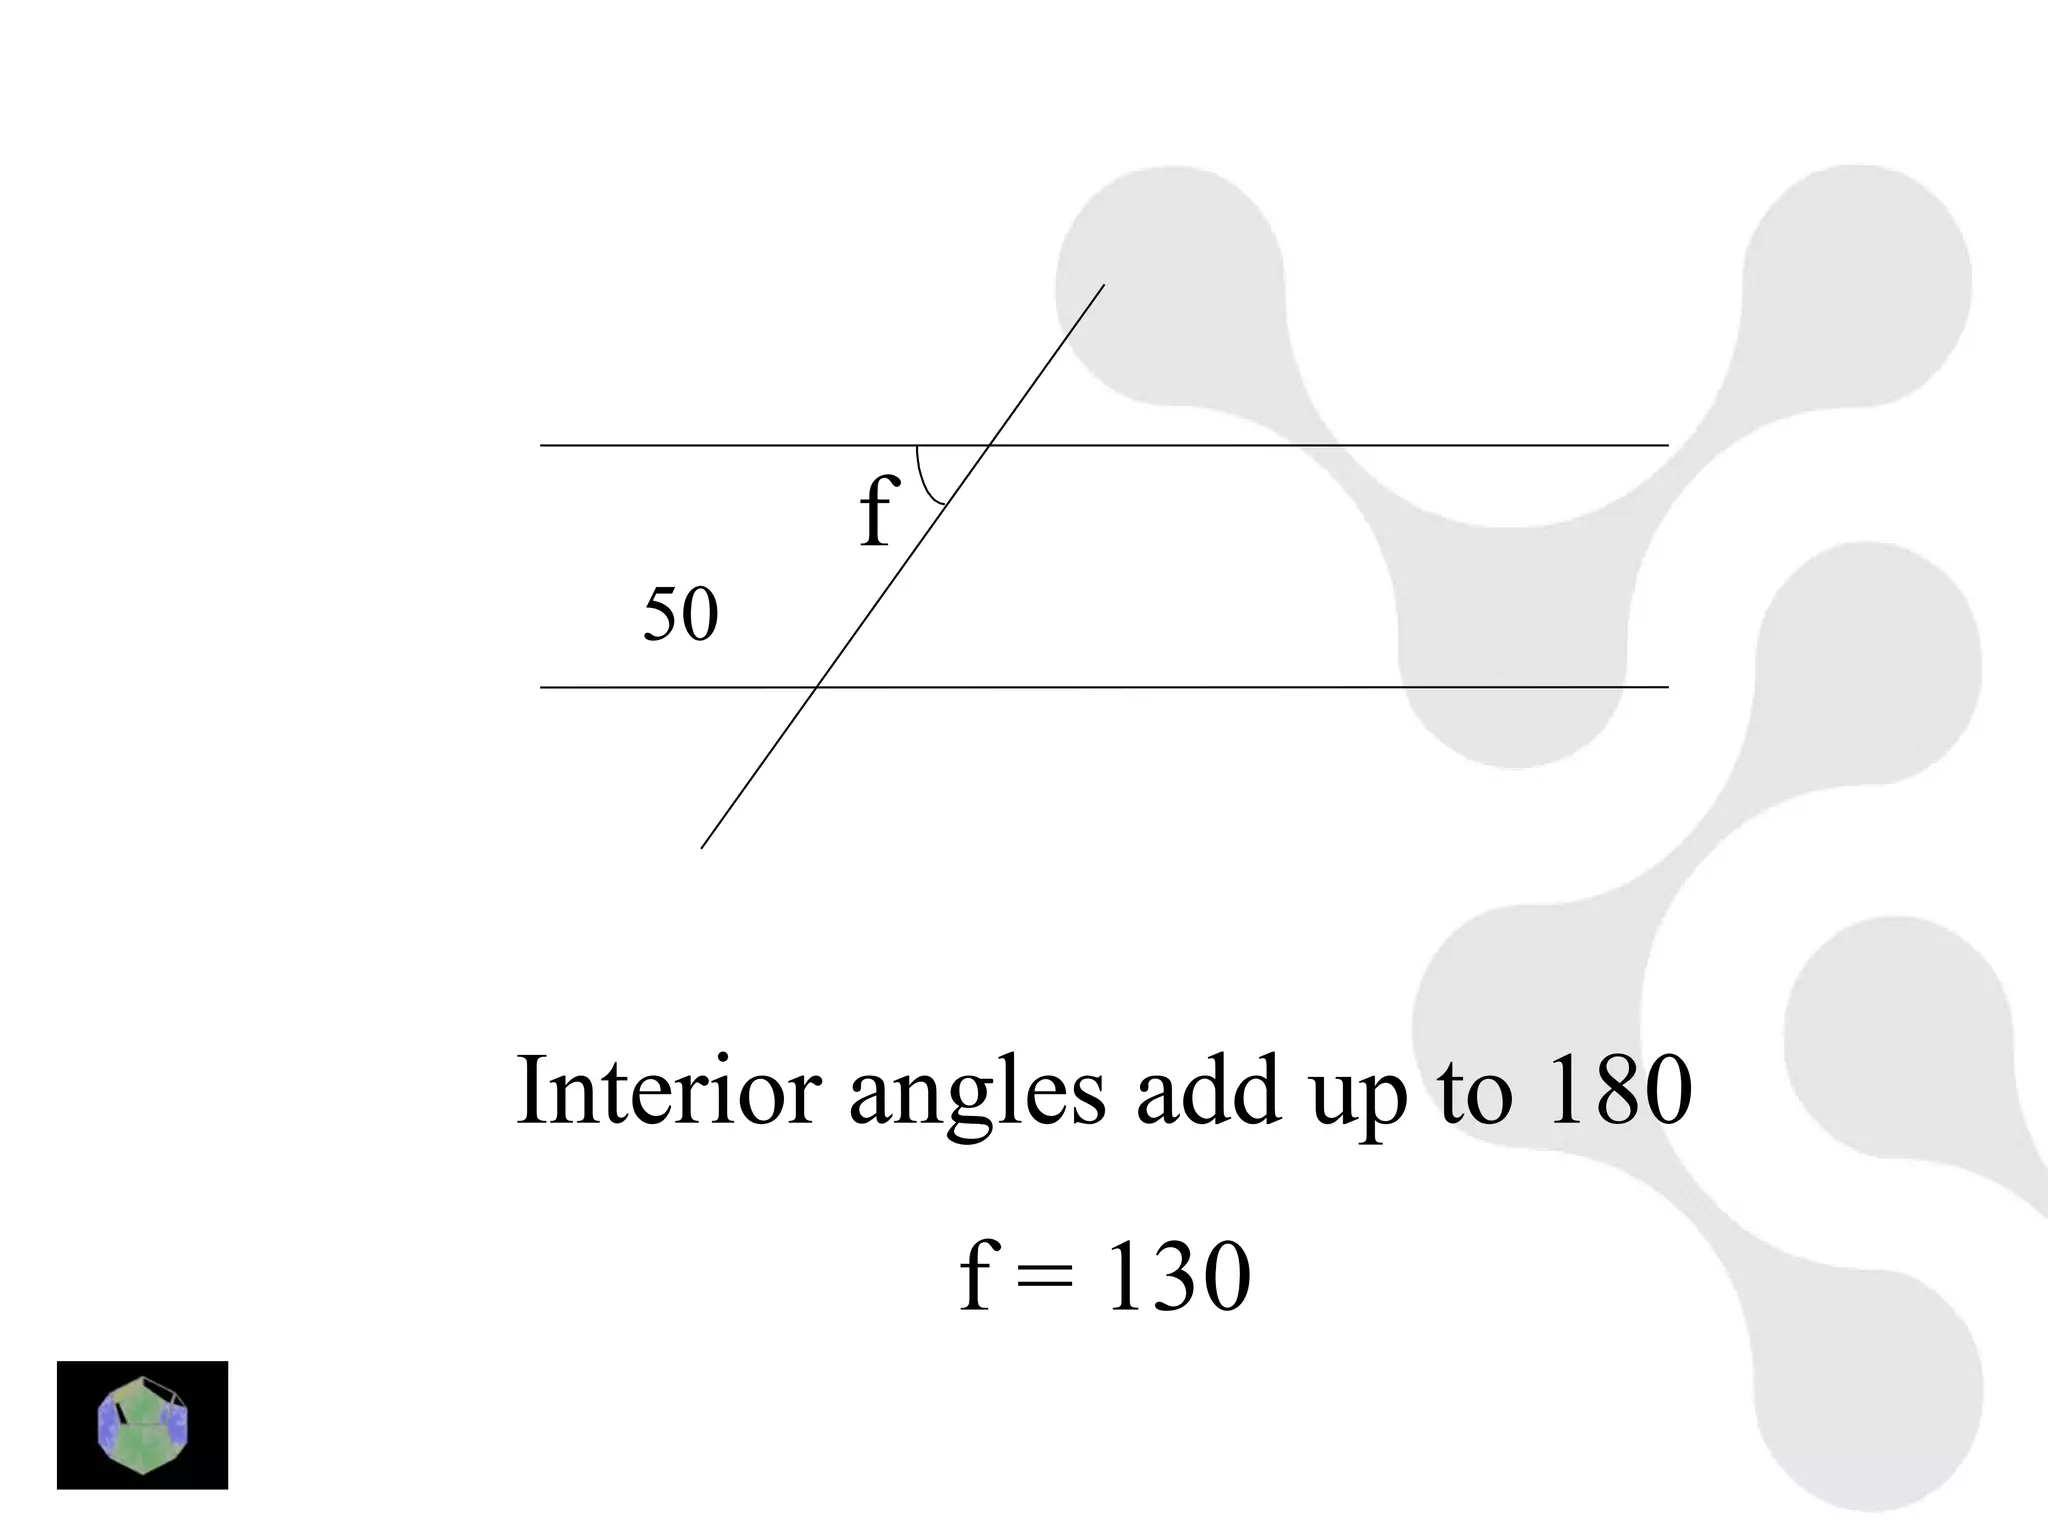
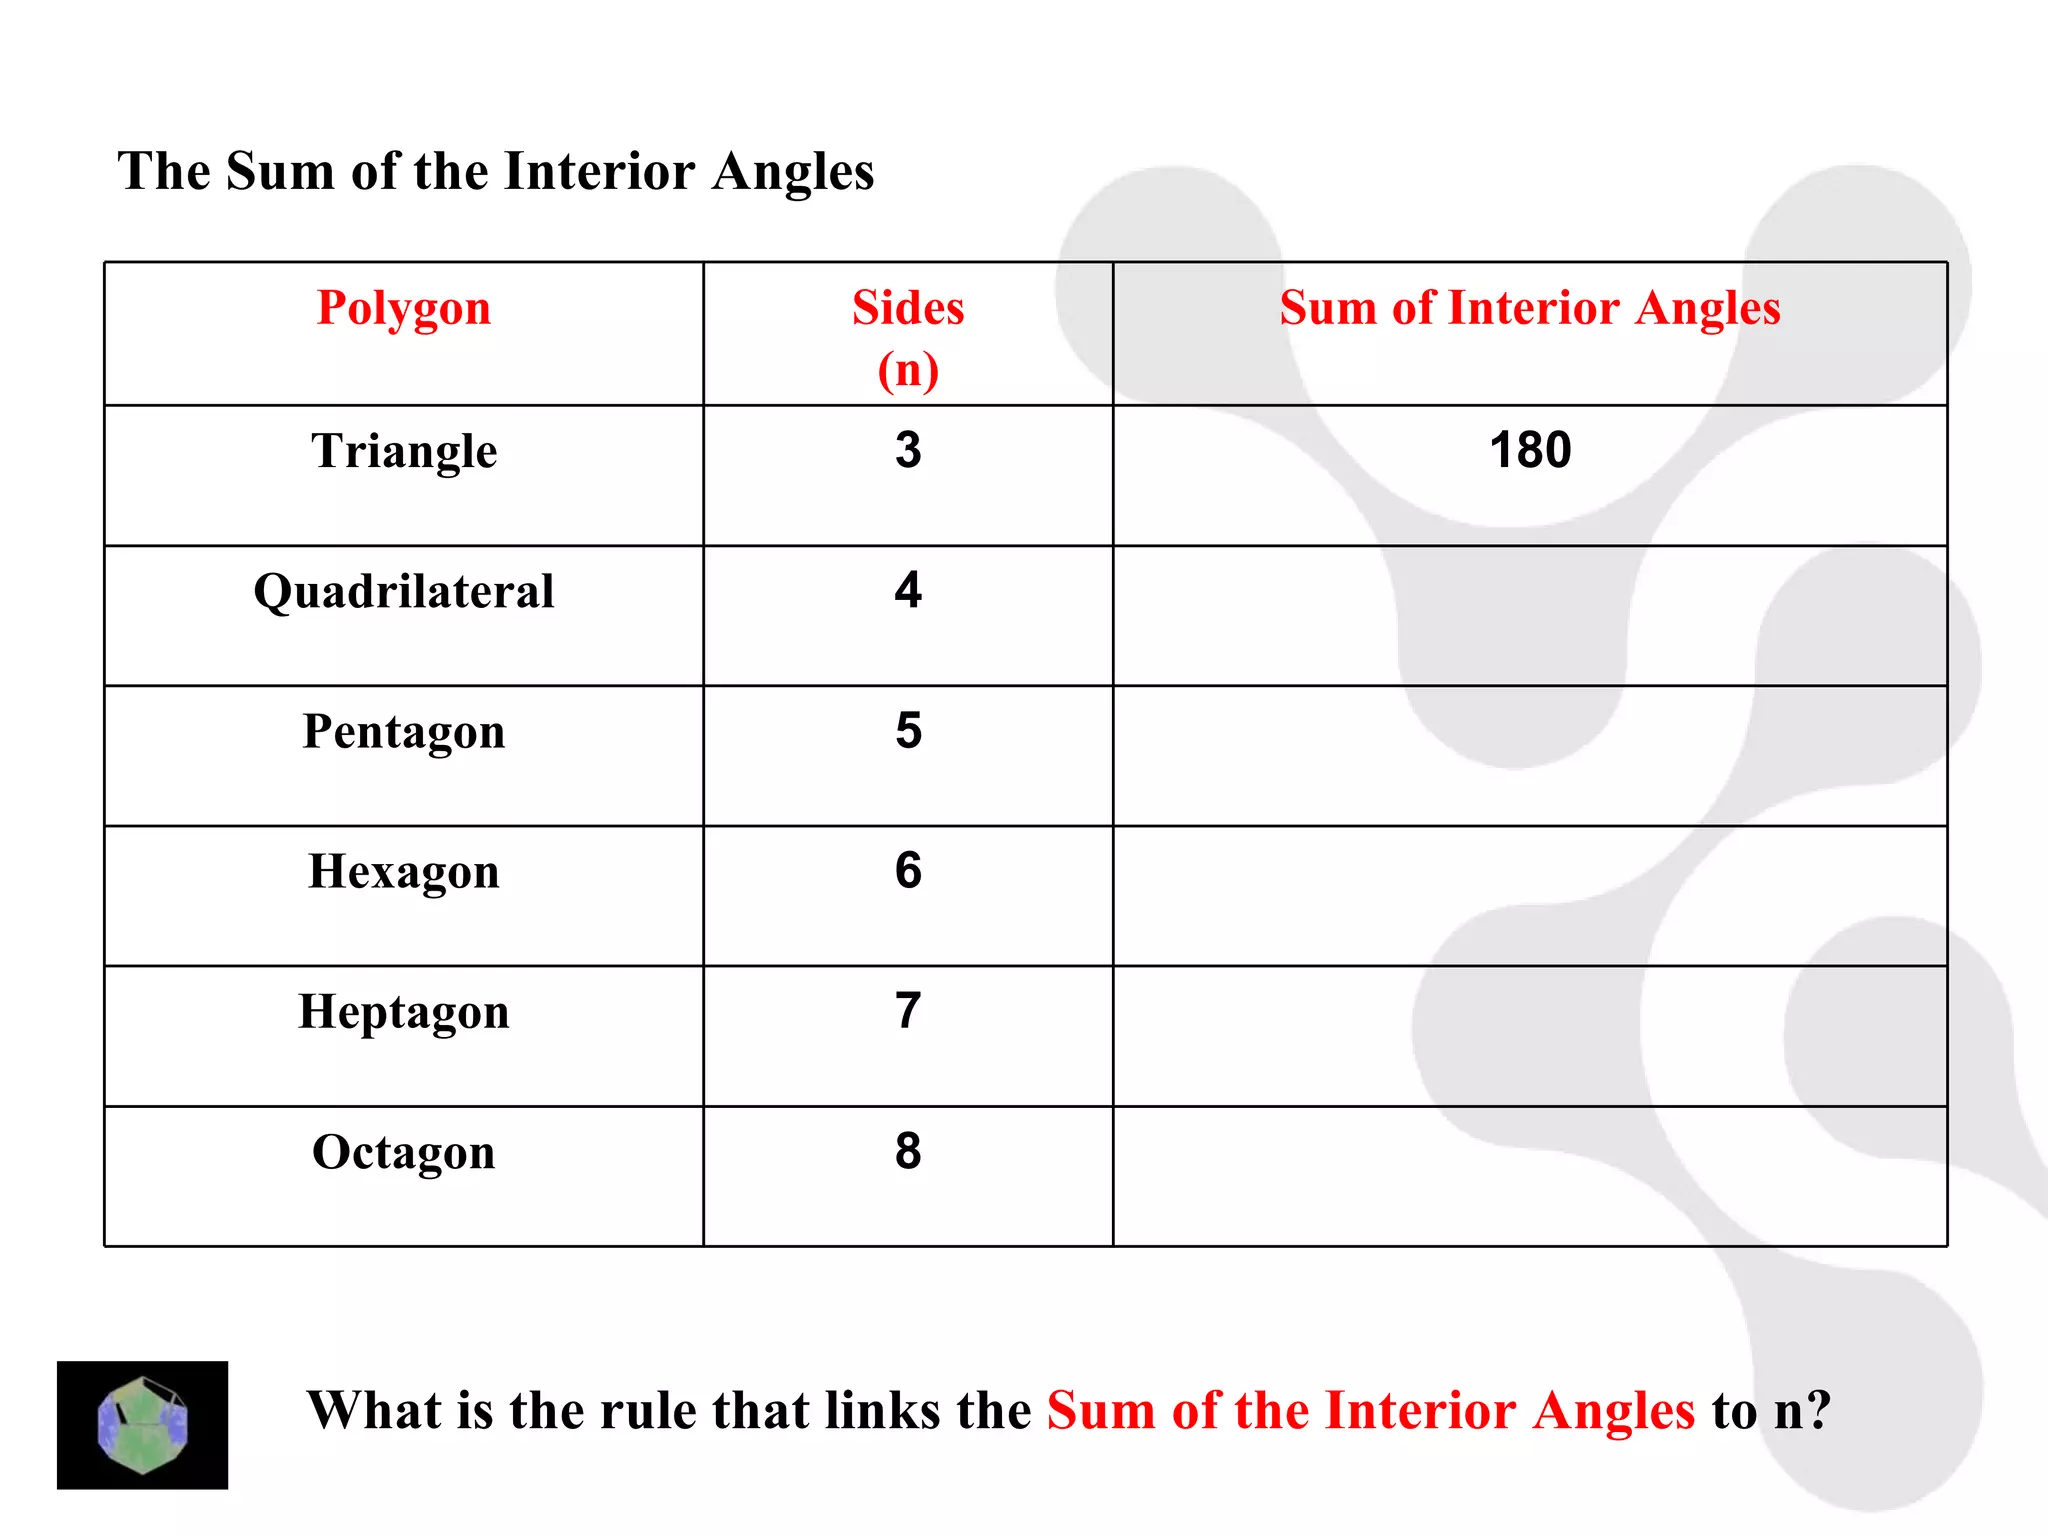
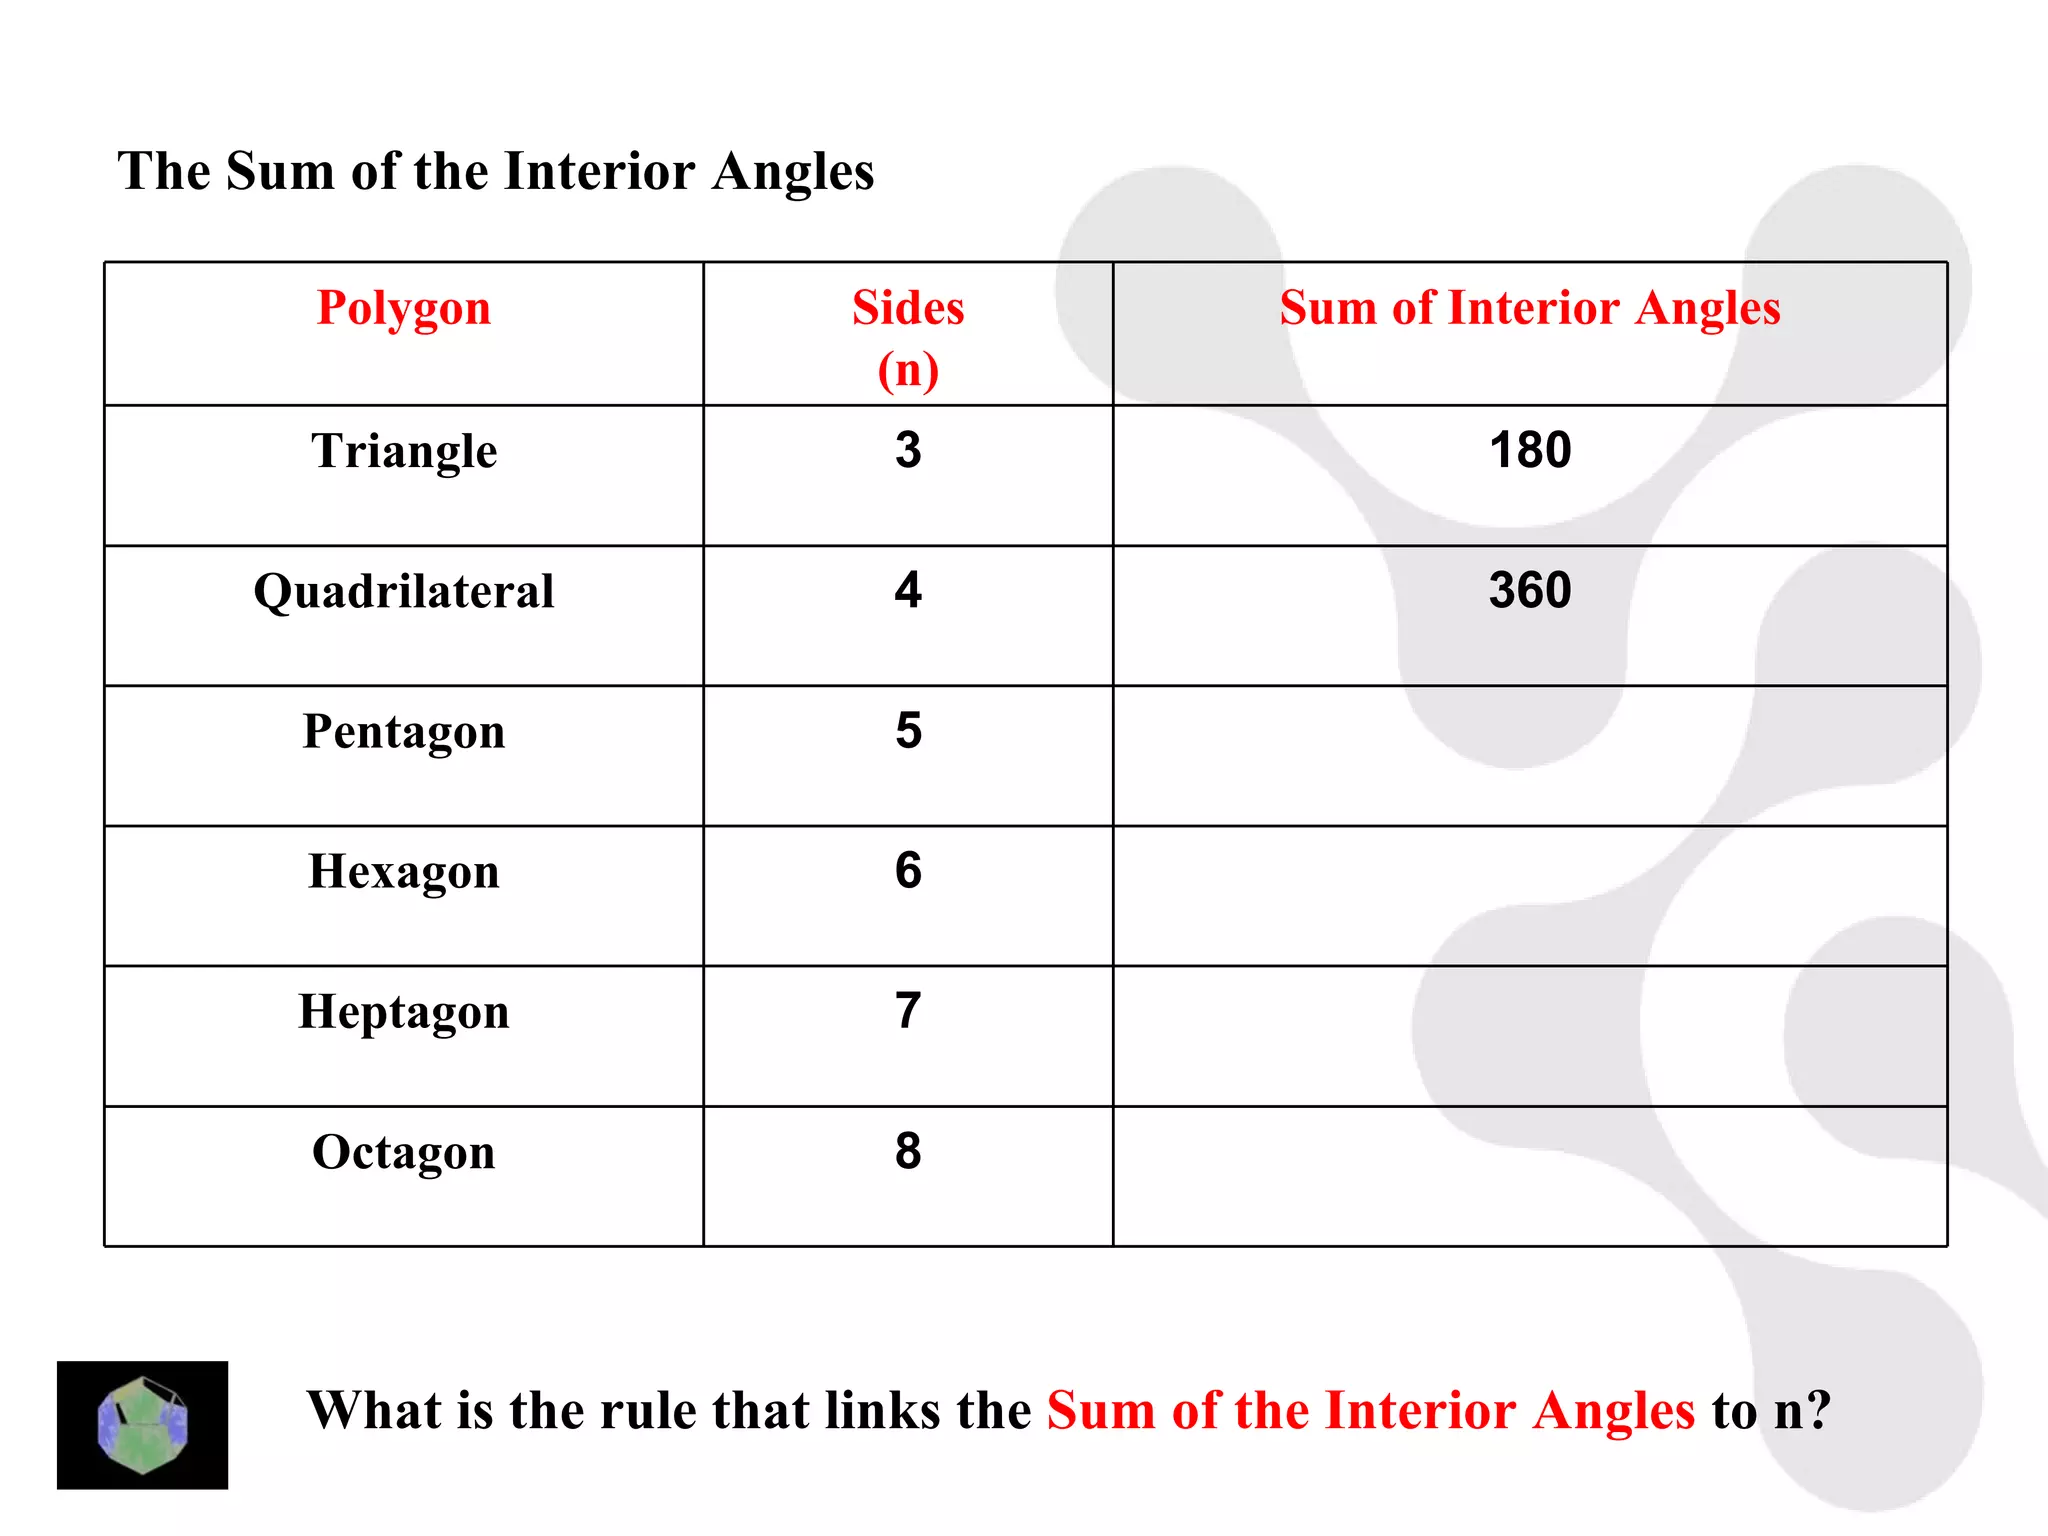
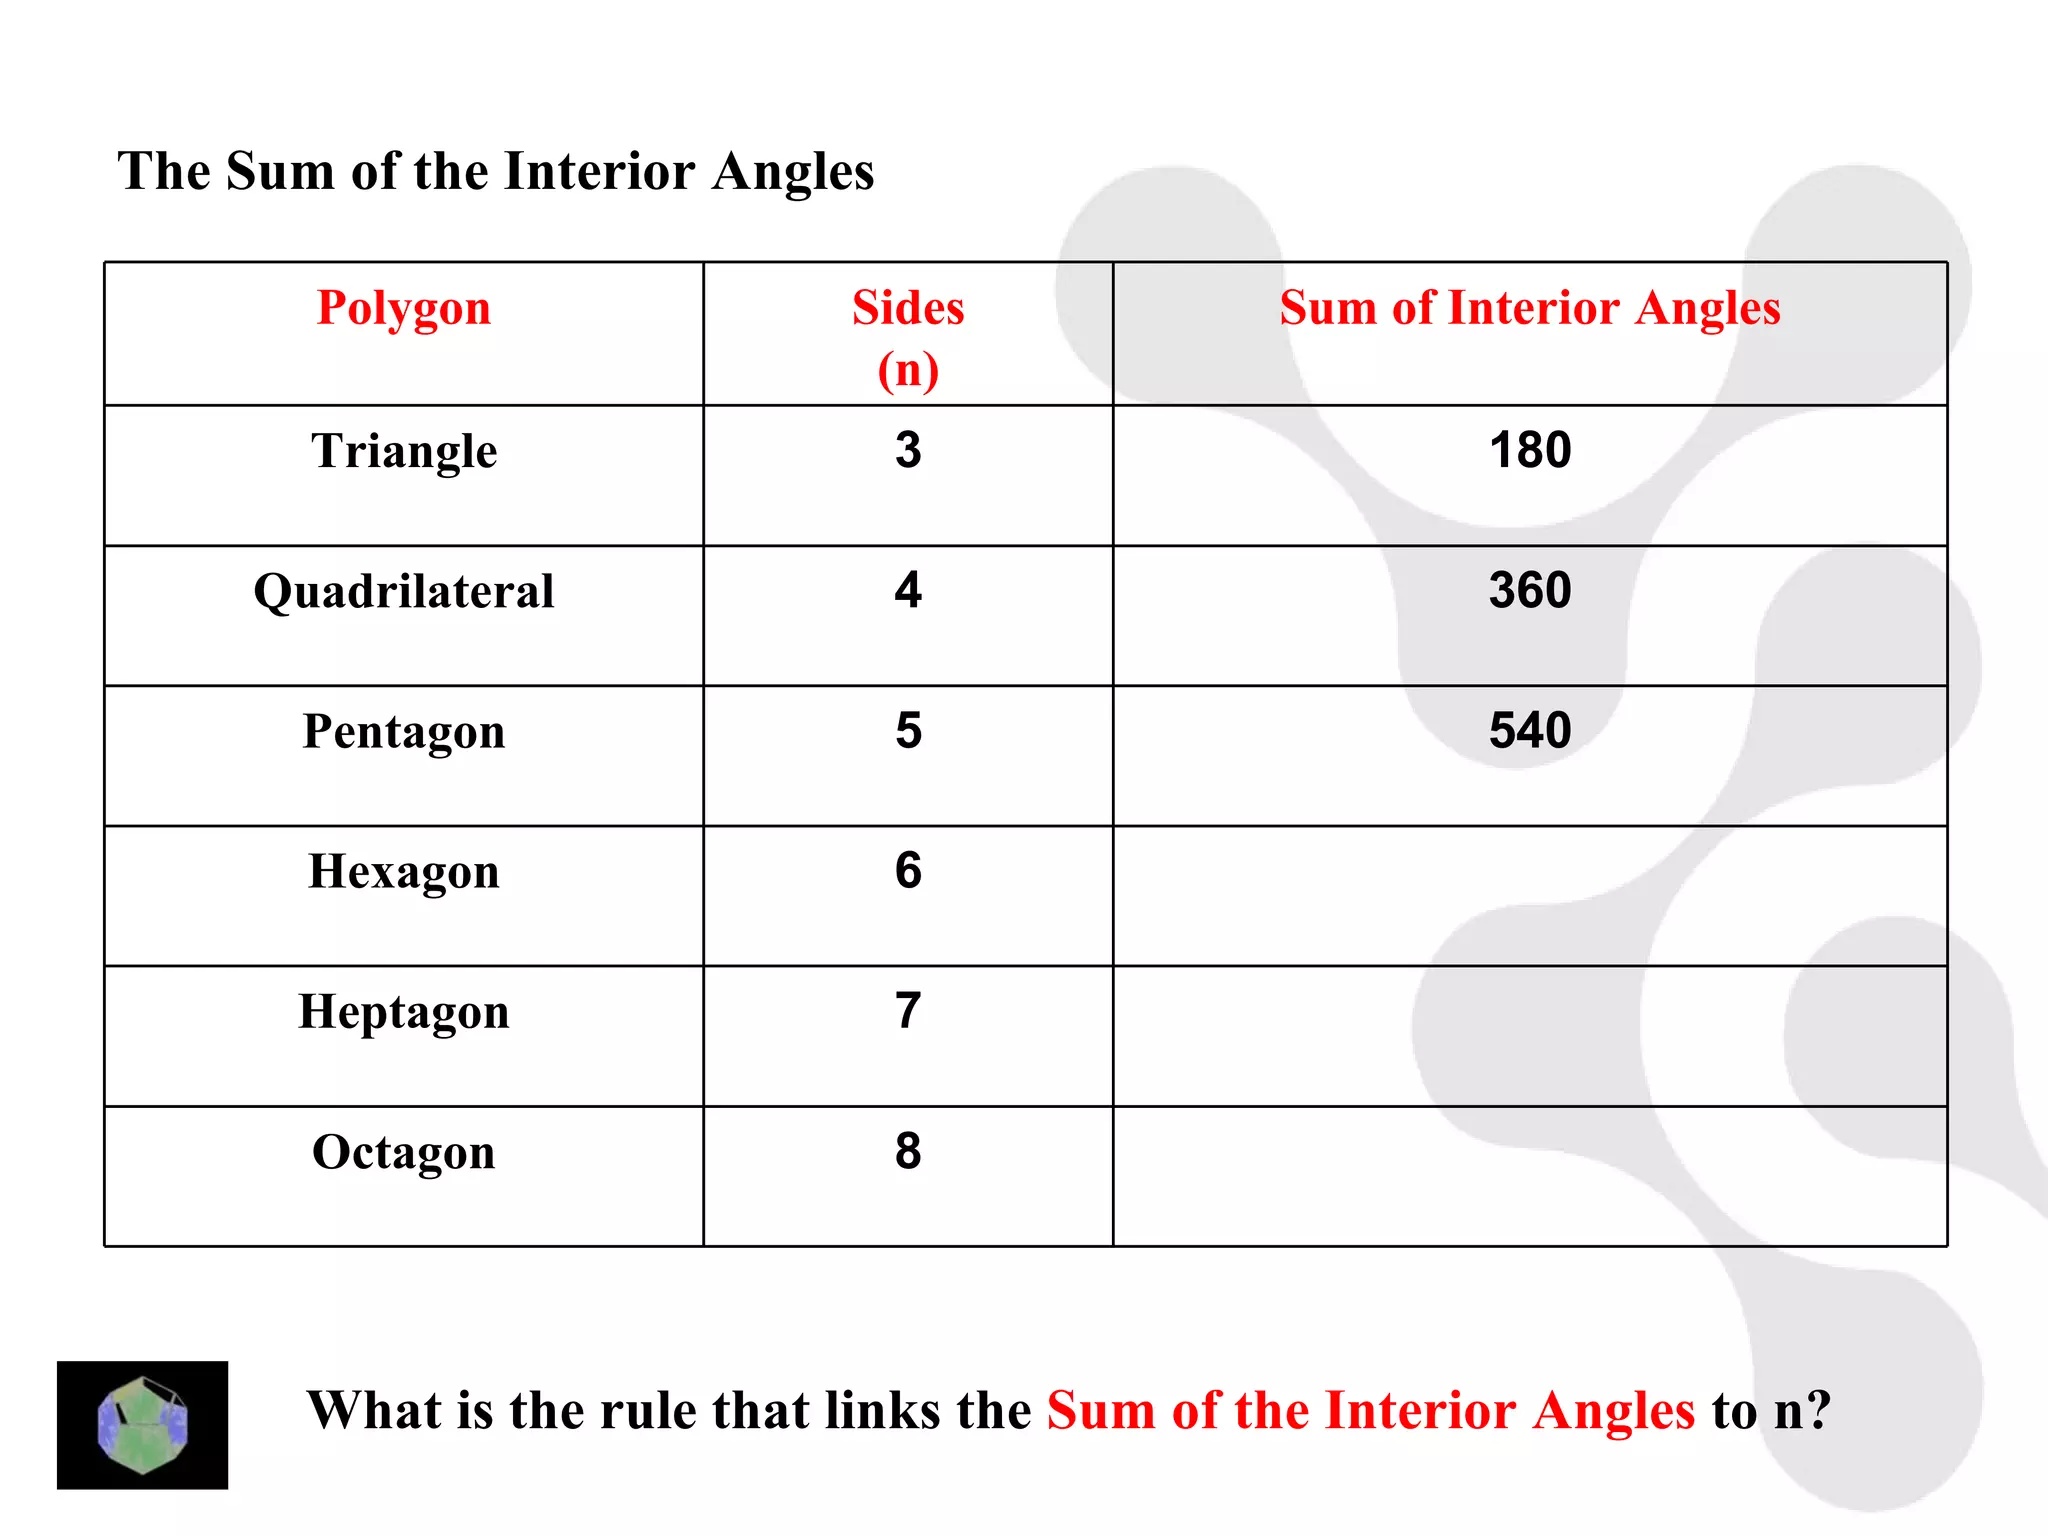
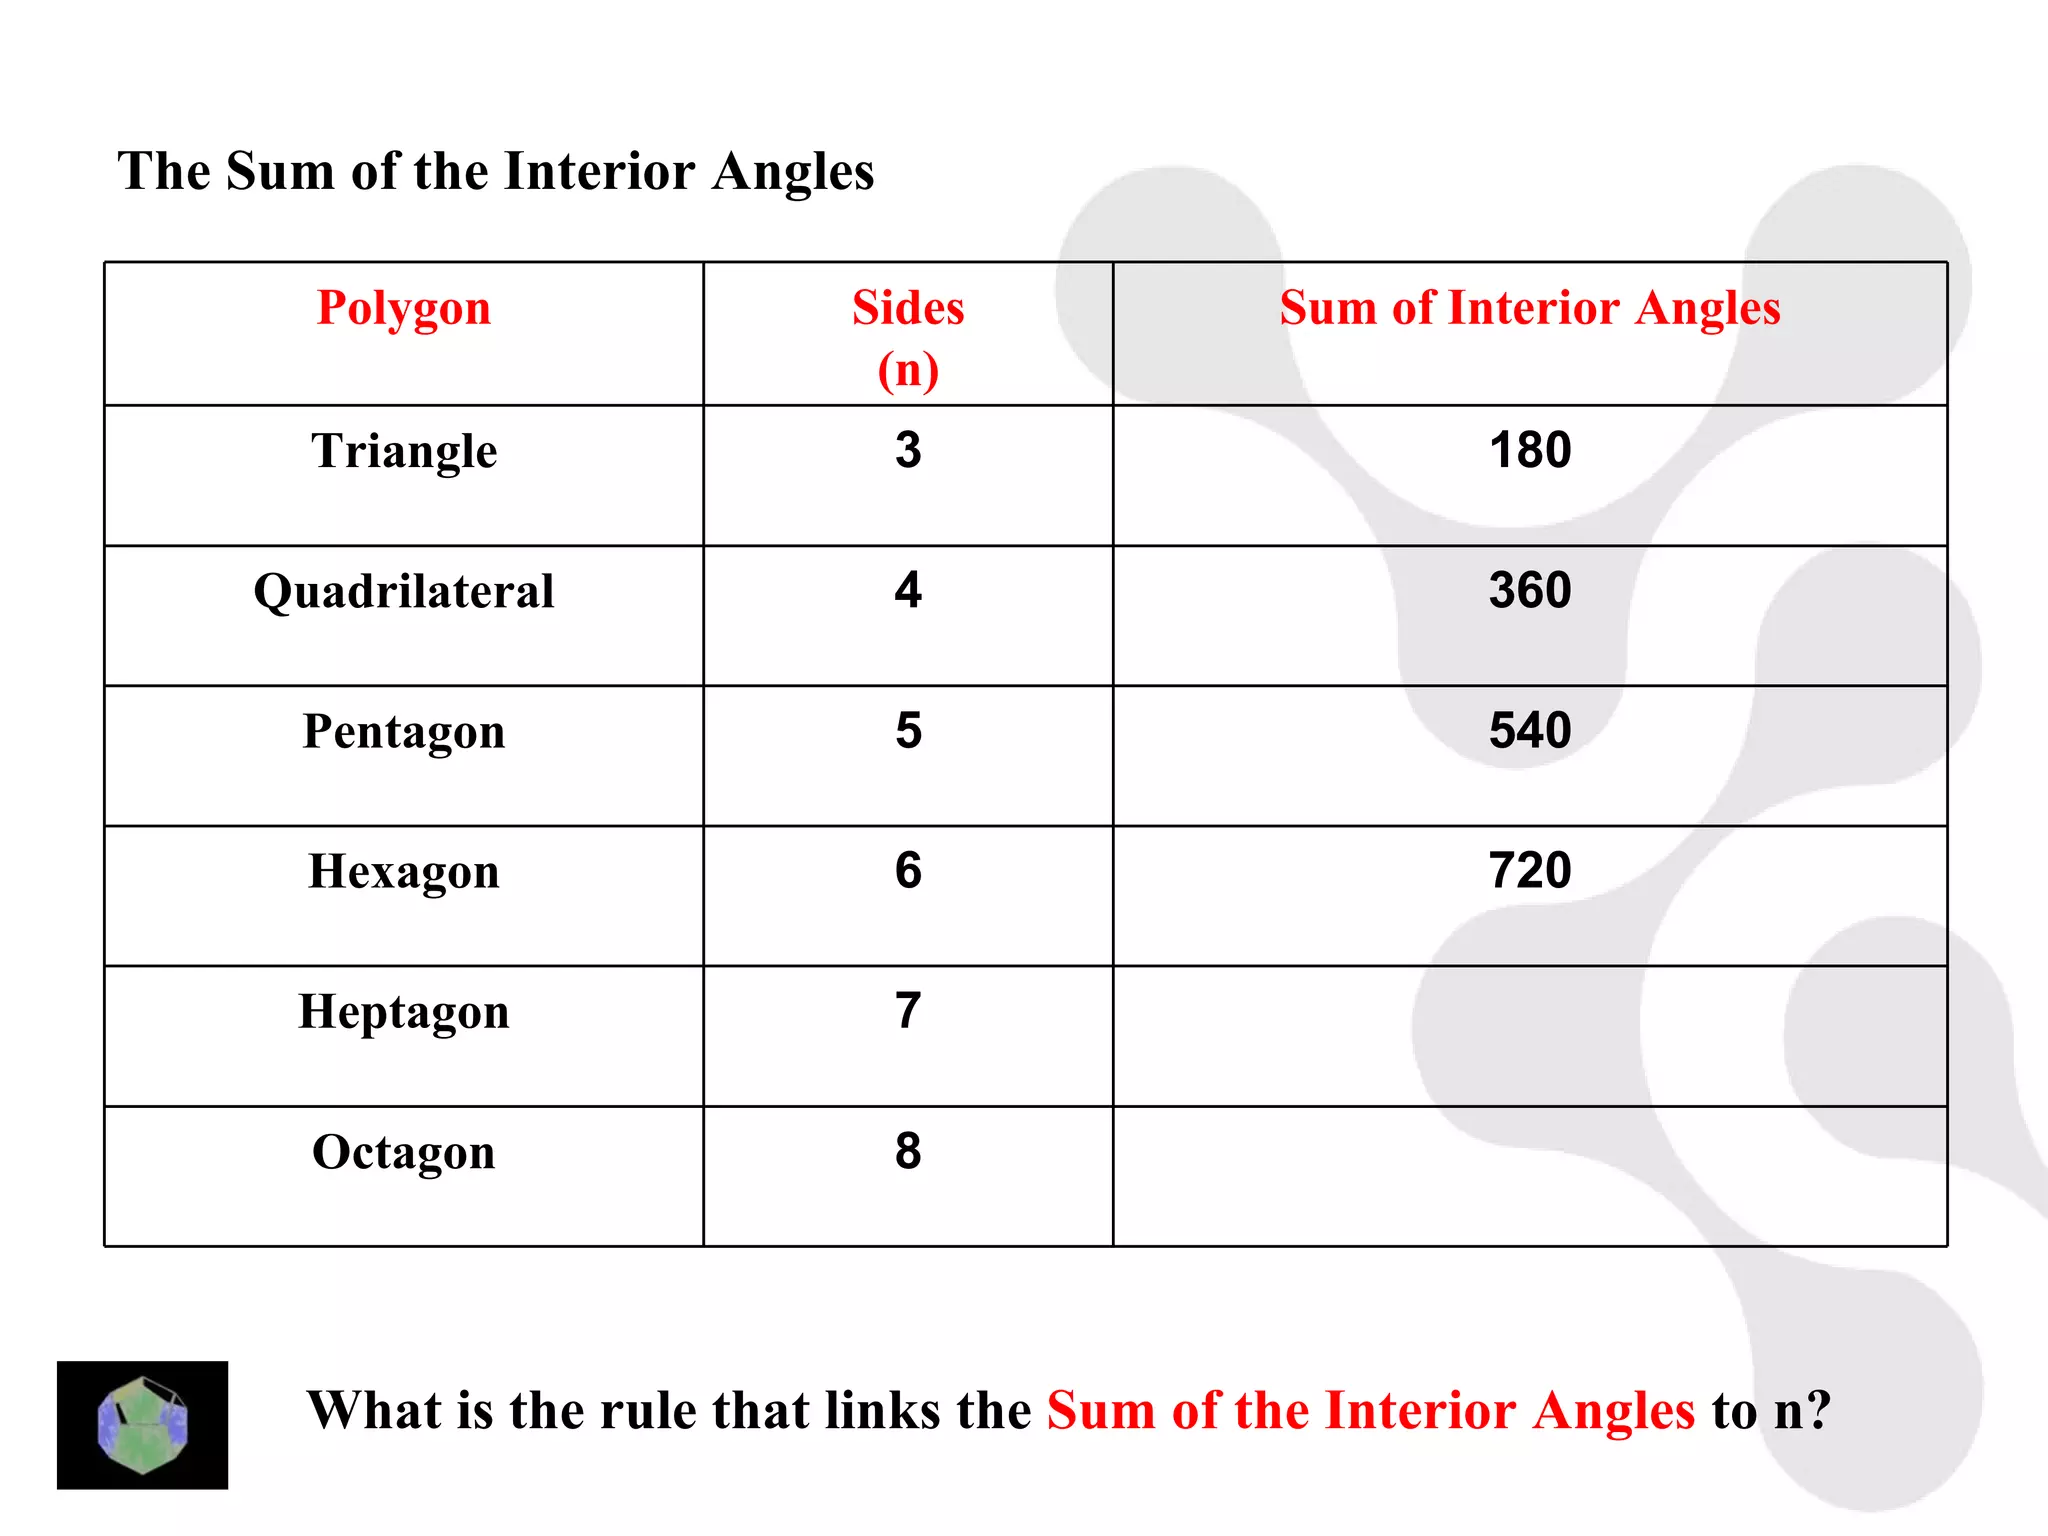
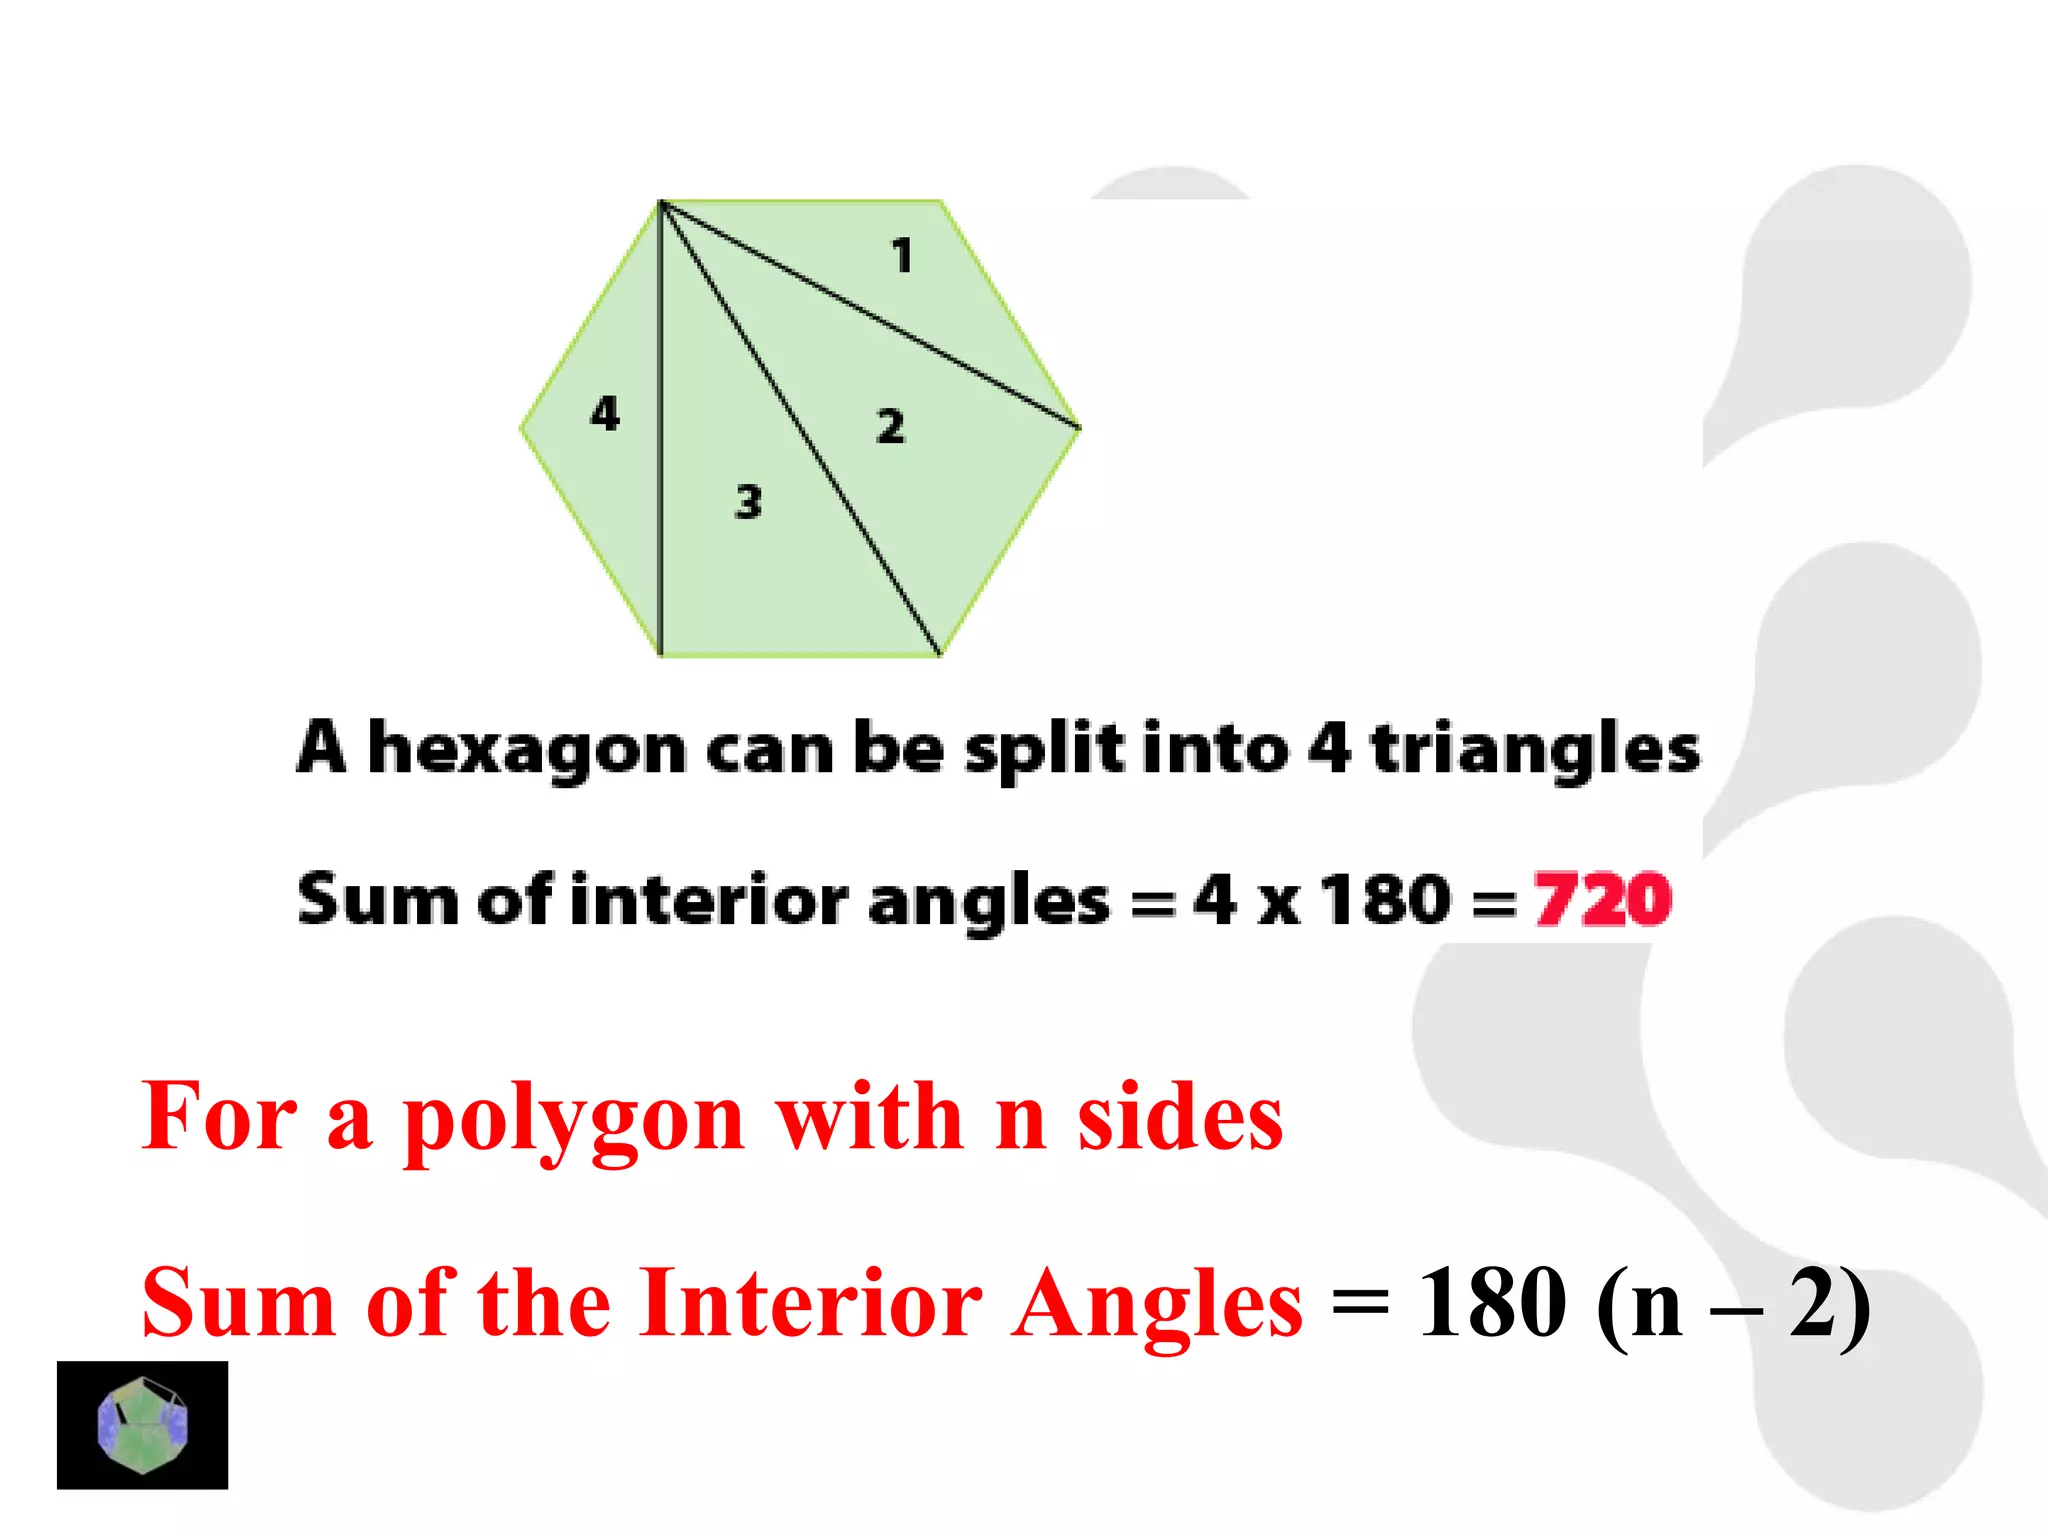
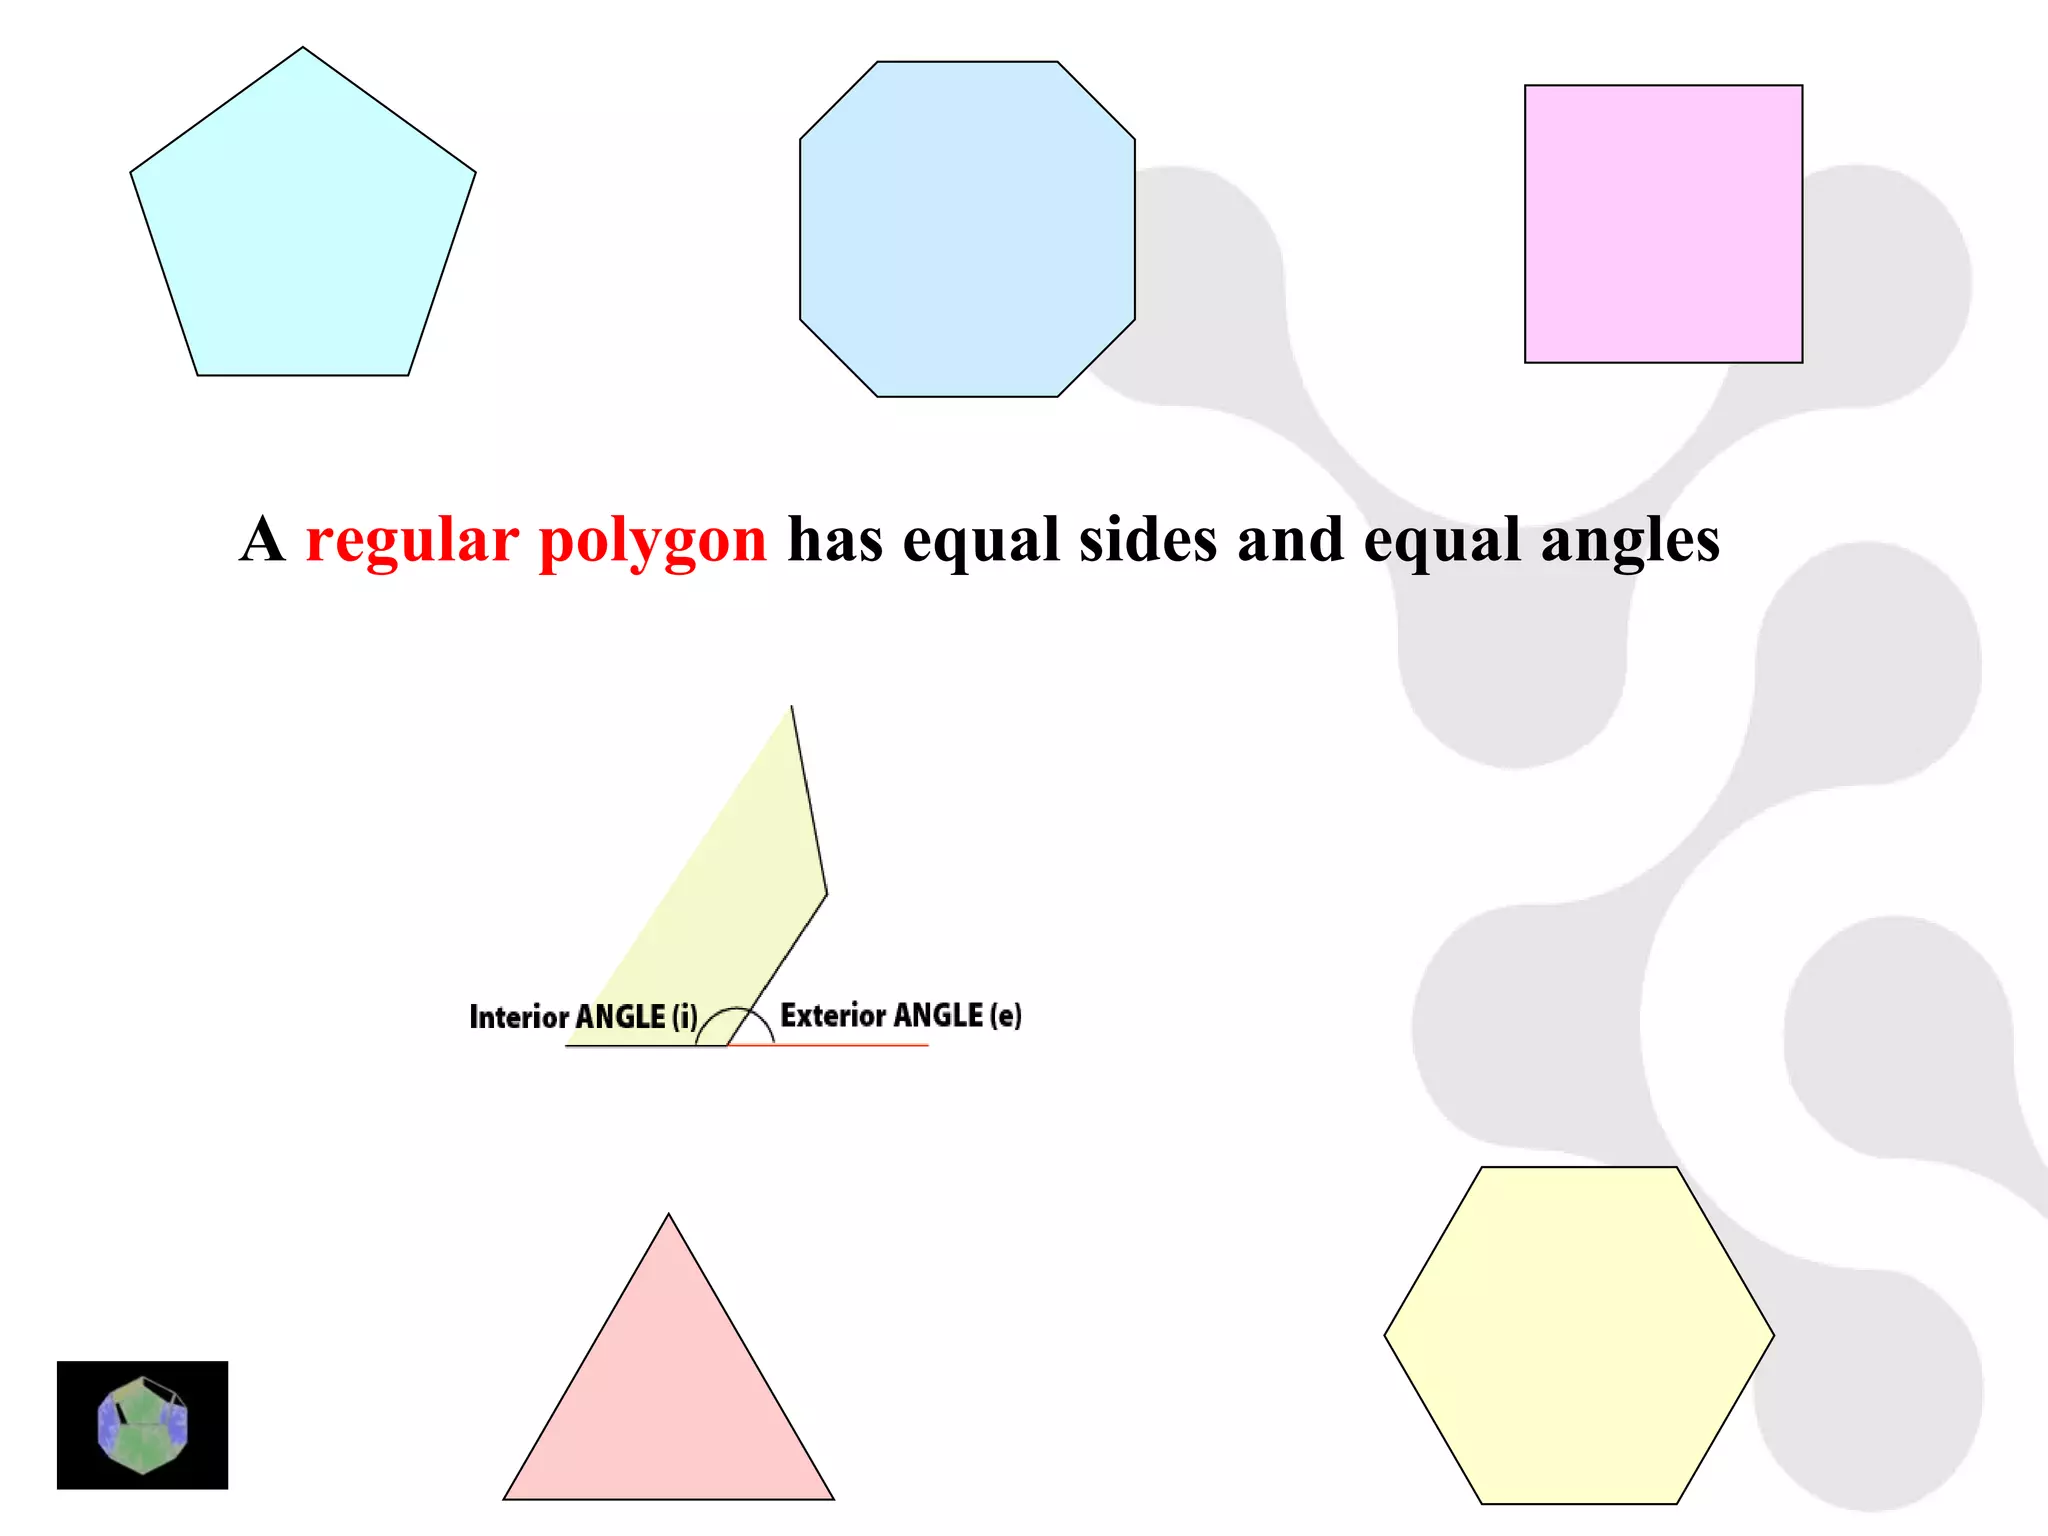
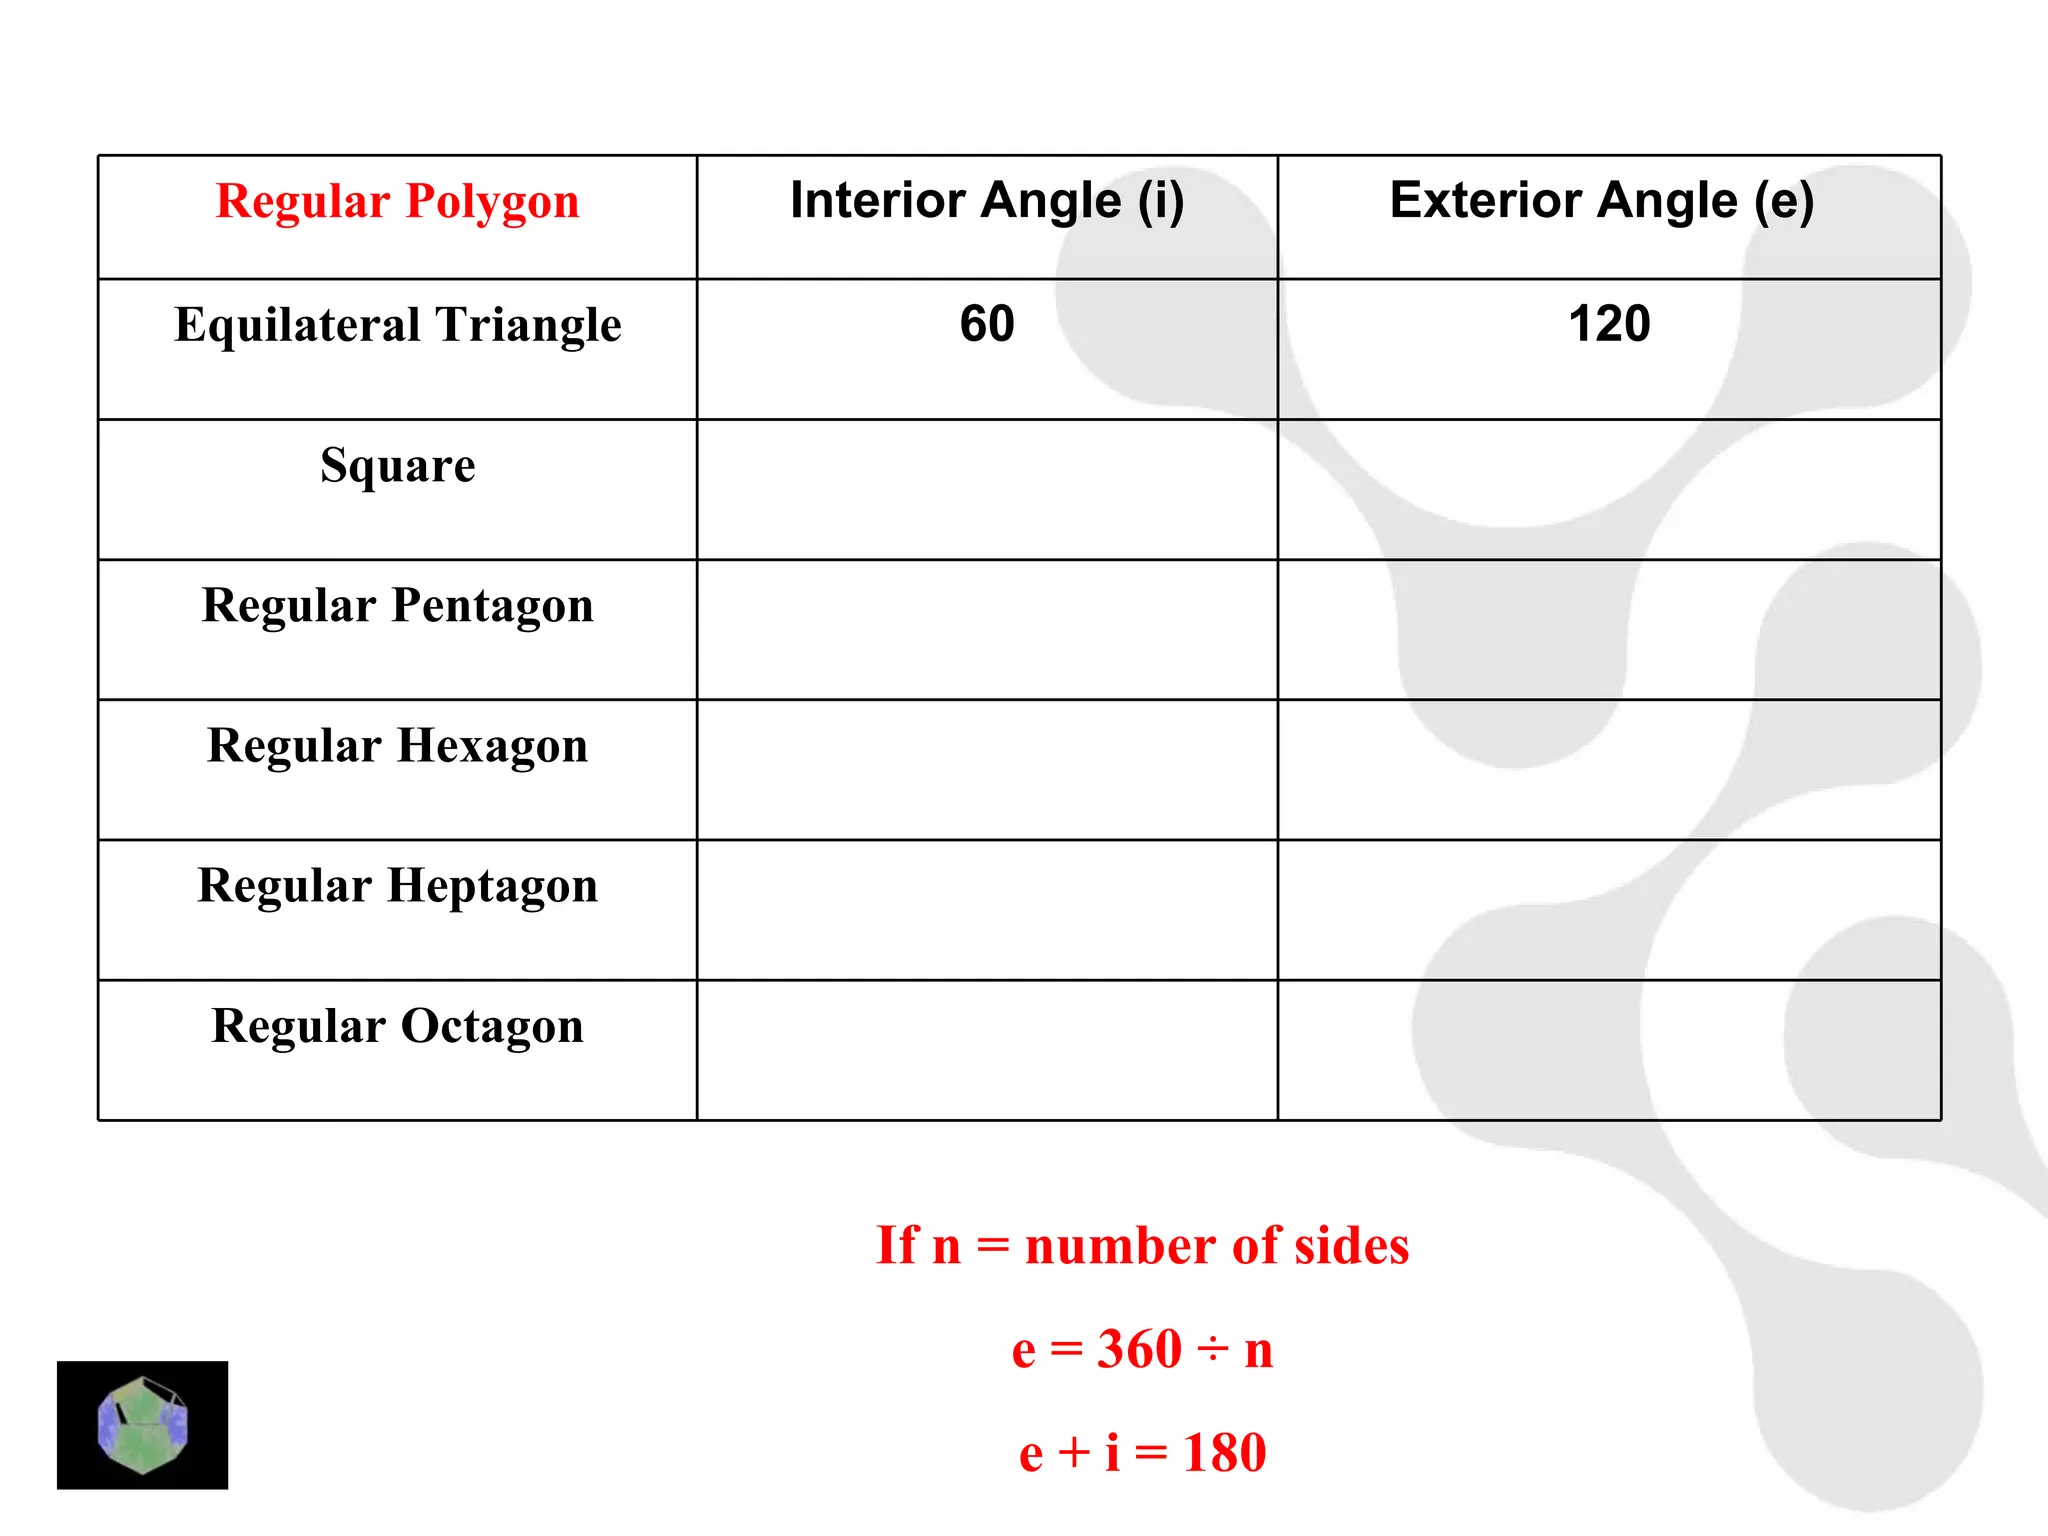
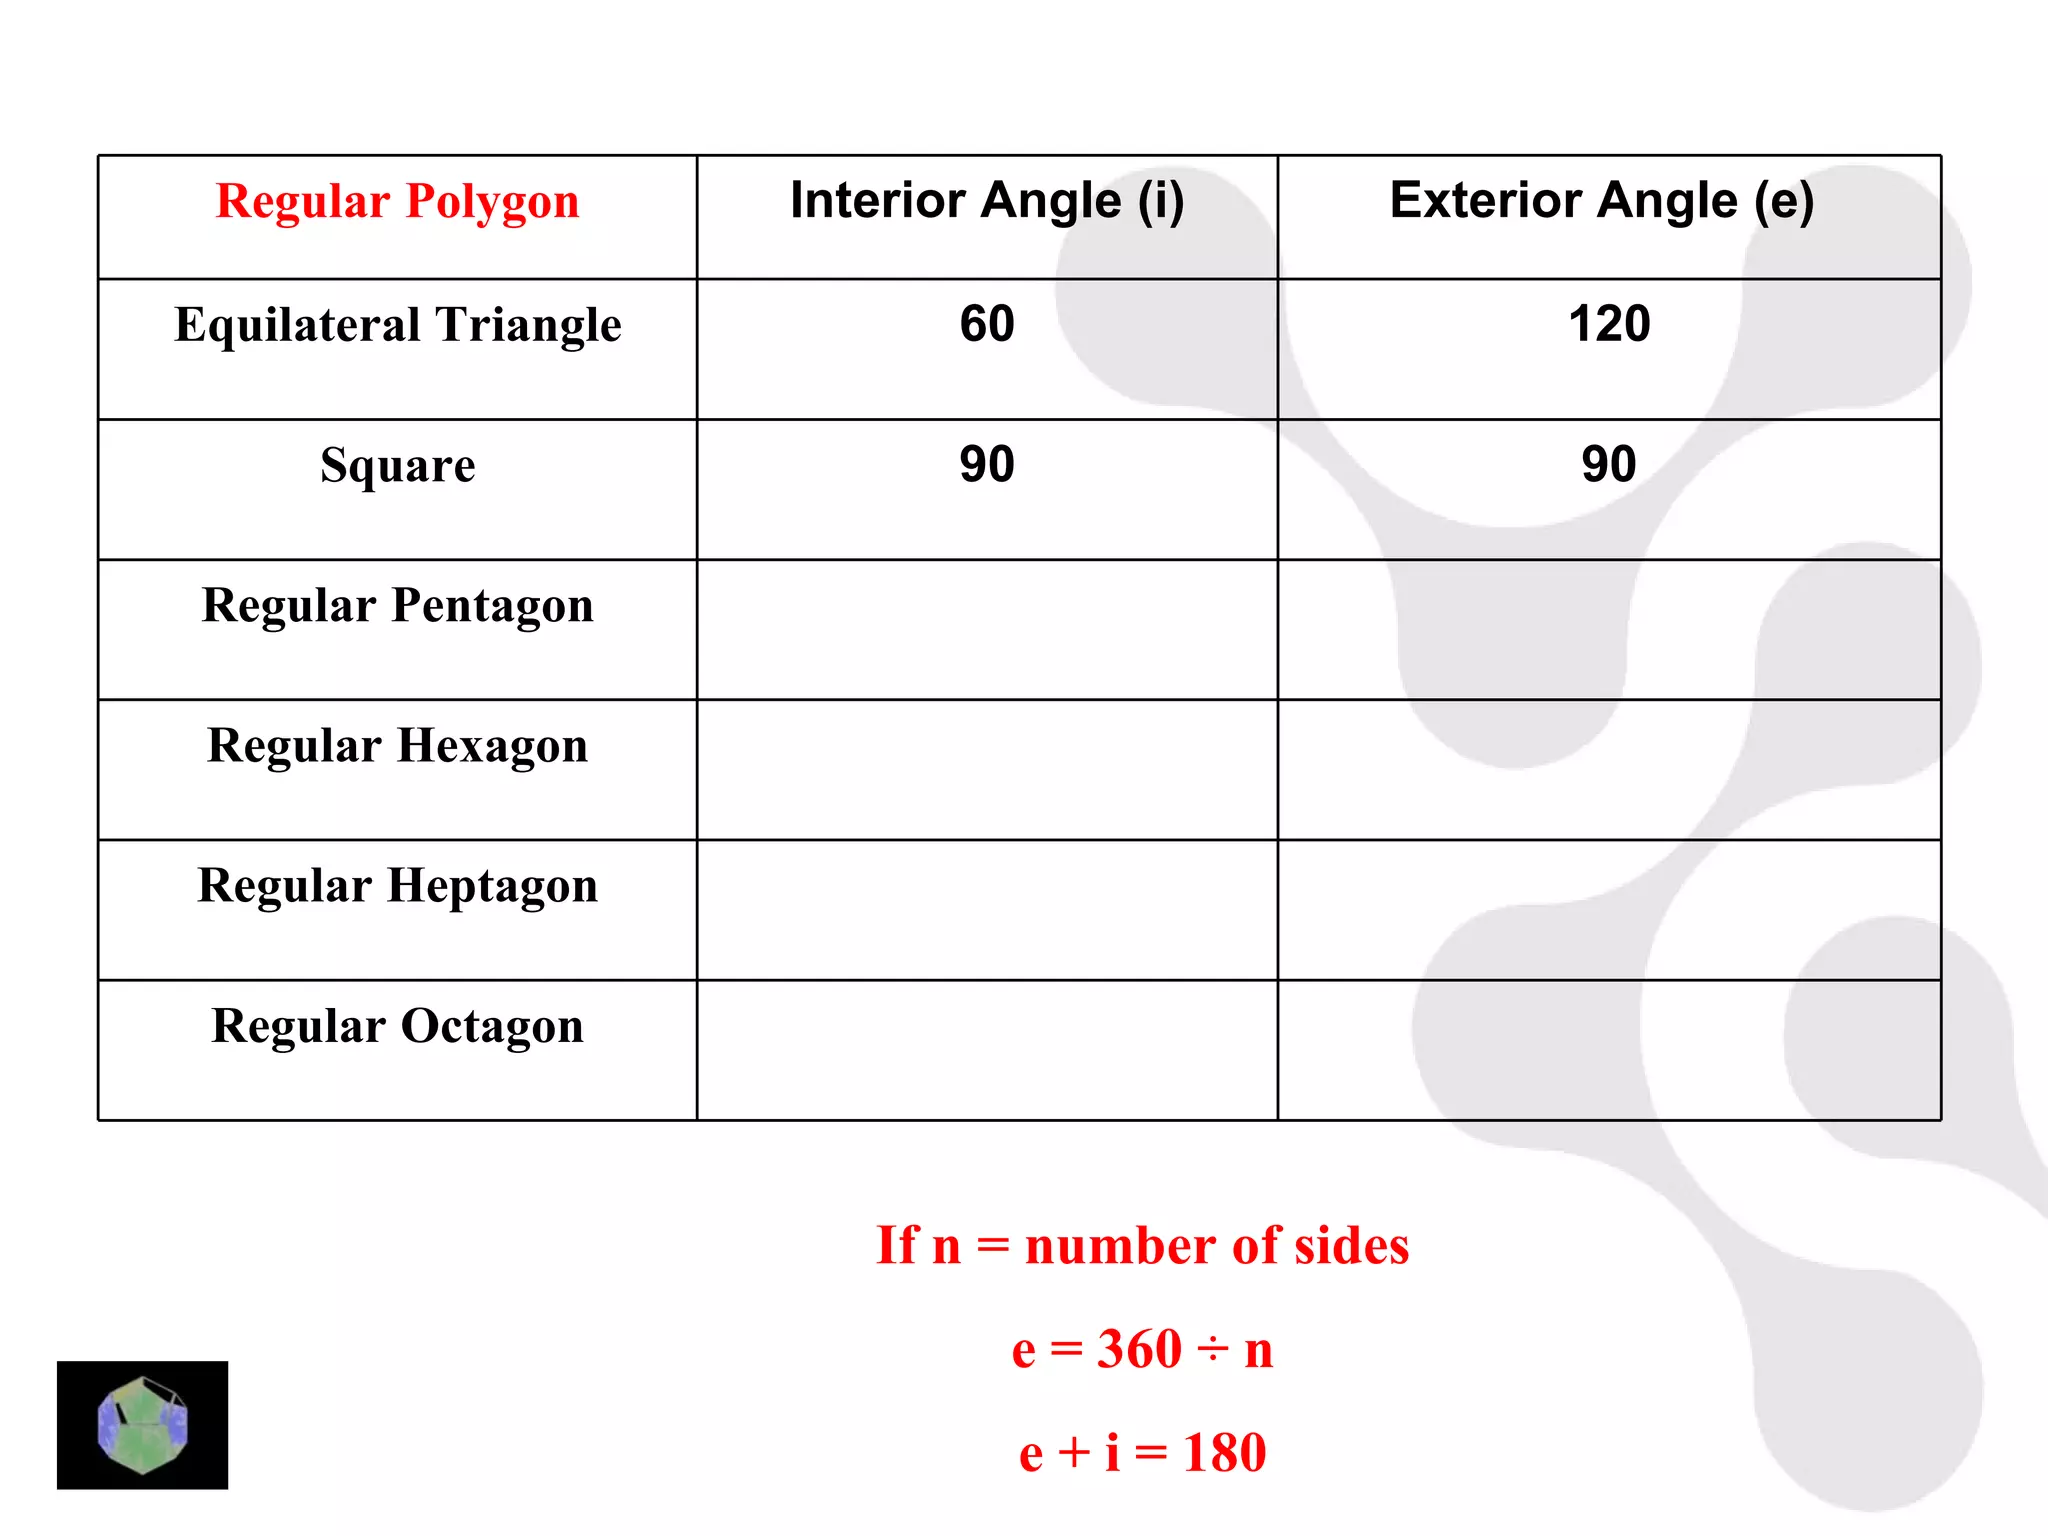
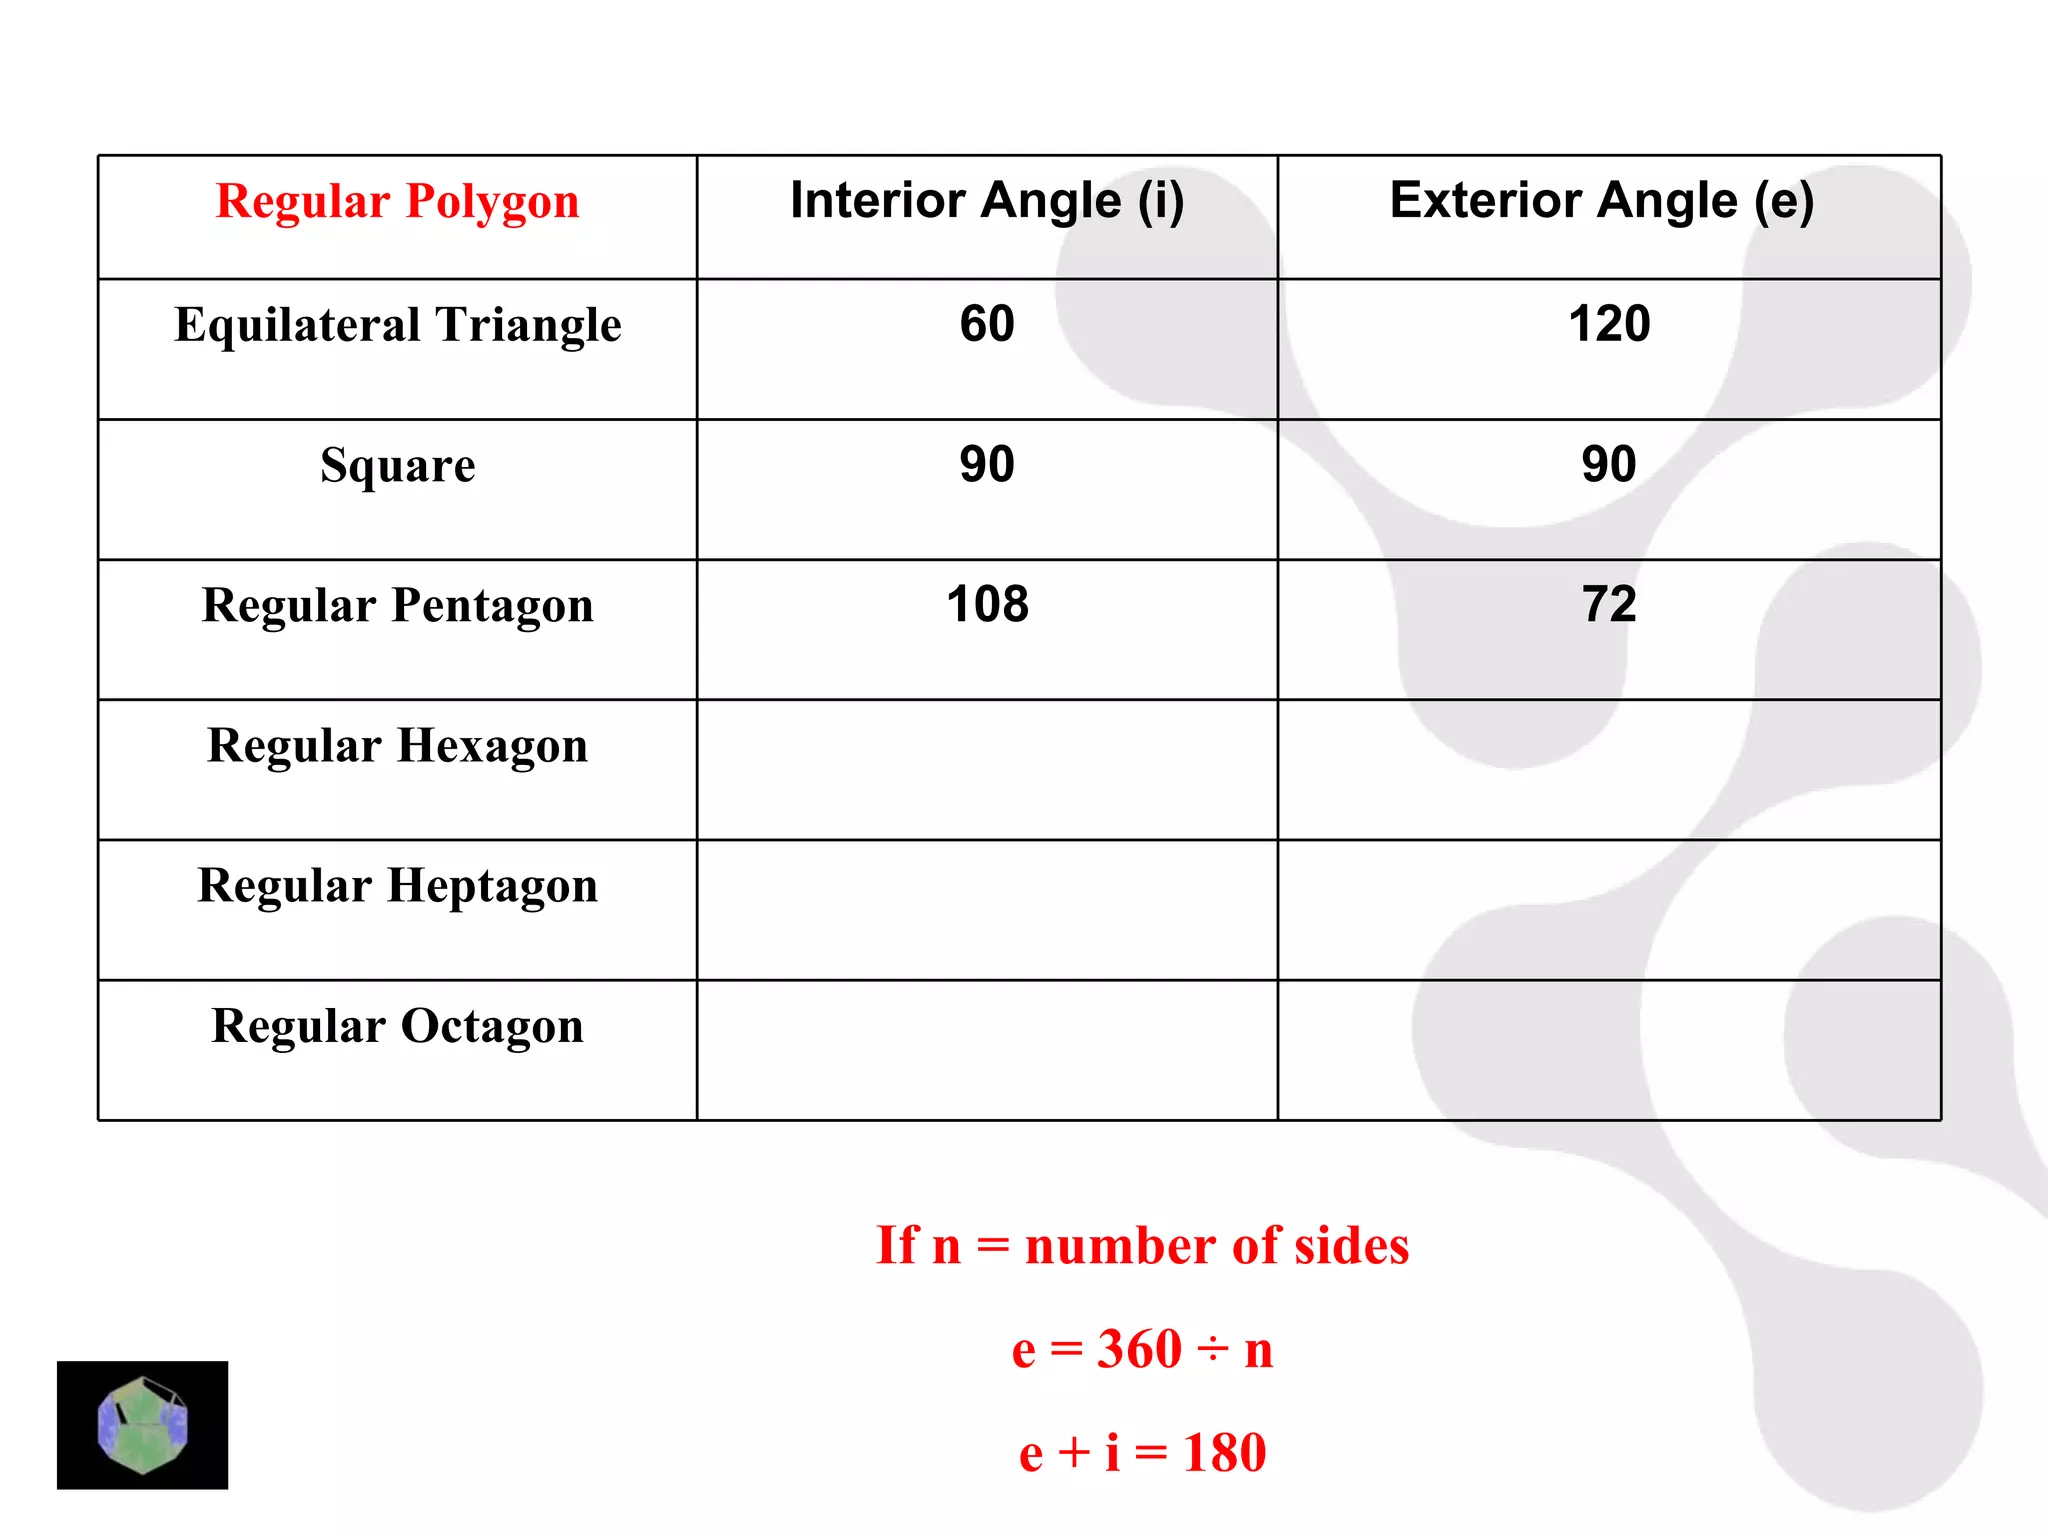
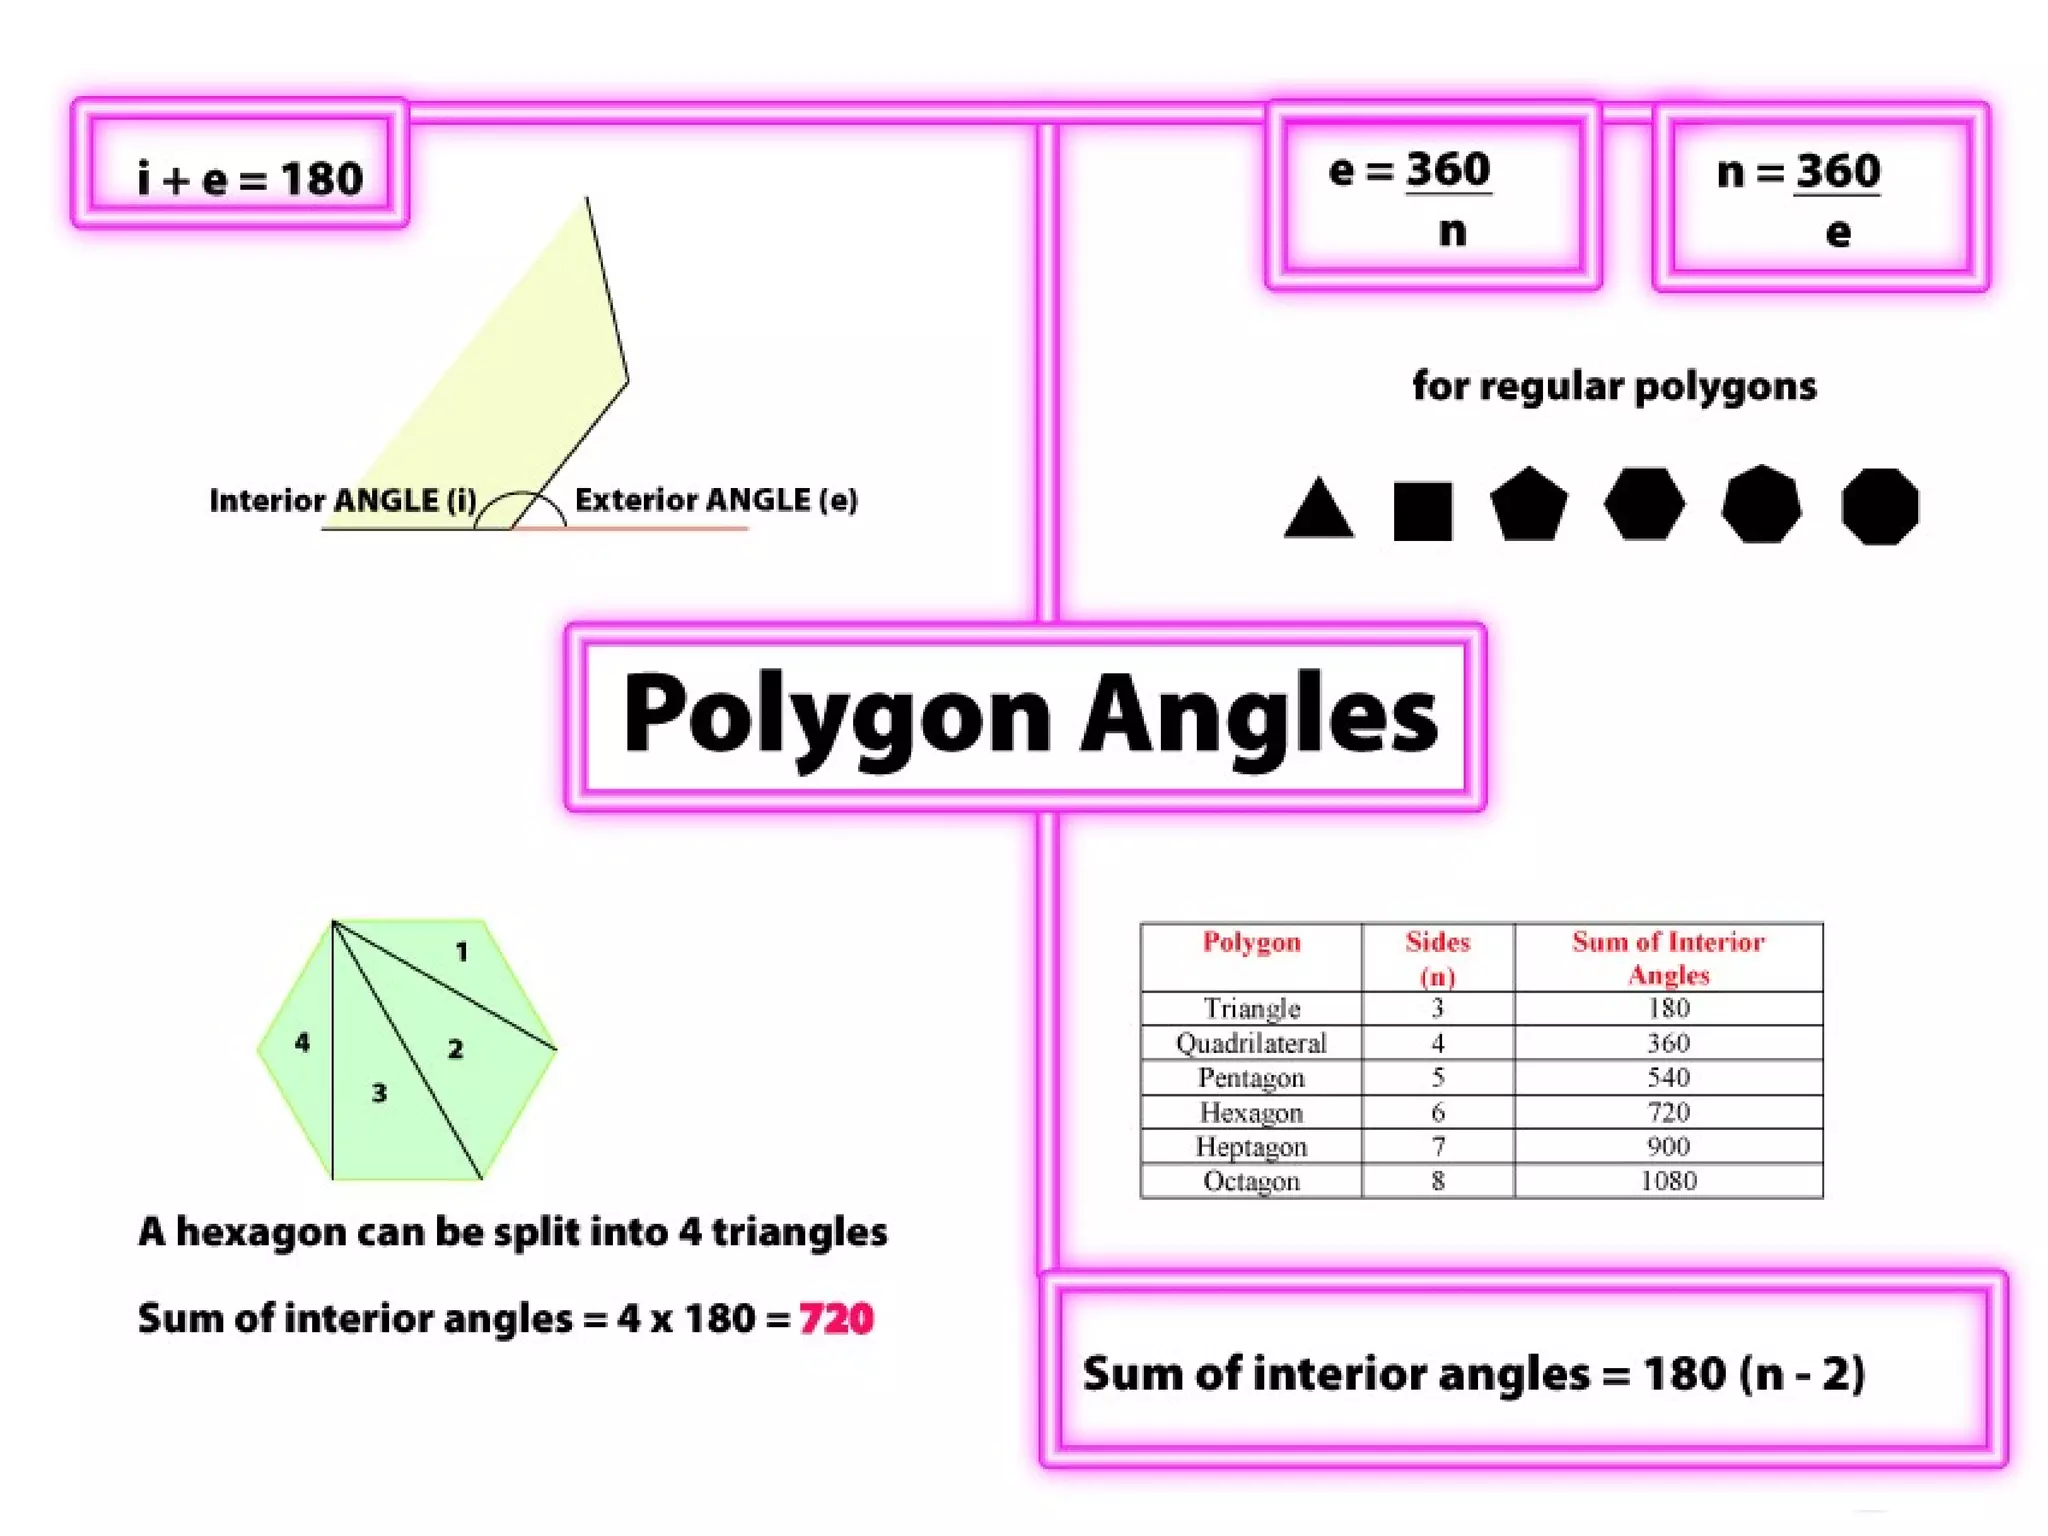
3) Properties of polygons are summarized, including the rule that the sum of the interior angles of an n-sided polygon is 180(n-2).