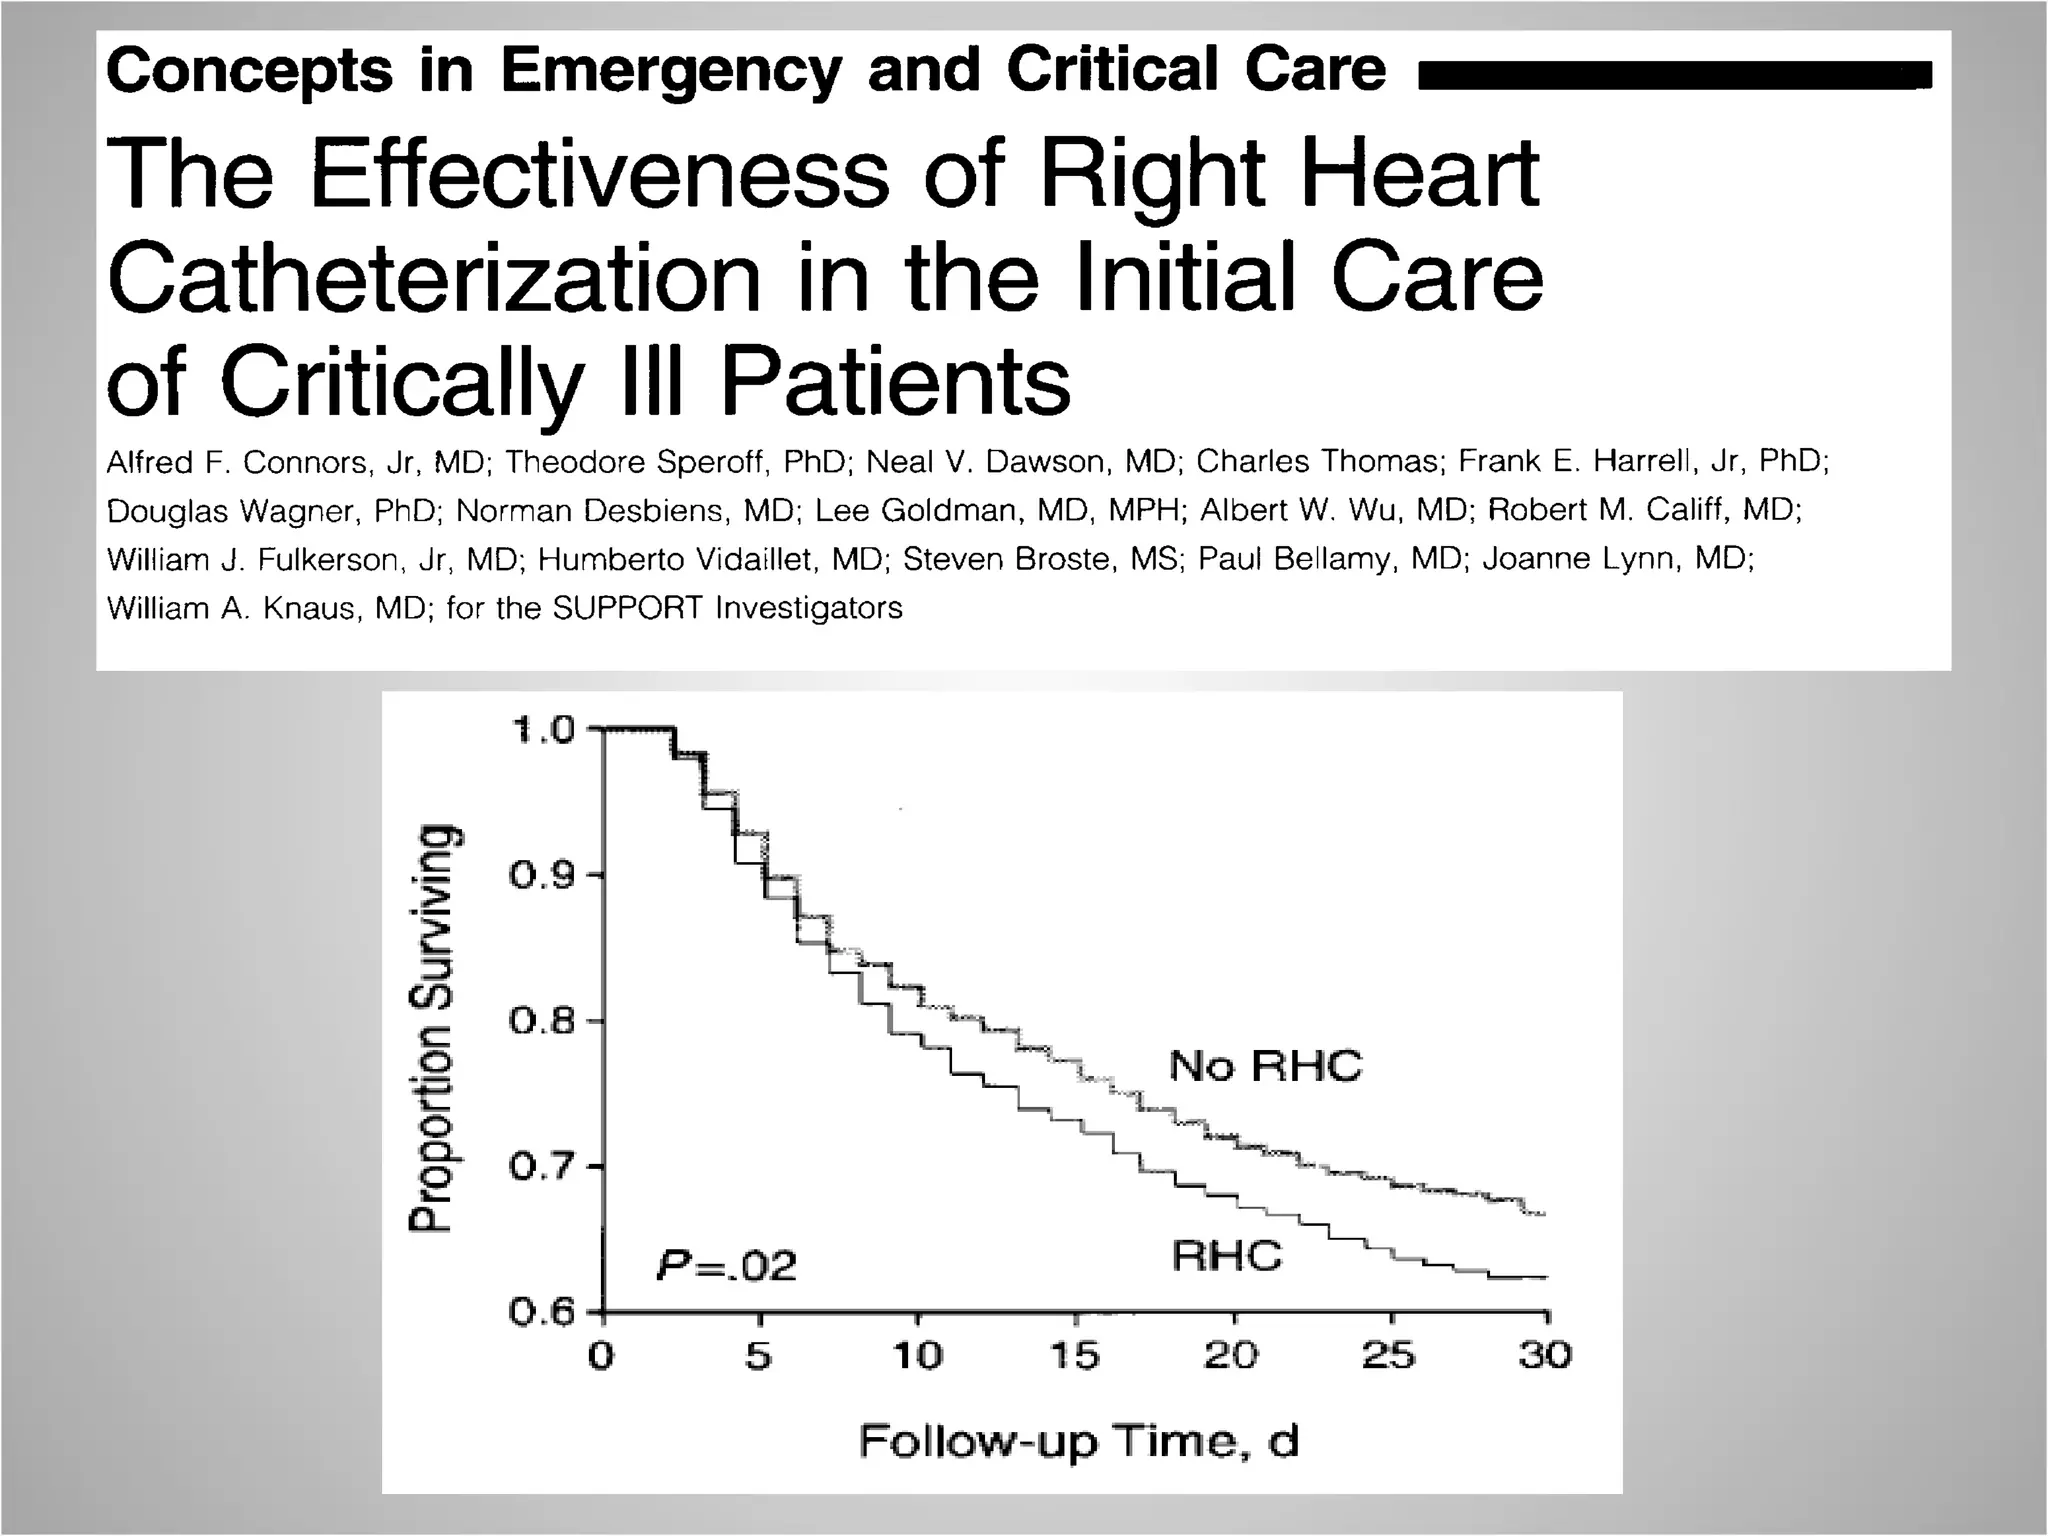
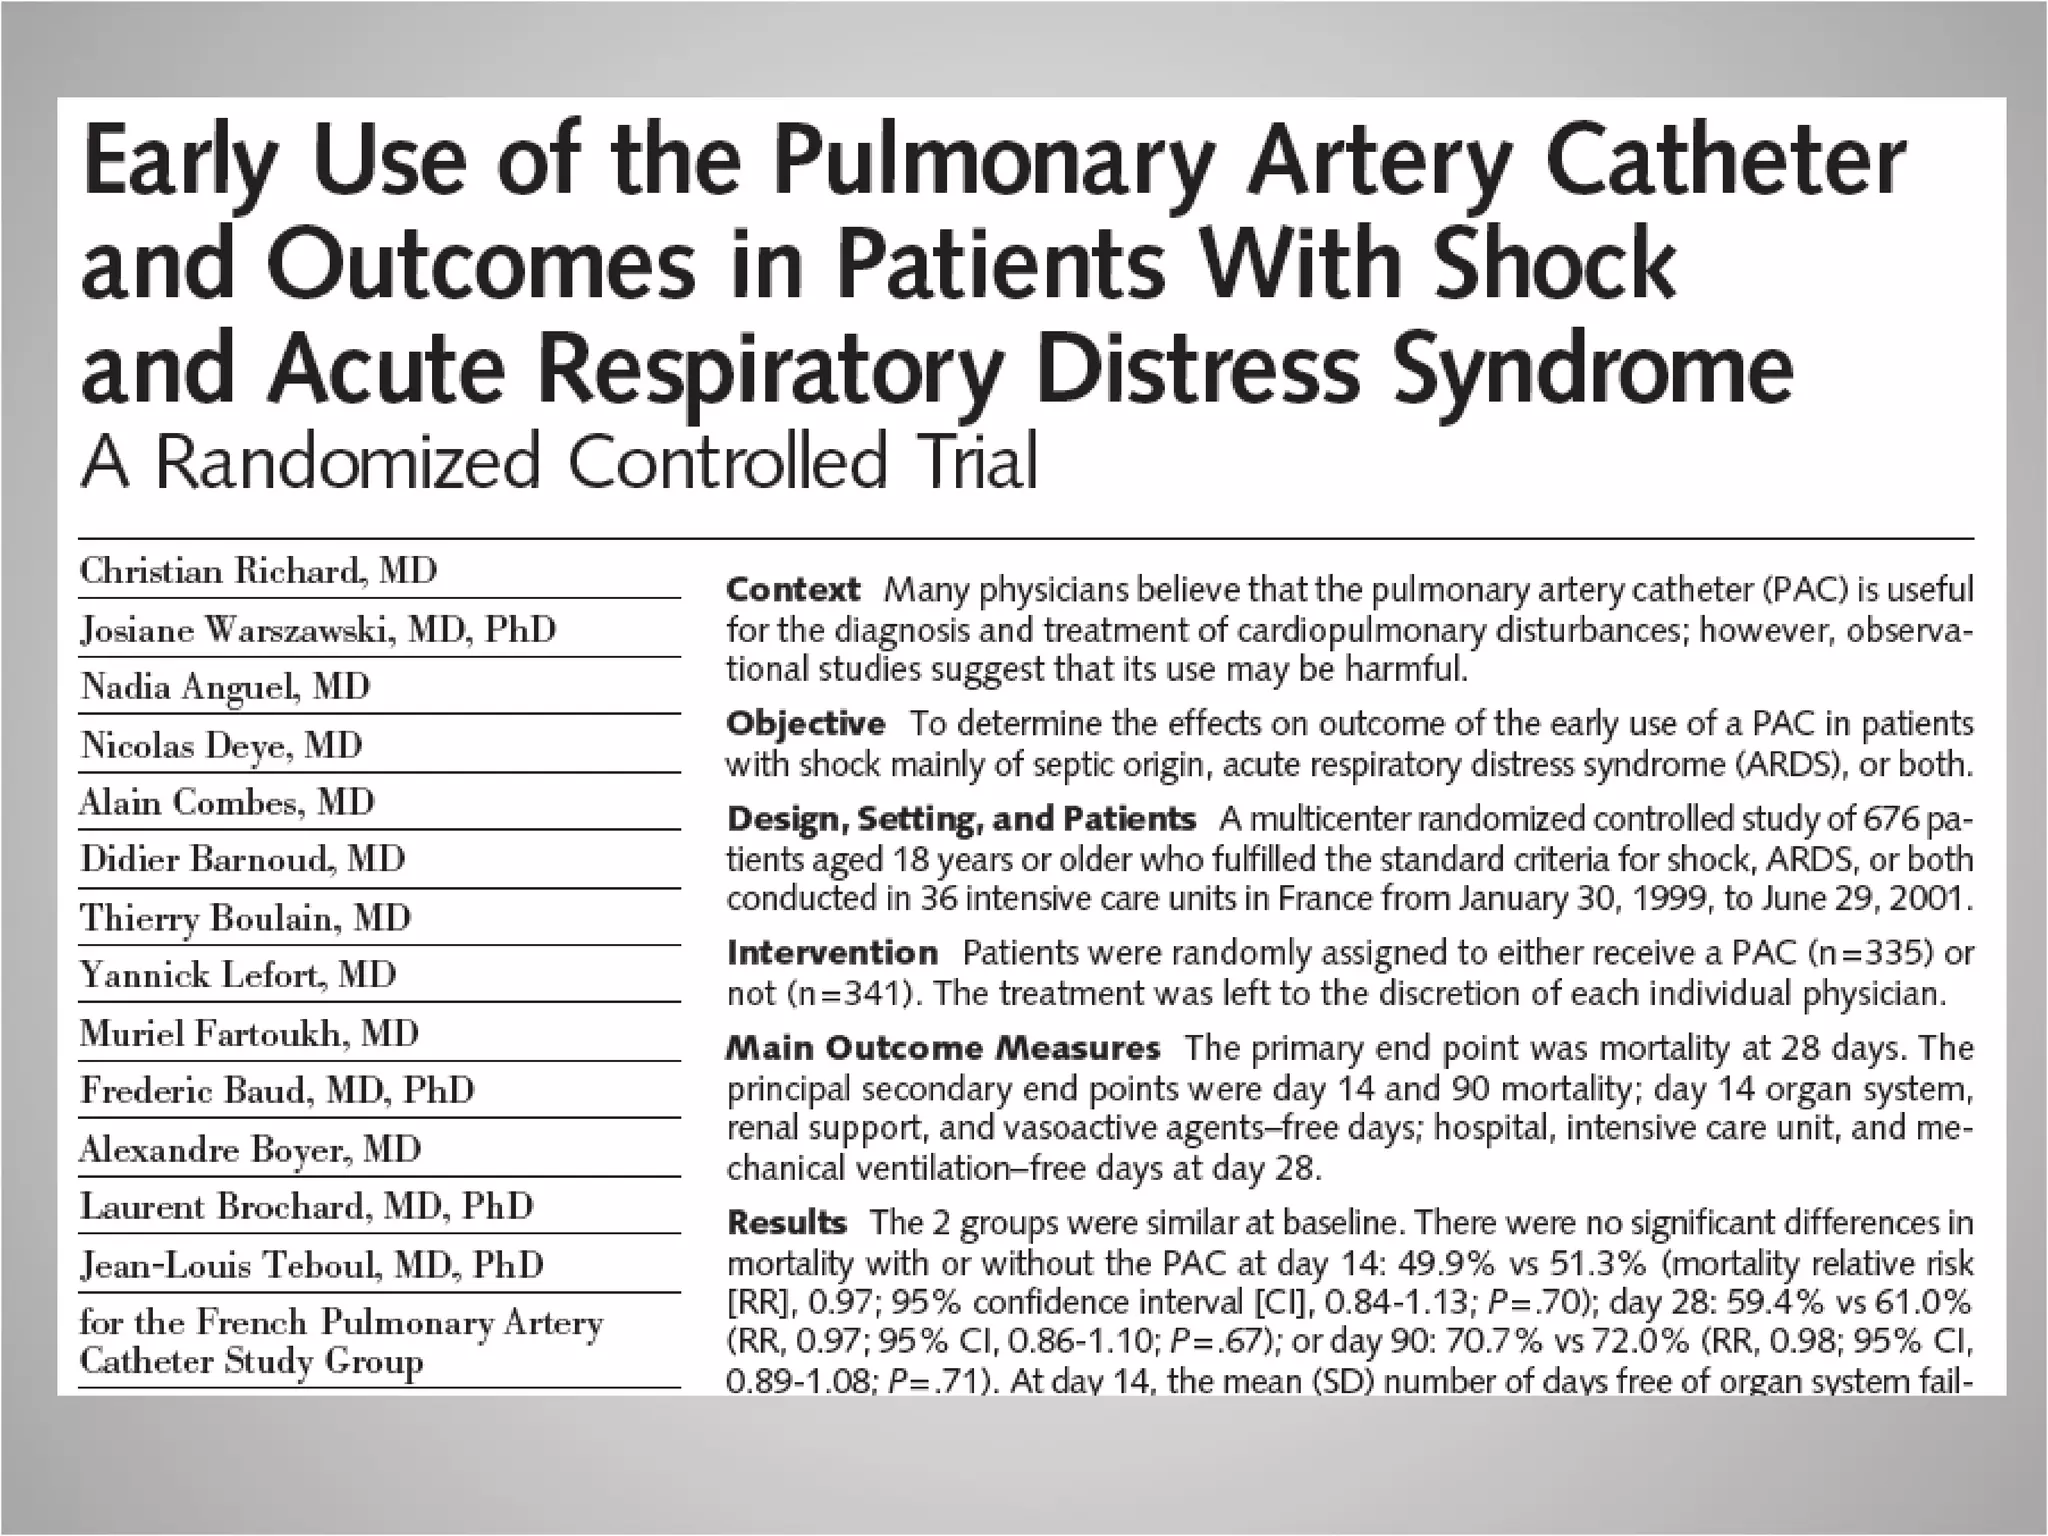
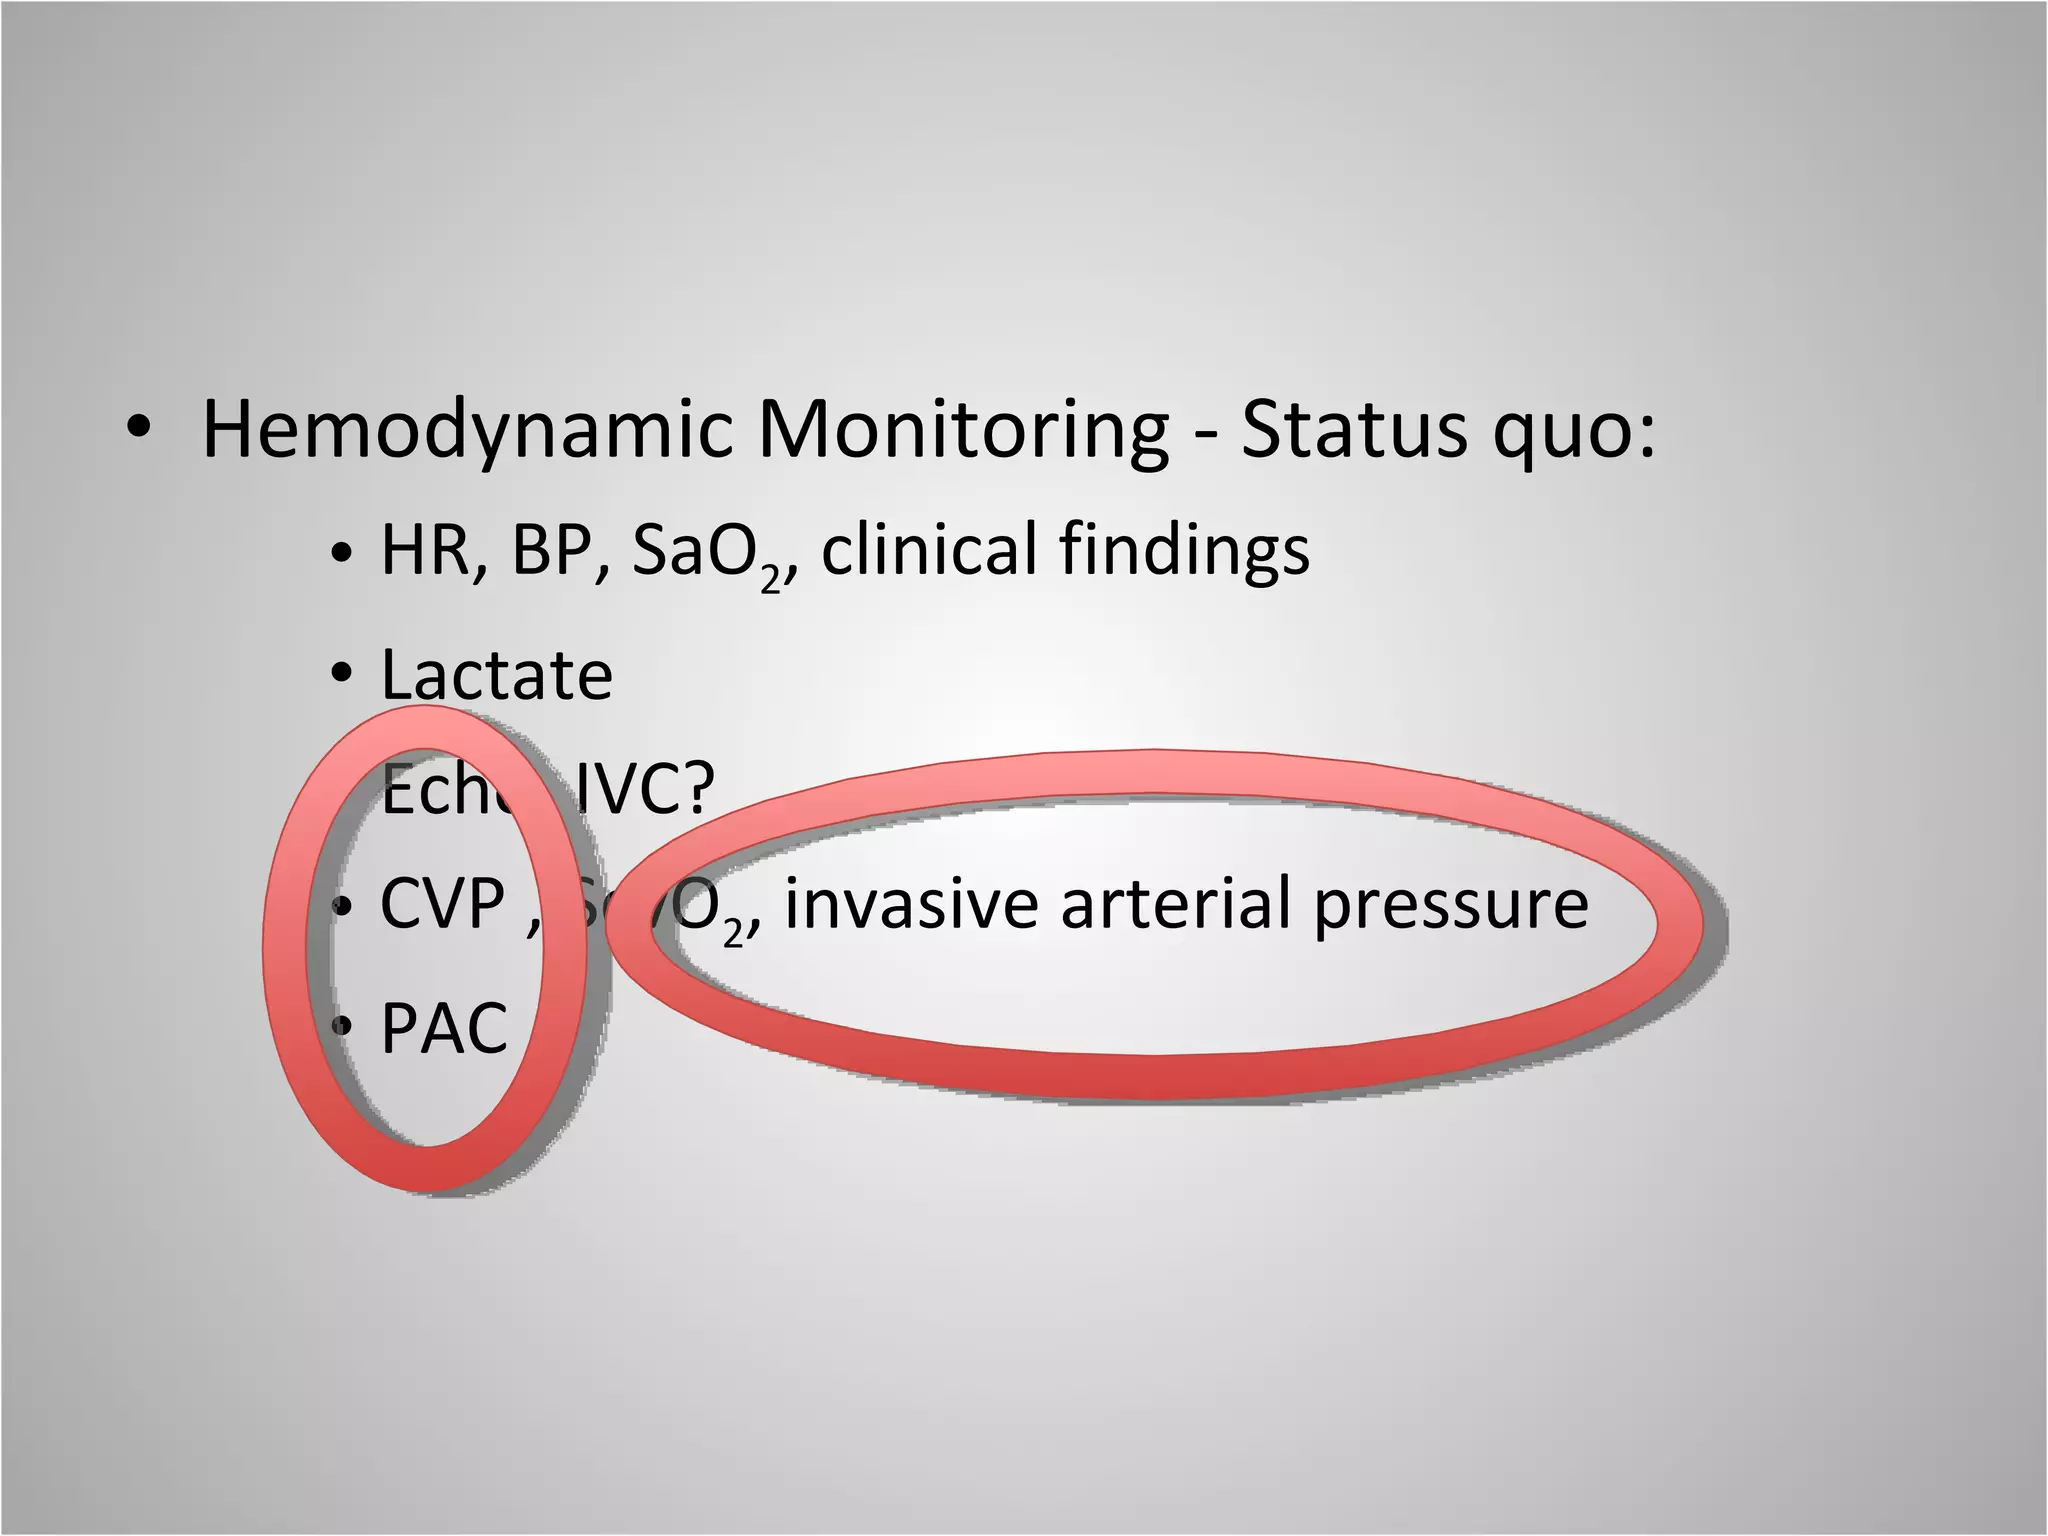
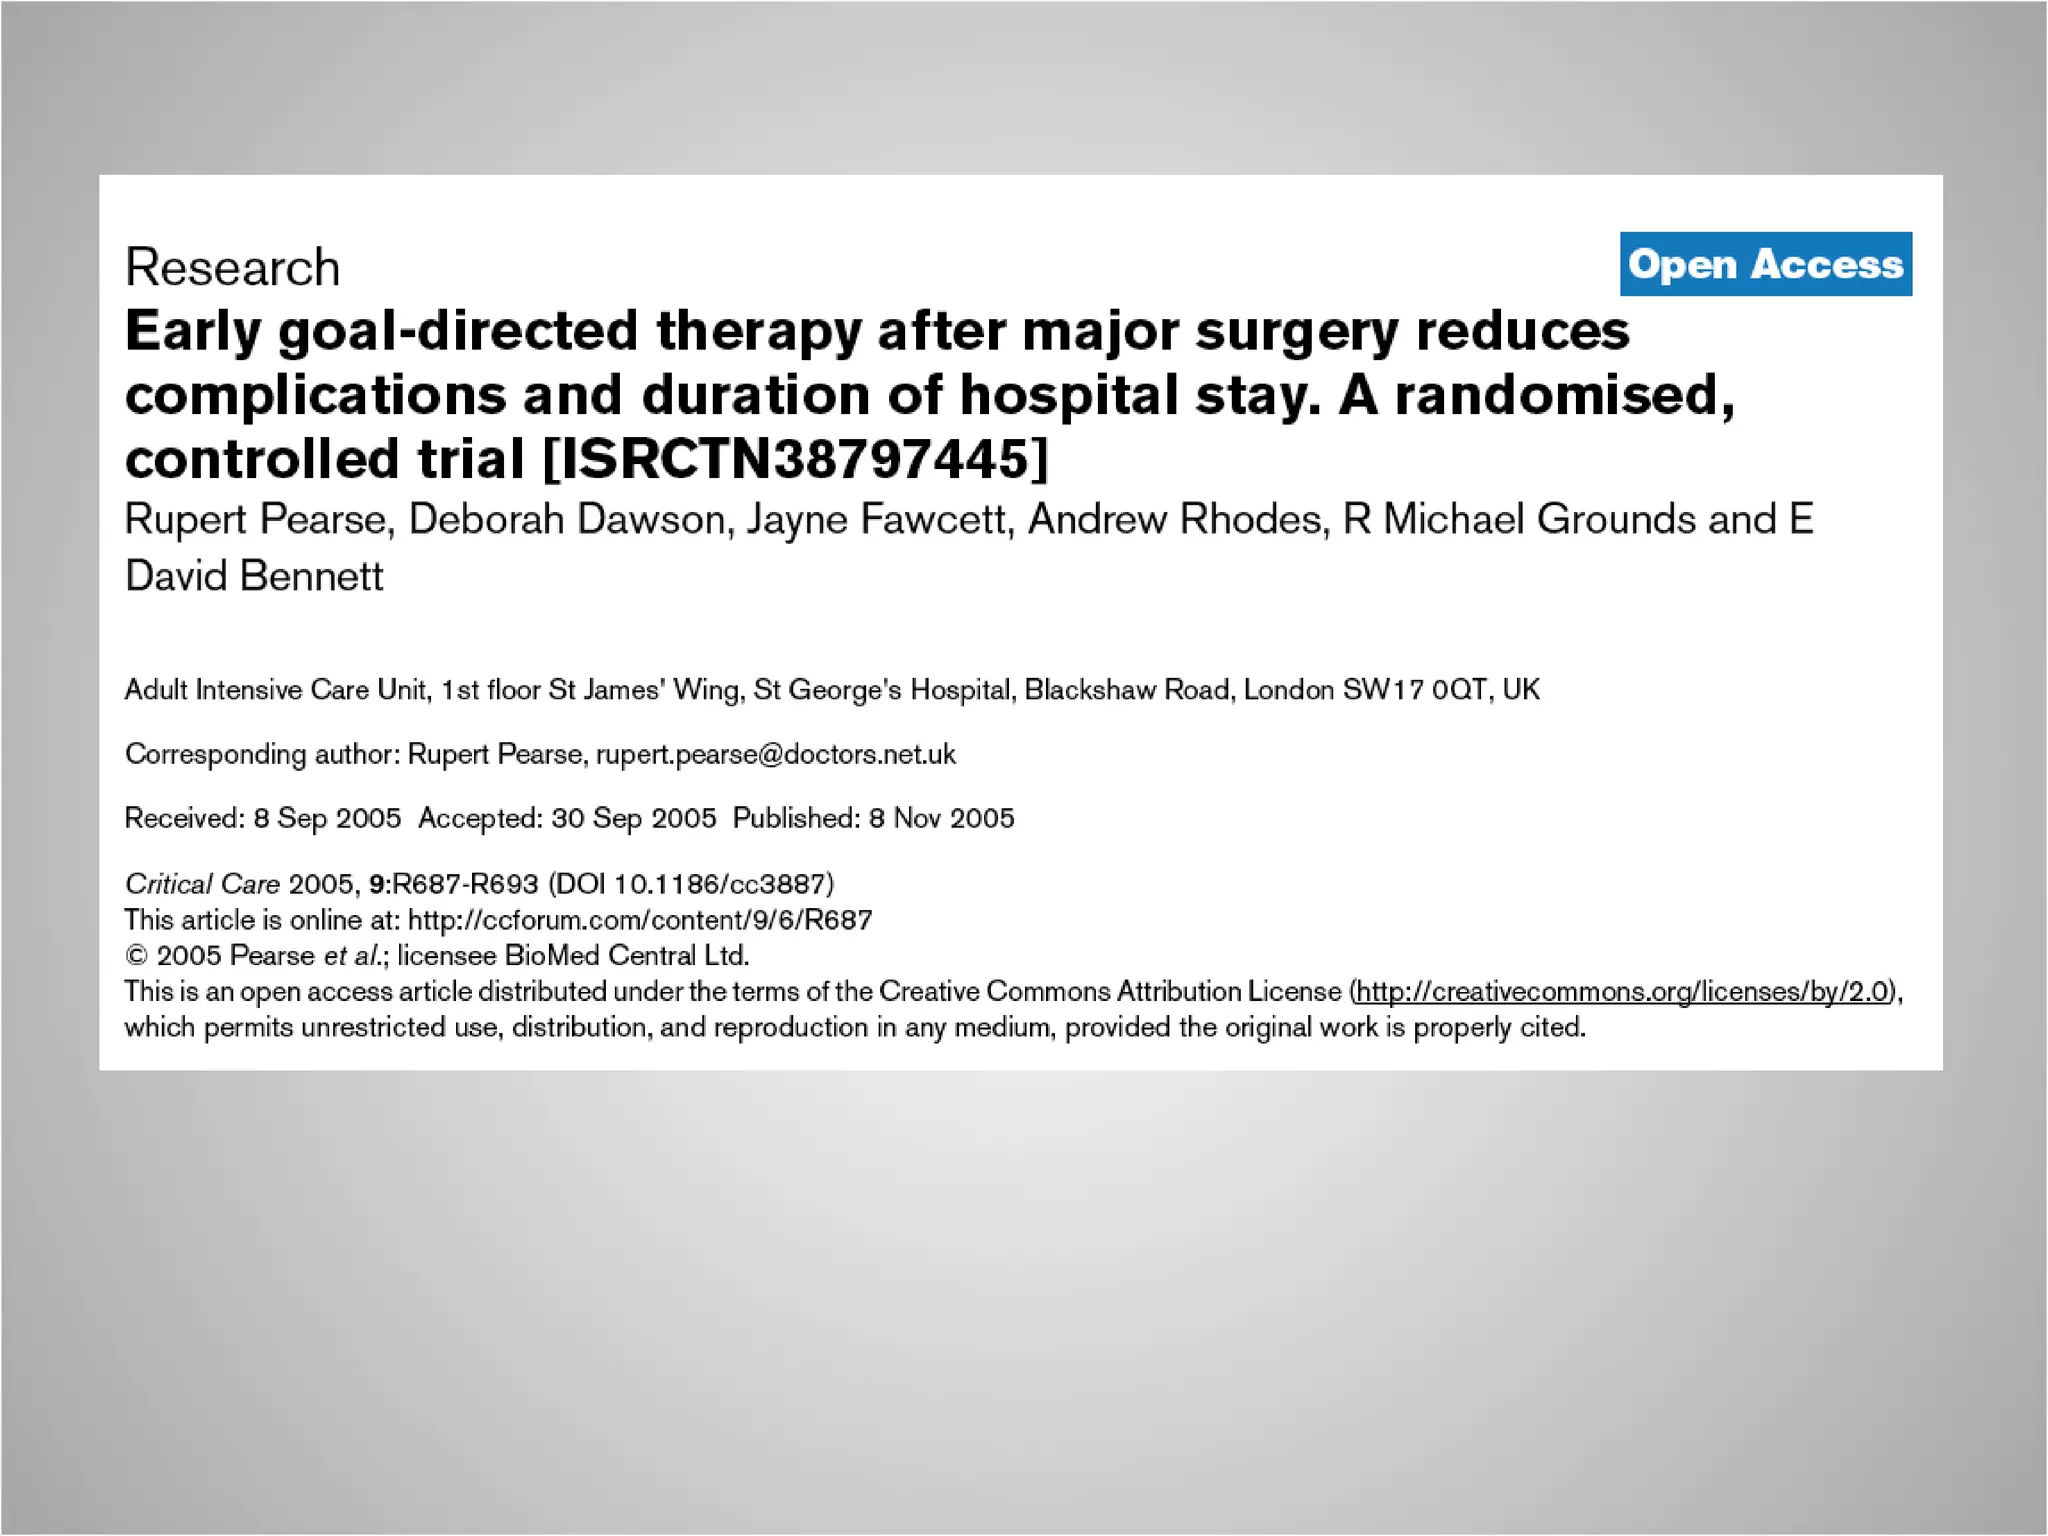
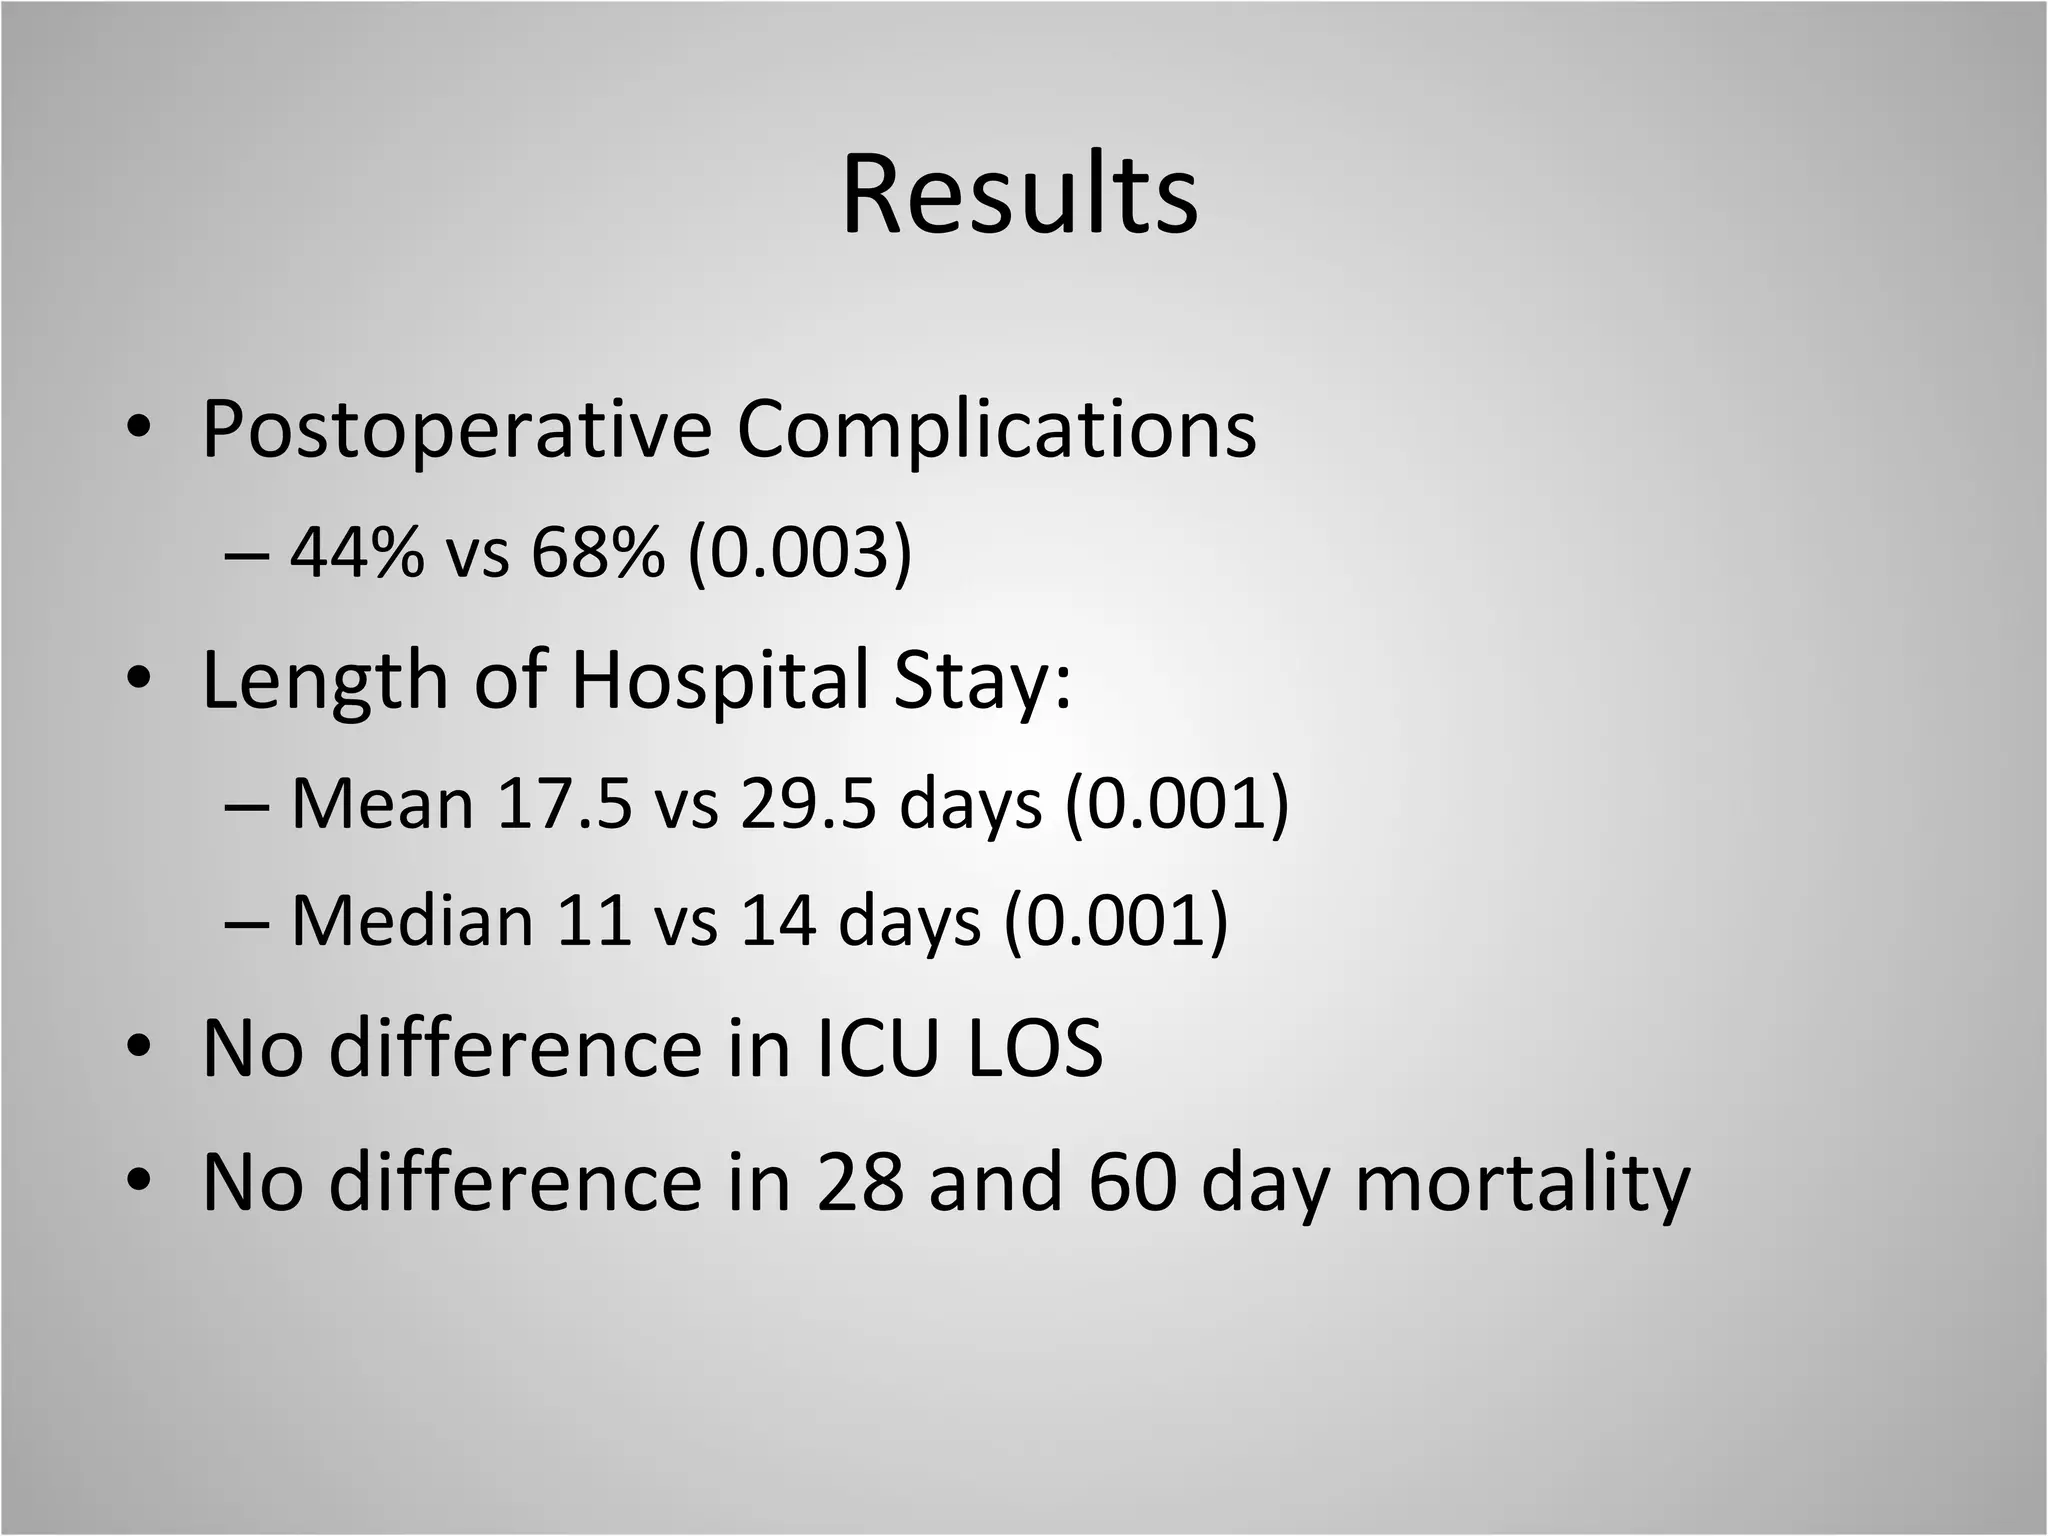
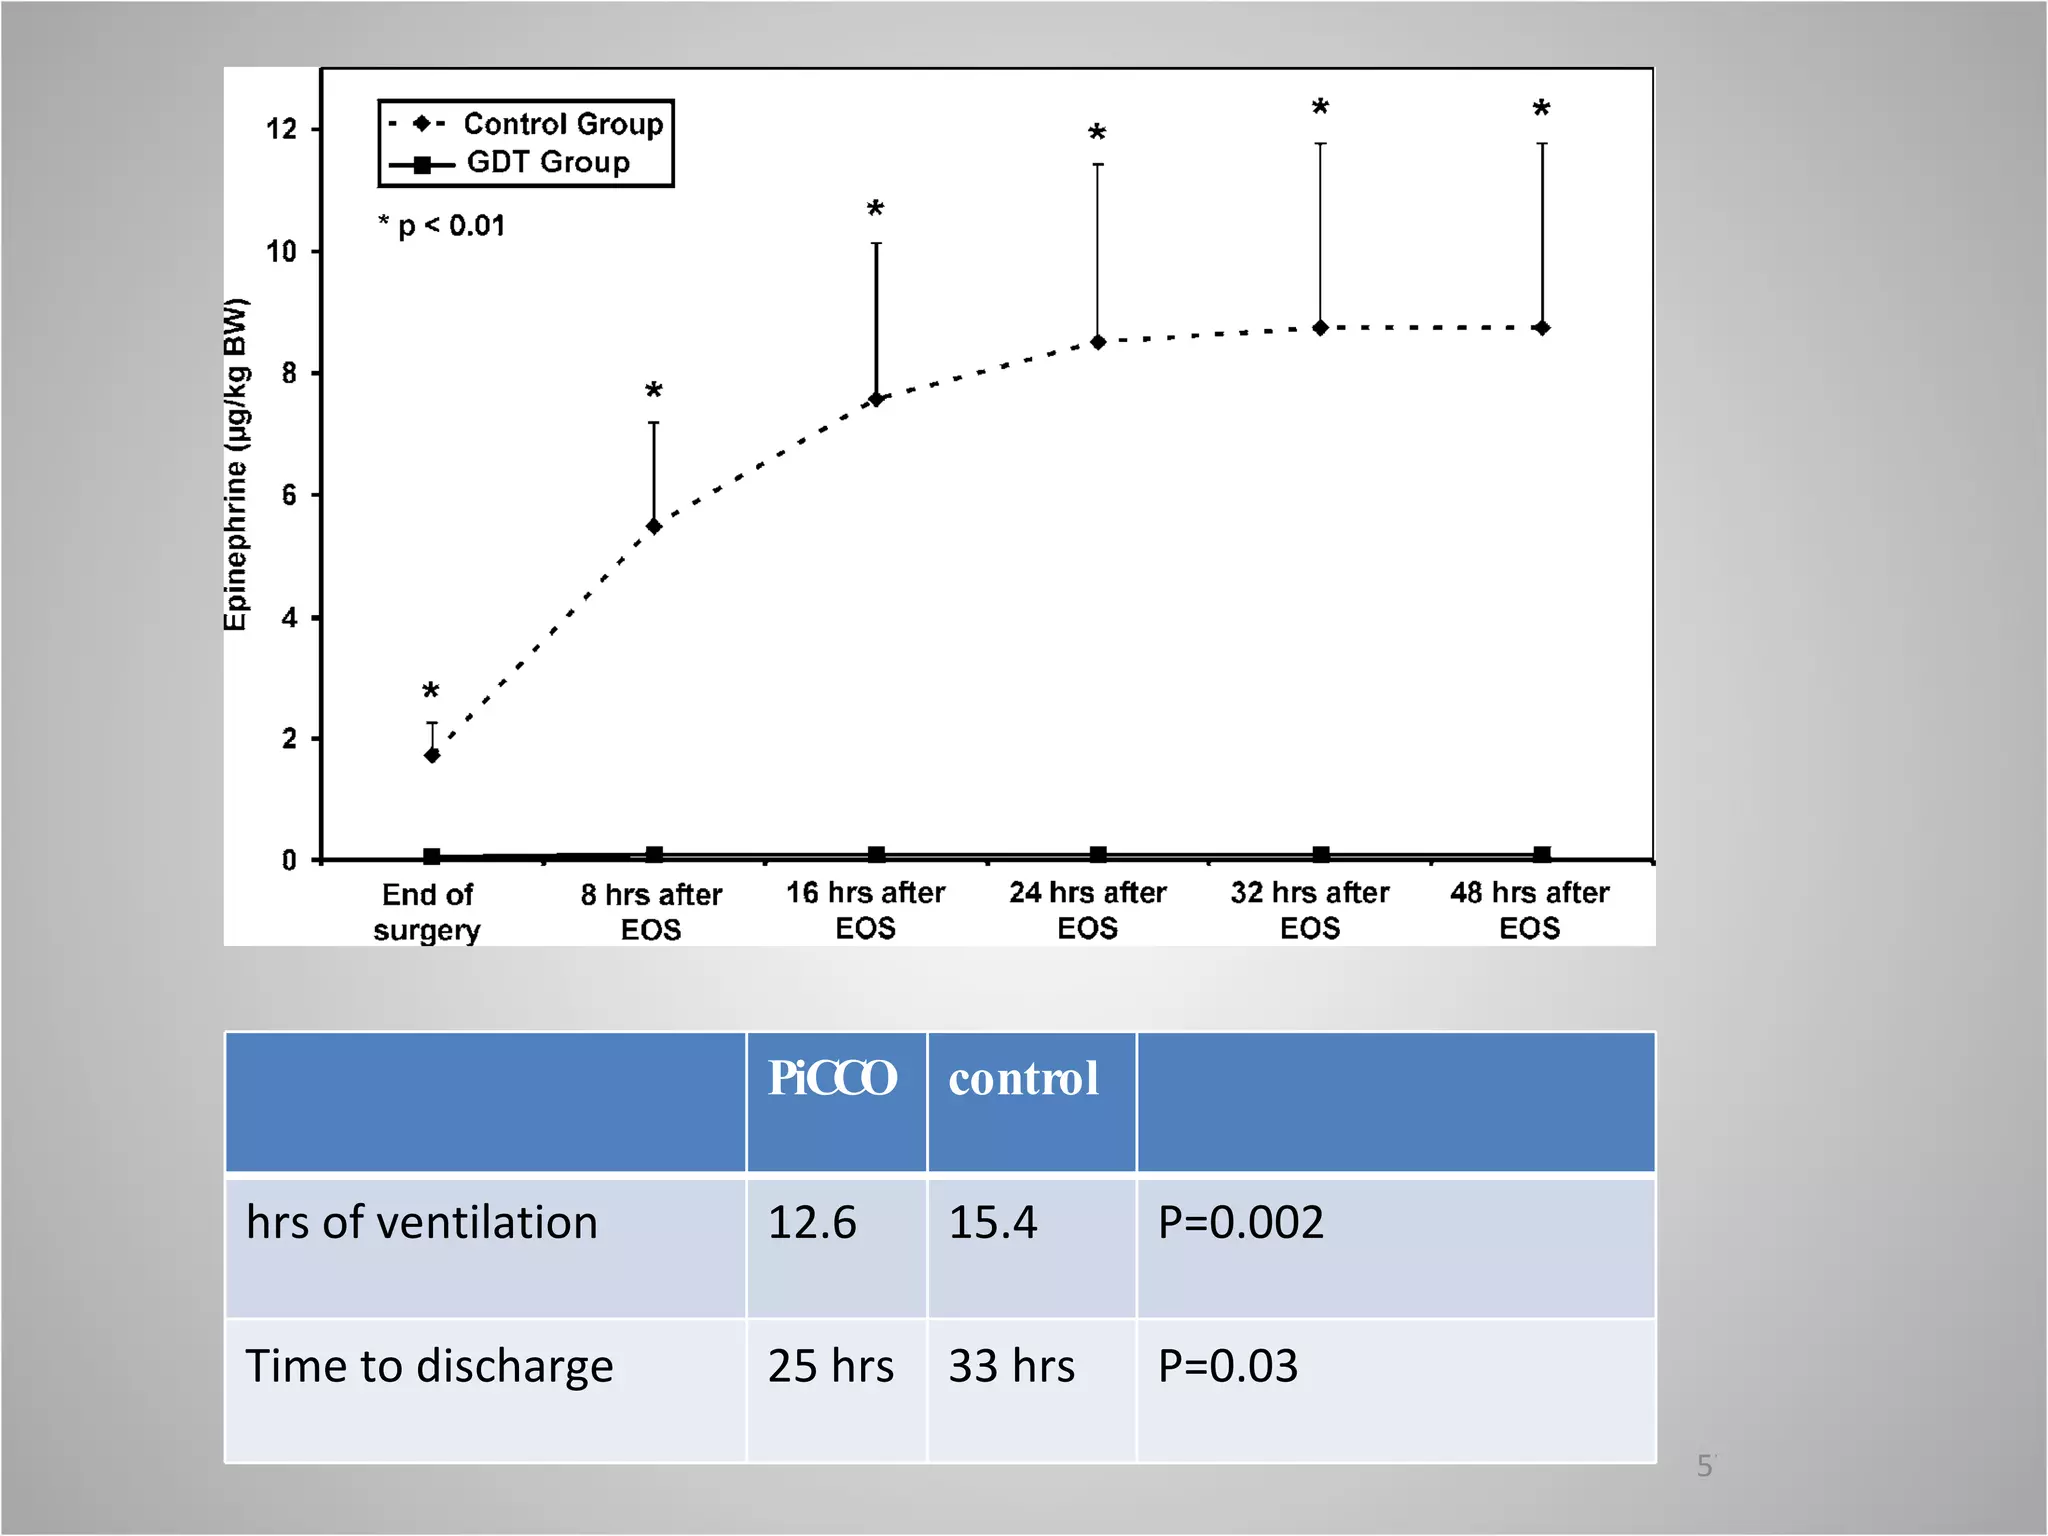
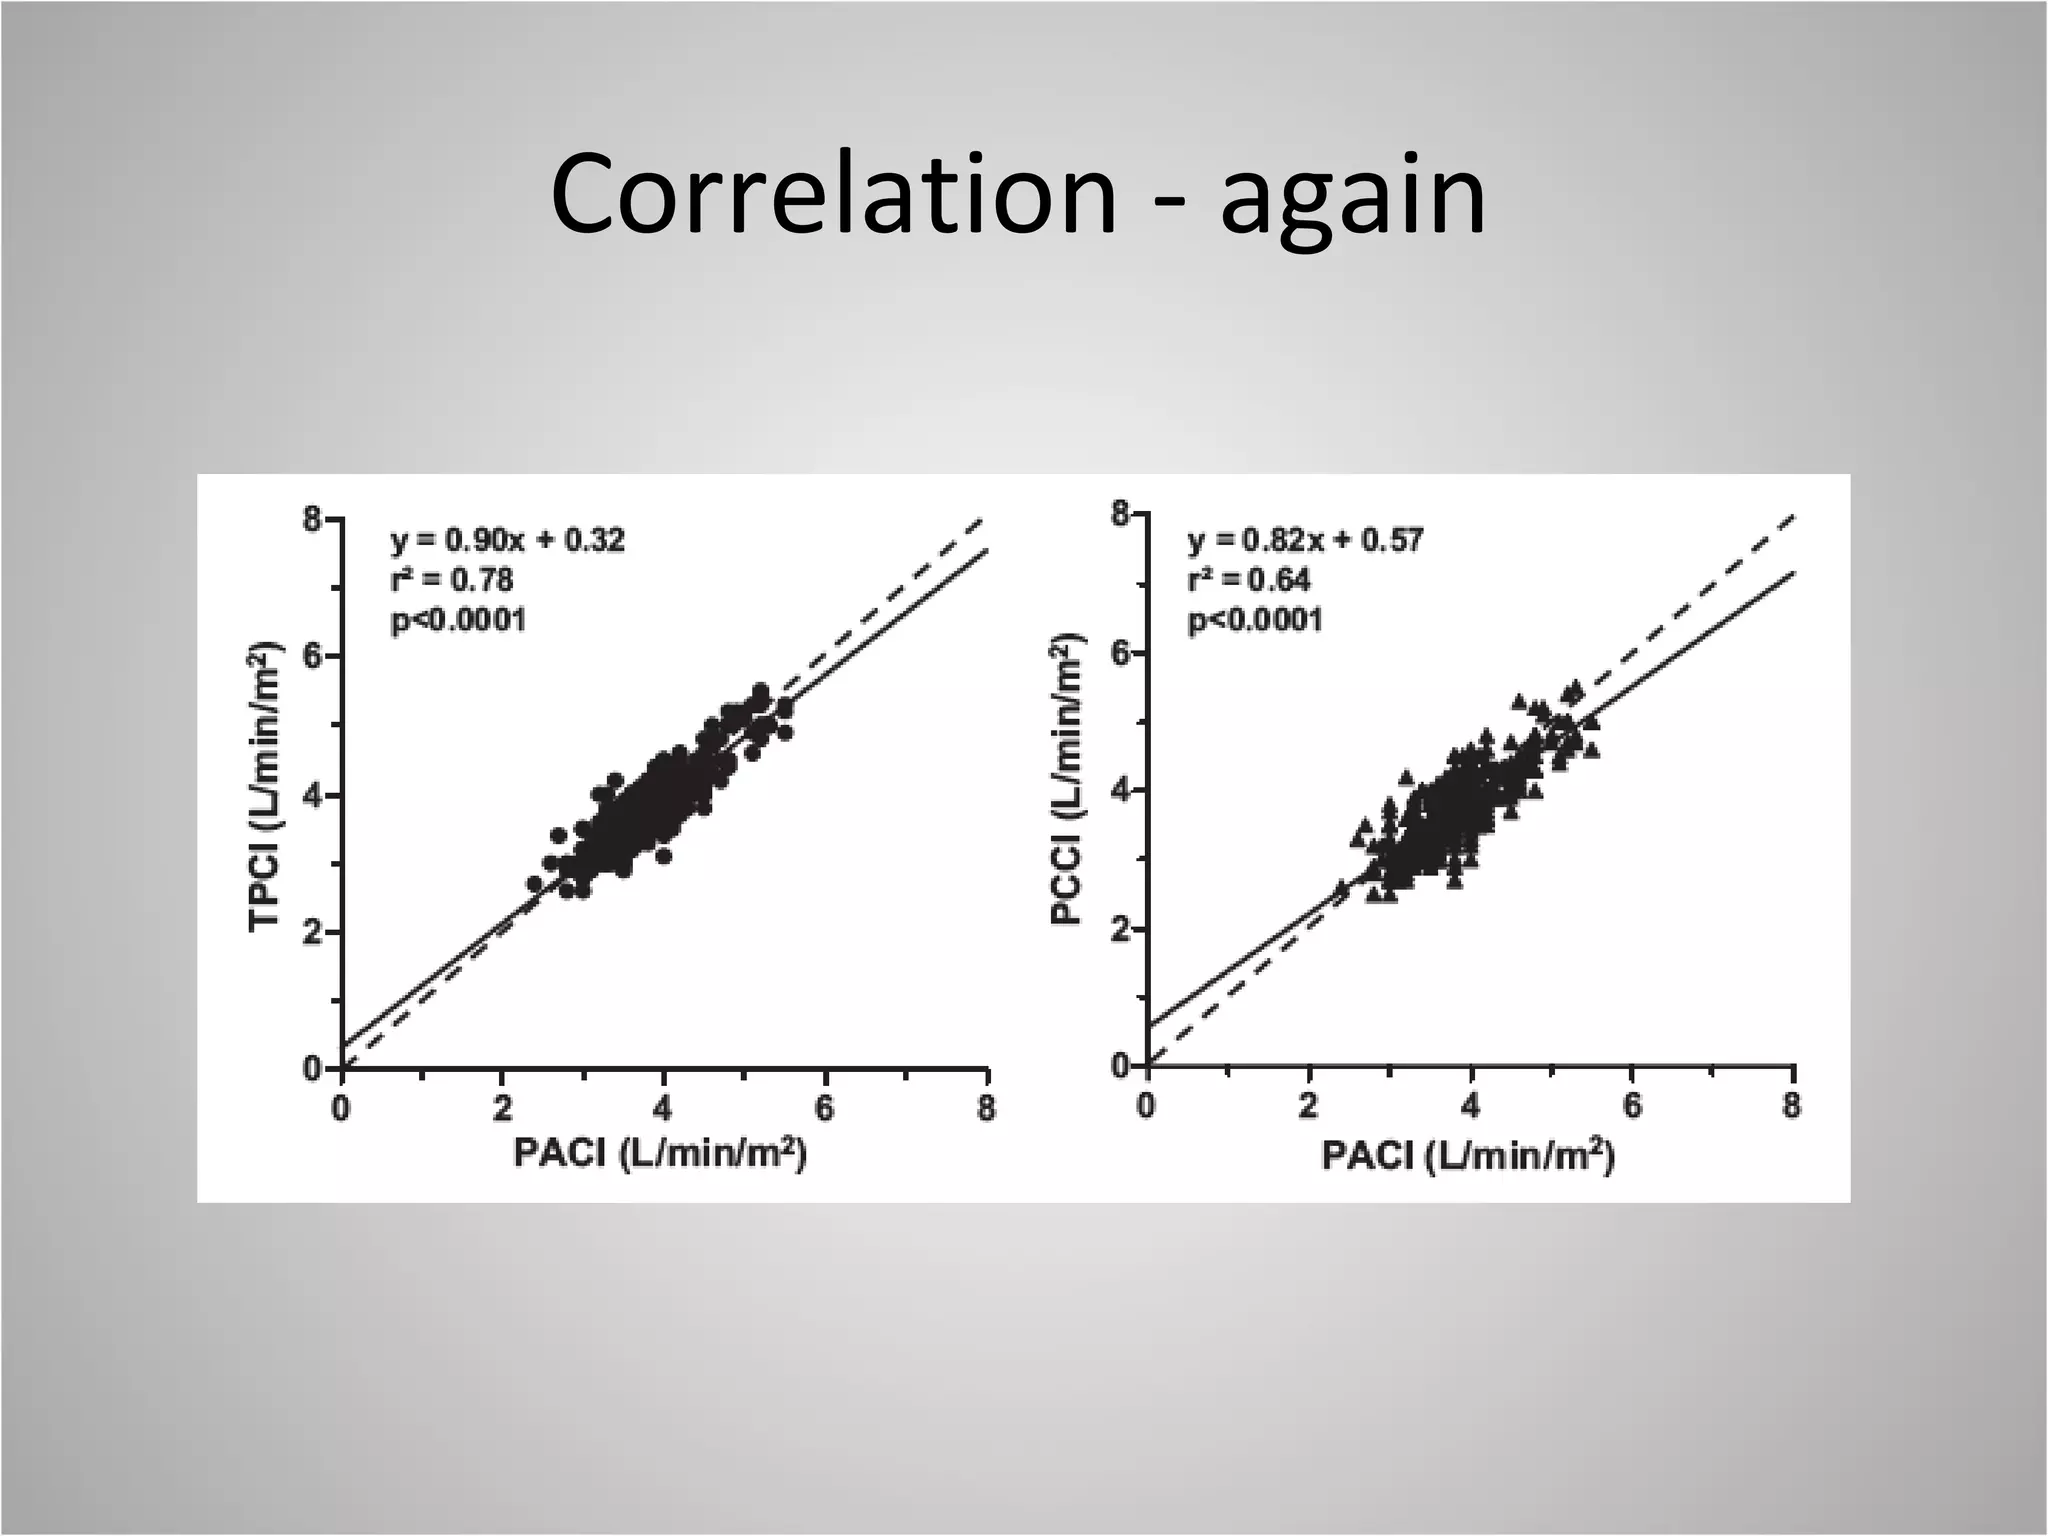
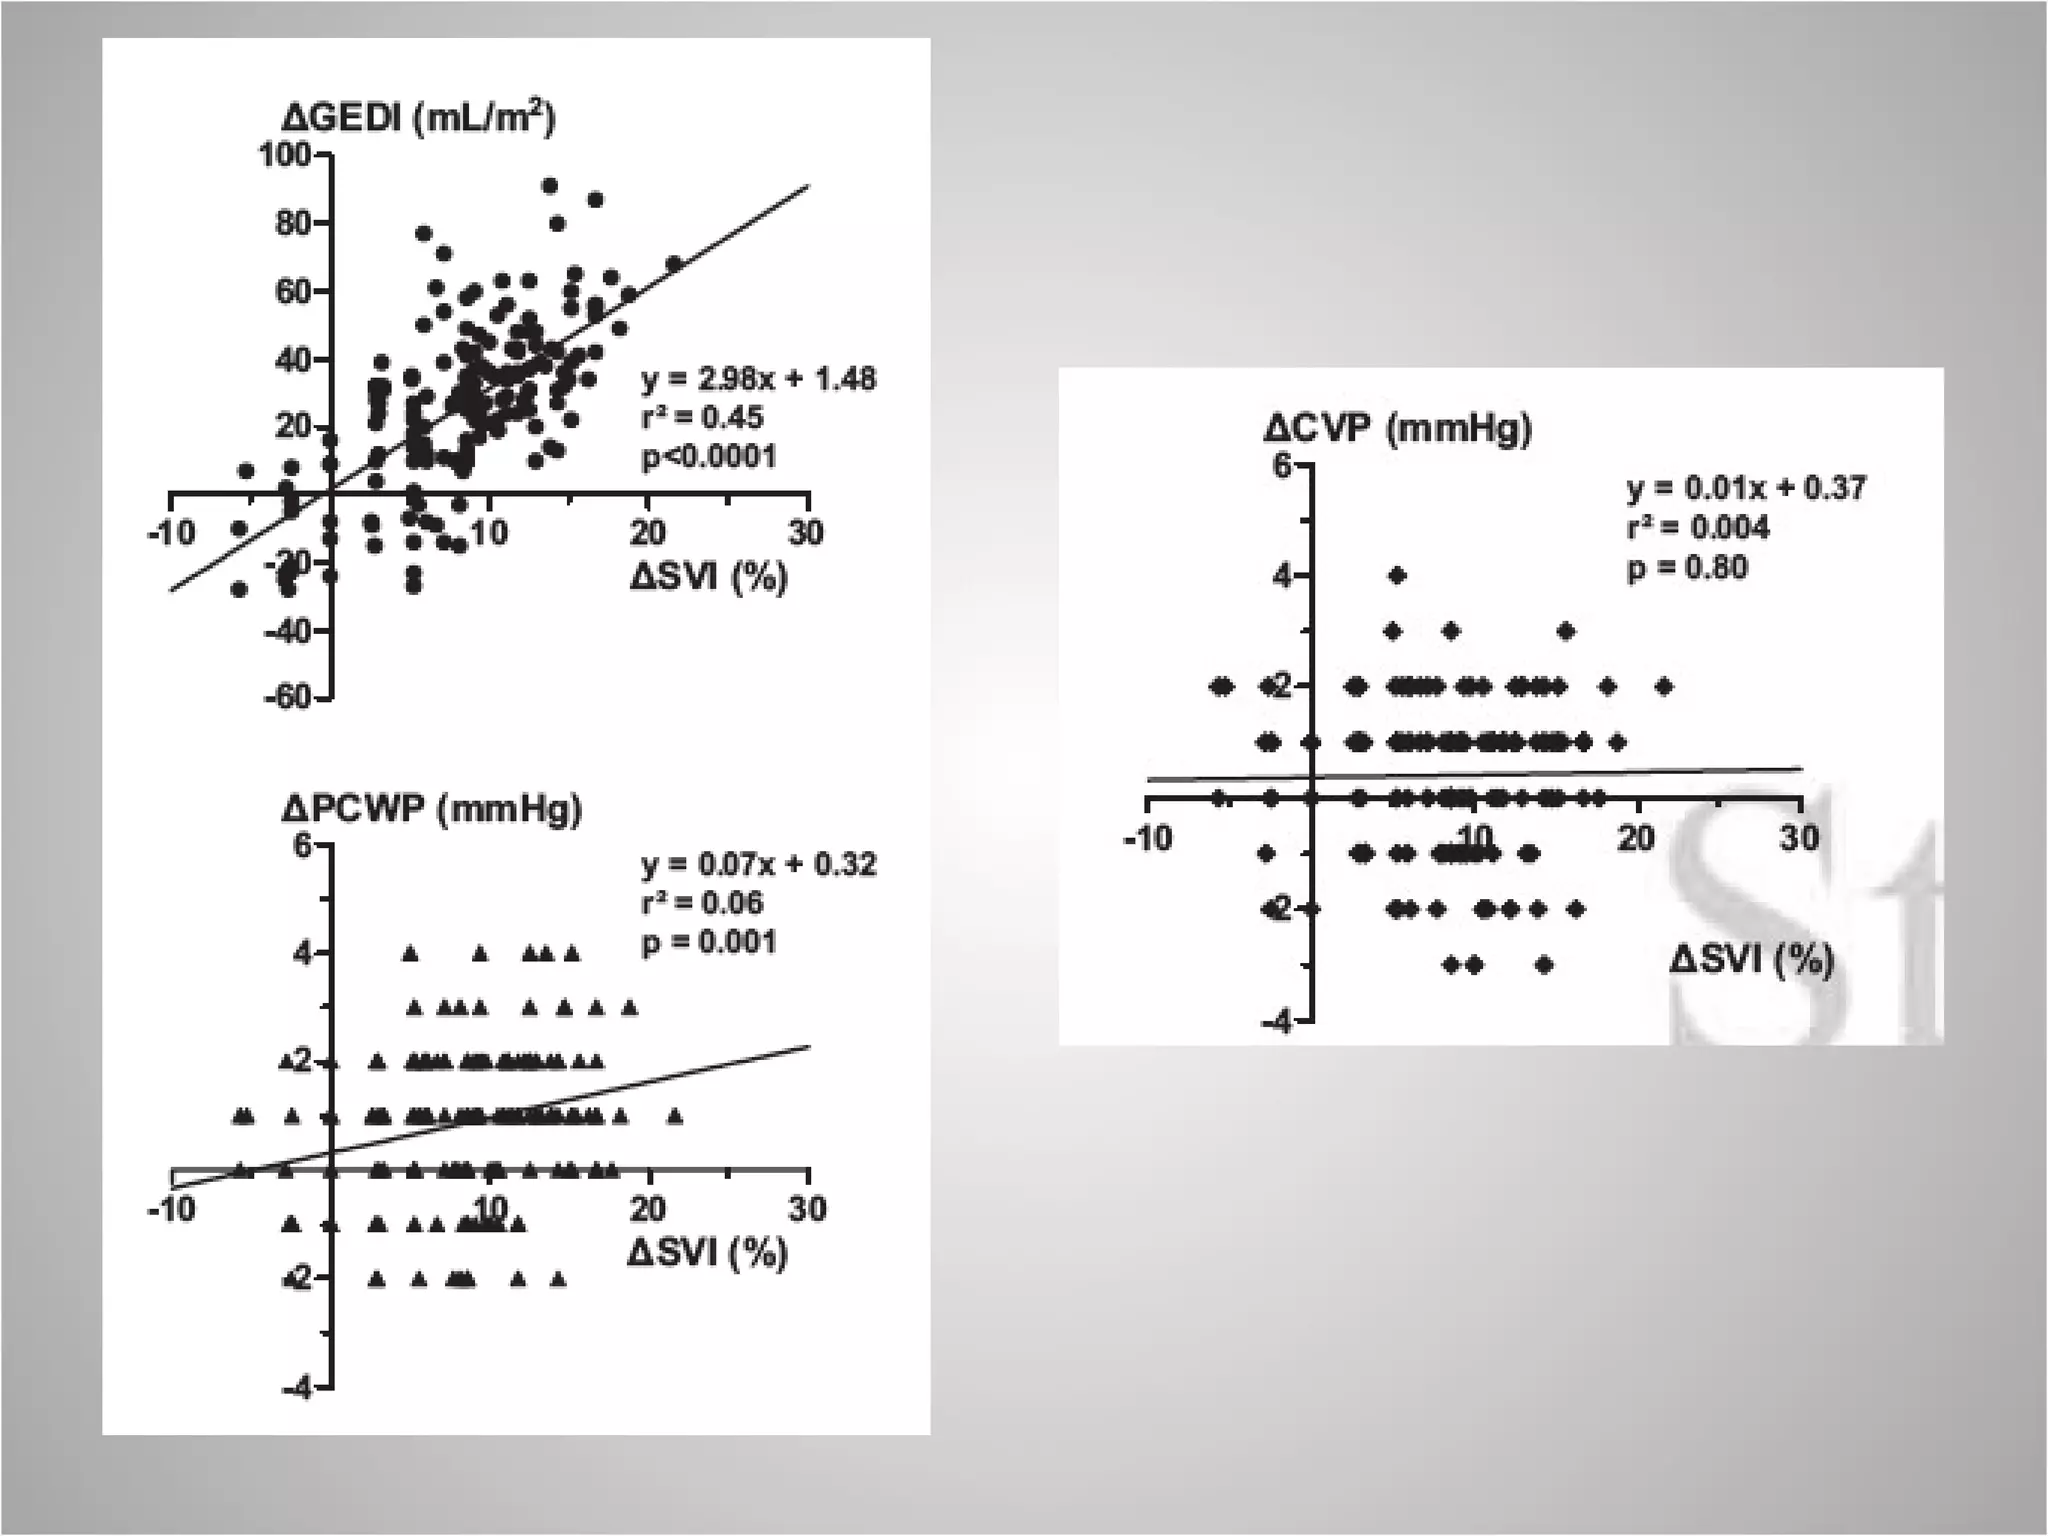
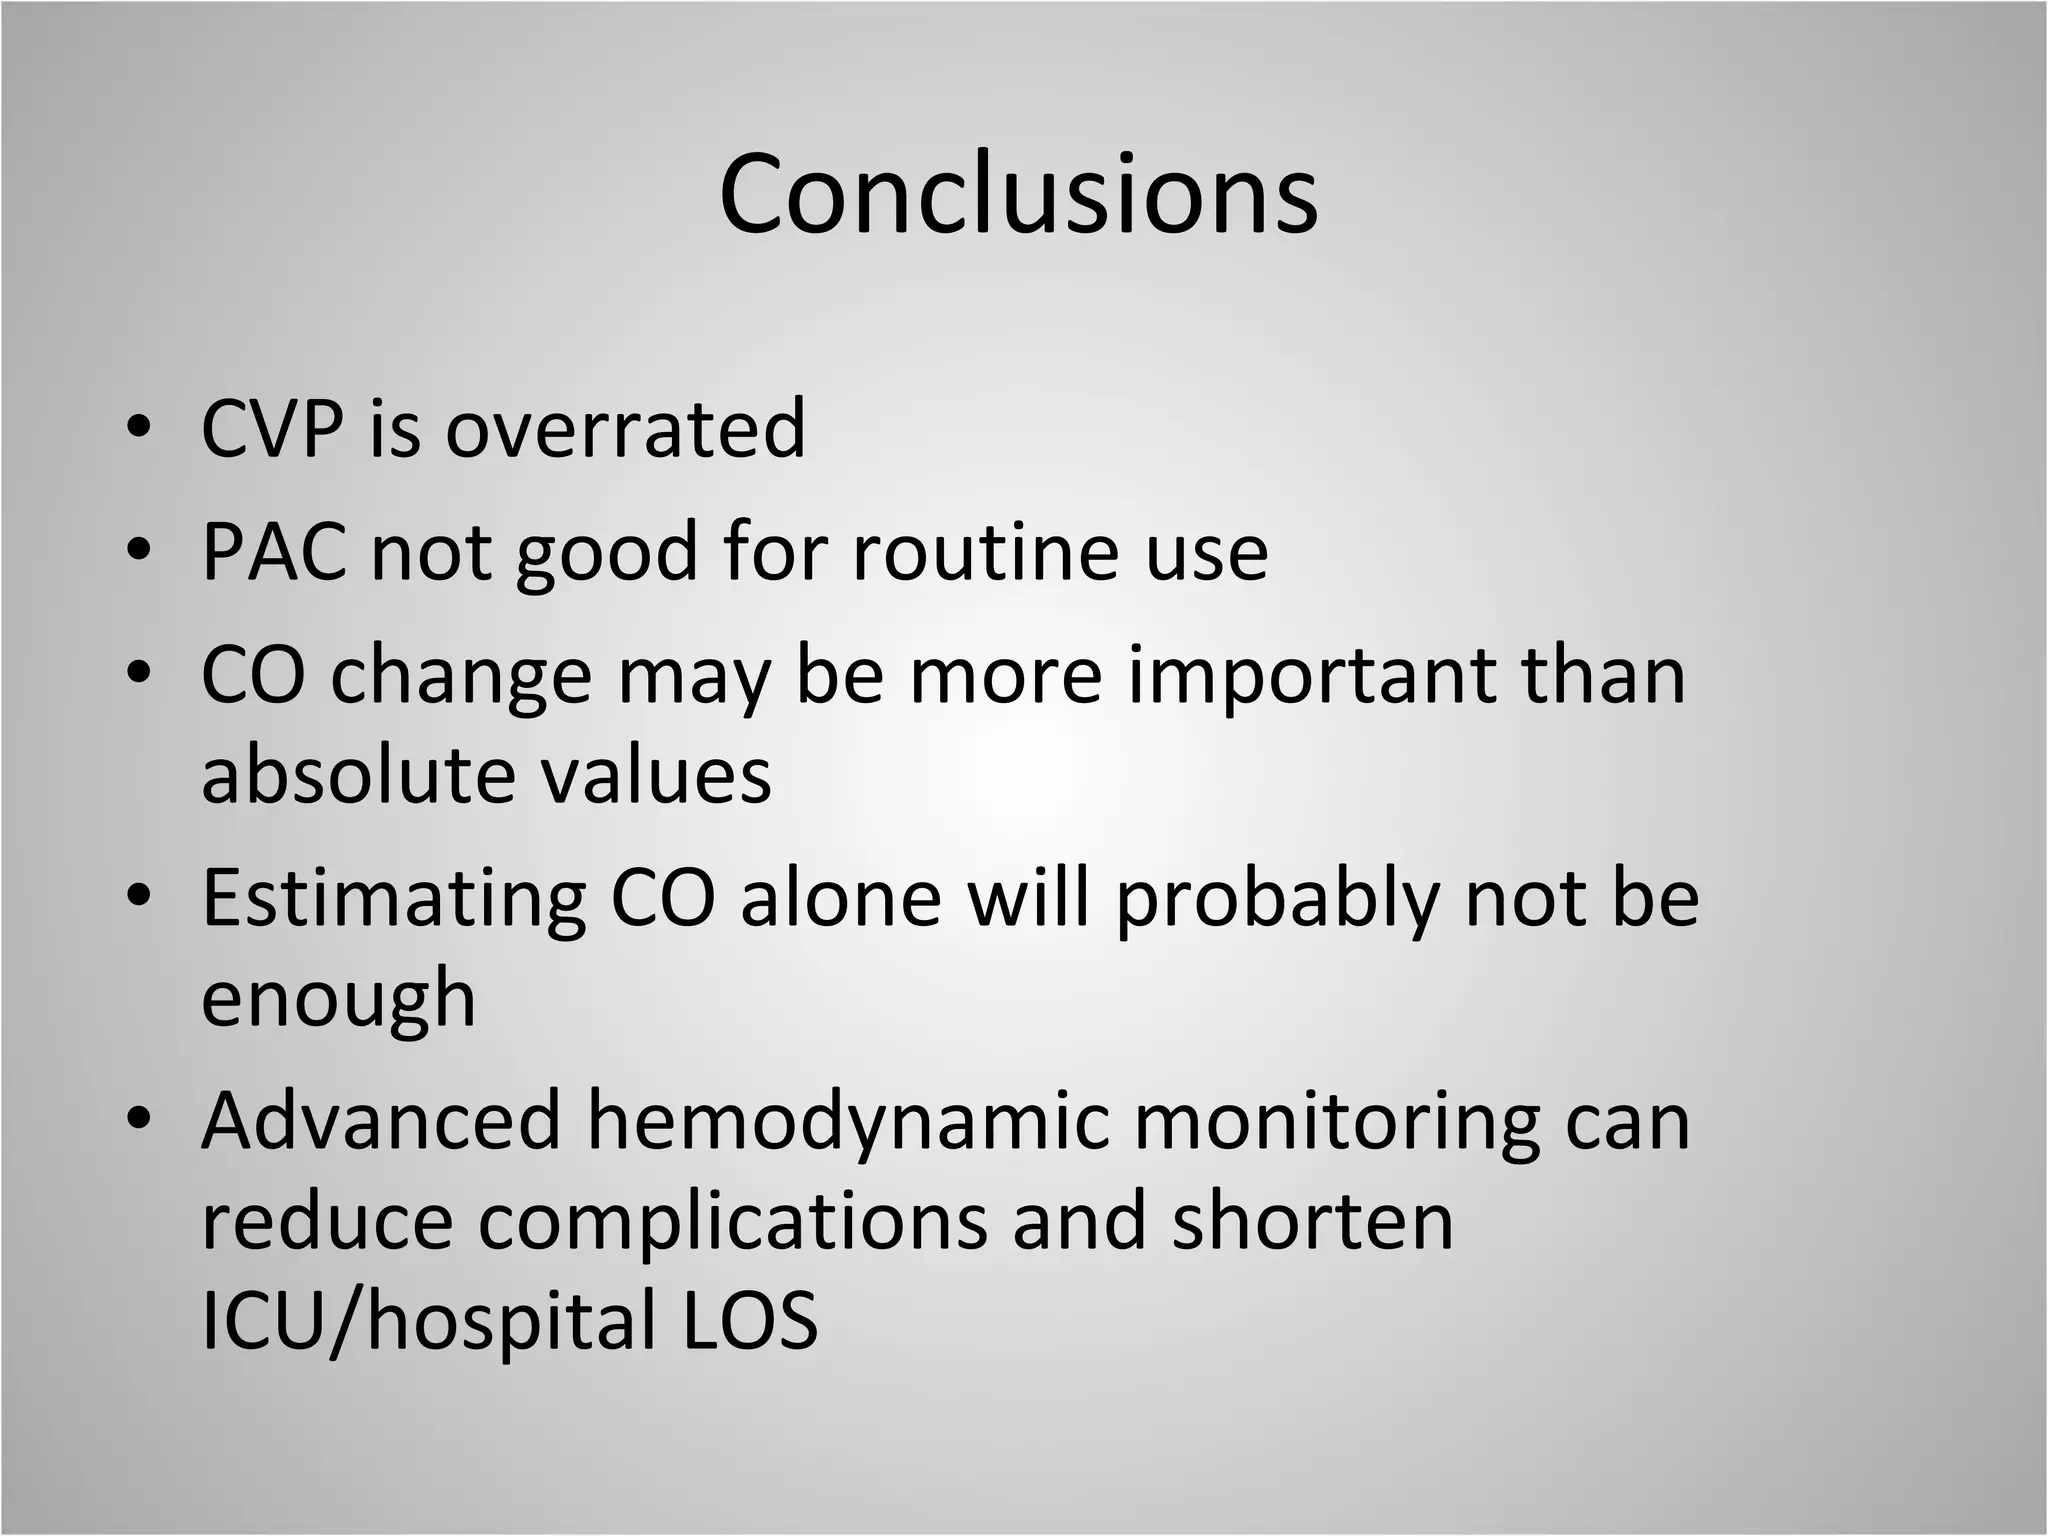
Hemodynamic monitoring Tobias Witter This presentation has been adapted to optimise online viewing
Agenda Status quo of our hemodynamic monitoring New devices  How they work Outcome data – Do we need it? Discussion
A brief – incomplete - history 1870 Adolf Fick postulated his principle for CO measurement 1929 Werner Forssman devised a method to get mixed venous blood from a man 1930 Otto Klein was the first to draw mixed venous blood and calculate CO 1967 Thermistor tipped catheter for CO measurement 1970 Swan and Ganz added ballon
 
 
Richard  et al
A randomized, controlled trial of the use of Pulmonary Artery Catheters in High-Risk Surgical Patients.  Sandham  et al (CCCTG) NEJM 2003; 348.
Knowledge? Gnaegi, Crit Care Med 1997
 
EVLW Wedge
 
EVLW
Hemodynamic Monitoring - Status quo: HR, BP, SaO 2 , clinical findings Lactate Echo, IVC? CVP , ScvO 2 , invasive arterial pressure PAC
 
Current Opinion Crit Care 2003
. Stroke volume Ventricular preload normal heart  failing heart  preload-dependence preload-independence
R (CVP/BV) = 0.16 ROC (ΔCVP/CO) = 0.56
Cardiac output Ficks principle Waveform analysis Stroke volume Bioimpedance Thermodilution
Bioimpedance Current of known amplitude and frequency Measures changes in voltage (thoracic resistance) = Impedance Z Change of Z is triggered by changes in aortic blood flow
blood flow pulse contour is roughly triangular in time SV is proportional to peak flow x VET, therefore proportional to max change of Z x VET SV = (L/Z)2x VET x dZo/dtmax, where L is the distance between the electrodes on the body surface
 
Bioreactance
Bioreactance Phase shift due to blood volume in aorta SV can be expressed as: SV  =  C x VET x dΦ/dtmax where  C is a constant of proportionality.
 
 
Bioreactance - Cheetah NICOM and CPB (pig model): Good correlation, regardless of acute changes and temperature swings
Limitations Depending on assumption that the area under the flow pulse is proportional to the product of peak flow and VET Not always like that (low flow) Different type of bypass in animal studies Tested against SGC - thermodilution technique may not actually provide an accurate value for comparison
Flowtrac Skewness Kurtosis
 
Flotrac - Vigileo Pulse contour analysis CO=HRxSV Flotrac=PR  x  (σAP x χ) χ is dependent on: PR, MAP, σAP Patient demographics Skewness and Kurtosis
Pulse contour - problems Compliance of aorta not constant Wave reflection: depending on distance from heart, age Damping – good wave form needed – clinically wave forms are often over or underdamped Aortic flow in systole (intermittend vs. continous)
Ideal system Independent of arterial location Would correct for aortic unlinearity Independent on SVR eg reflection Not dependent on wave morphology Not affected by damping of wave form
LiDCO Principles Conservation of mass/power Assumption: Net power change is the input of mass of blood minus the blood mass lost to periphery The relation between net power and net flow is linear, once calibration and correction for compliance has been done
 
Pulse Pressure Pulse pressure: fluctuation of blood pressure around mean caused by stroke volume
LiDCO – 5 steps 1. Pressure signal is transformed into a standardized volume waveform: dV/dBP=calibration x 250 x e -kxBP 2. Autocorrelation derives beat pulse period and beat power factor - which is proportional to the ejected “nominal” stroke volume
 
LiDCO – 5 steps 3. Nominal SV can be scaled against the actual SV with indicator dilution measurement 4. Calibration factor corrects for arterial tree compliance at any given pressure and corrects for interindividual differences 5. Calibration factor changes saturation volume
 
Potential Benefits Analyzes the whole beat – not only systole Because the whole beat is analyzed, independent of site and reflection wave Autocorrelation is time based – not frequency based. Therefore less dependent on damping as frequency based methods System can be calibrated with any form of CO measurement
Limitations The performance of the software may be compromised in the following patient groups: Patients with aortic valve regurgitation Following aortic reconstruction - a recalibration is required Patients being treated with an intra aortic balloon pump Patients with highly damped peripheral arterial lines Patients with pronounced peripheral arterial vasoconstriction Cardiac arrythmias (SPV, PPV% and SVV%)
PiCCO-way it works Transpulmonary thermodilution
PiCCO-way it works
PiCCO-way it works
PiCCO-way it works CO is calculated with the Stewart-Hamilton equation Curve is then transformed into a logarithmic form and with the MTt and DSt  are determined
PiCCO-way it works
PiCCO-way it works
SVV and PPV
General
 
Results…. R=used as Reference method, s=stable conditions, PAC-CC0 PiCCO LiDCO NiCOM Flotrac Squara, 2007 X (R) X R=0.82 (s) Marque, 2009 X (R) X X R=0.77 (s) Ni, R=0.69 (s) Flo Mayer, 2008 X (R) X Rel. Err 24.6% Raval, 2008 X (R) X R=0.78 (s) Squara, 2009 X (R) X R=0.76 McCoy, 2009 X (R) X Good bias, large SD
 
 
Results Postoperative Complications 44% vs 68% (0.003) Length of Hospital Stay: Mean 17.5 vs 29.5 days (0.001) Median 11 vs 14 days (0.001) No difference in ICU LOS No difference in 28 and 60 day mortality
Goepfert, ICM 2007
 
PiCCO control hrs of ventilation 12.6 15.4 P=0.002 Time to discharge 25 hrs 33 hrs P=0.03
 
 
Correlation - again
 
Results Neurology: Less vasospasm (55% vs 66%; p=0.03) Less DIND (32% vs 48%; p=0.03) Less vasospasm related infarcts (6% vs 14%,p=0.049) Medical complications 2% vs 12% (p=0.01)
Conclusions CVP is overrated PAC not good for routine use CO change may be more important than absolute values Estimating CO alone will probably not be enough Advanced hemodynamic monitoring can reduce complications and shorten ICU/hospital LOS

Haemodynamic monitoring

  • 1.
    Hemodynamic monitoring TobiasWitter This presentation has been adapted to optimise online viewing
  • 2.
    Agenda Status quoof our hemodynamic monitoring New devices How they work Outcome data – Do we need it? Discussion
  • 3.
    A brief –incomplete - history 1870 Adolf Fick postulated his principle for CO measurement 1929 Werner Forssman devised a method to get mixed venous blood from a man 1930 Otto Klein was the first to draw mixed venous blood and calculate CO 1967 Thermistor tipped catheter for CO measurement 1970 Swan and Ganz added ballon
  • 4.
  • 5.
  • 6.
  • 7.
    A randomized, controlledtrial of the use of Pulmonary Artery Catheters in High-Risk Surgical Patients. Sandham et al (CCCTG) NEJM 2003; 348.
  • 8.
  • 9.
  • 10.
  • 11.
  • 12.
  • 13.
    Hemodynamic Monitoring -Status quo: HR, BP, SaO 2 , clinical findings Lactate Echo, IVC? CVP , ScvO 2 , invasive arterial pressure PAC
  • 14.
  • 15.
  • 16.
    . Stroke volumeVentricular preload normal heart failing heart preload-dependence preload-independence
  • 17.
    R (CVP/BV) =0.16 ROC (ΔCVP/CO) = 0.56
  • 18.
    Cardiac output Ficksprinciple Waveform analysis Stroke volume Bioimpedance Thermodilution
  • 19.
    Bioimpedance Current ofknown amplitude and frequency Measures changes in voltage (thoracic resistance) = Impedance Z Change of Z is triggered by changes in aortic blood flow
  • 20.
    blood flow pulsecontour is roughly triangular in time SV is proportional to peak flow x VET, therefore proportional to max change of Z x VET SV = (L/Z)2x VET x dZo/dtmax, where L is the distance between the electrodes on the body surface
  • 21.
  • 22.
  • 23.
    Bioreactance Phase shiftdue to blood volume in aorta SV can be expressed as: SV = C x VET x dΦ/dtmax where C is a constant of proportionality.
  • 24.
  • 25.
  • 26.
    Bioreactance - CheetahNICOM and CPB (pig model): Good correlation, regardless of acute changes and temperature swings
  • 27.
    Limitations Depending onassumption that the area under the flow pulse is proportional to the product of peak flow and VET Not always like that (low flow) Different type of bypass in animal studies Tested against SGC - thermodilution technique may not actually provide an accurate value for comparison
  • 28.
  • 29.
  • 30.
    Flotrac - VigileoPulse contour analysis CO=HRxSV Flotrac=PR x (σAP x χ) χ is dependent on: PR, MAP, σAP Patient demographics Skewness and Kurtosis
  • 31.
    Pulse contour -problems Compliance of aorta not constant Wave reflection: depending on distance from heart, age Damping – good wave form needed – clinically wave forms are often over or underdamped Aortic flow in systole (intermittend vs. continous)
  • 32.
    Ideal system Independentof arterial location Would correct for aortic unlinearity Independent on SVR eg reflection Not dependent on wave morphology Not affected by damping of wave form
  • 33.
    LiDCO Principles Conservationof mass/power Assumption: Net power change is the input of mass of blood minus the blood mass lost to periphery The relation between net power and net flow is linear, once calibration and correction for compliance has been done
  • 34.
  • 35.
    Pulse Pressure Pulsepressure: fluctuation of blood pressure around mean caused by stroke volume
  • 36.
    LiDCO – 5steps 1. Pressure signal is transformed into a standardized volume waveform: dV/dBP=calibration x 250 x e -kxBP 2. Autocorrelation derives beat pulse period and beat power factor - which is proportional to the ejected “nominal” stroke volume
  • 37.
  • 38.
    LiDCO – 5steps 3. Nominal SV can be scaled against the actual SV with indicator dilution measurement 4. Calibration factor corrects for arterial tree compliance at any given pressure and corrects for interindividual differences 5. Calibration factor changes saturation volume
  • 39.
  • 40.
    Potential Benefits Analyzesthe whole beat – not only systole Because the whole beat is analyzed, independent of site and reflection wave Autocorrelation is time based – not frequency based. Therefore less dependent on damping as frequency based methods System can be calibrated with any form of CO measurement
  • 41.
    Limitations The performanceof the software may be compromised in the following patient groups: Patients with aortic valve regurgitation Following aortic reconstruction - a recalibration is required Patients being treated with an intra aortic balloon pump Patients with highly damped peripheral arterial lines Patients with pronounced peripheral arterial vasoconstriction Cardiac arrythmias (SPV, PPV% and SVV%)
  • 42.
    PiCCO-way it worksTranspulmonary thermodilution
  • 43.
  • 44.
  • 45.
    PiCCO-way it worksCO is calculated with the Stewart-Hamilton equation Curve is then transformed into a logarithmic form and with the MTt and DSt are determined
  • 46.
  • 47.
  • 48.
  • 49.
  • 50.
  • 51.
    Results…. R=used asReference method, s=stable conditions, PAC-CC0 PiCCO LiDCO NiCOM Flotrac Squara, 2007 X (R) X R=0.82 (s) Marque, 2009 X (R) X X R=0.77 (s) Ni, R=0.69 (s) Flo Mayer, 2008 X (R) X Rel. Err 24.6% Raval, 2008 X (R) X R=0.78 (s) Squara, 2009 X (R) X R=0.76 McCoy, 2009 X (R) X Good bias, large SD
  • 52.
  • 53.
  • 54.
    Results Postoperative Complications44% vs 68% (0.003) Length of Hospital Stay: Mean 17.5 vs 29.5 days (0.001) Median 11 vs 14 days (0.001) No difference in ICU LOS No difference in 28 and 60 day mortality
  • 55.
  • 56.
  • 57.
    PiCCO control hrsof ventilation 12.6 15.4 P=0.002 Time to discharge 25 hrs 33 hrs P=0.03
  • 58.
  • 59.
  • 60.
  • 61.
  • 62.
    Results Neurology: Lessvasospasm (55% vs 66%; p=0.03) Less DIND (32% vs 48%; p=0.03) Less vasospasm related infarcts (6% vs 14%,p=0.049) Medical complications 2% vs 12% (p=0.01)
  • 63.
    Conclusions CVP isoverrated PAC not good for routine use CO change may be more important than absolute values Estimating CO alone will probably not be enough Advanced hemodynamic monitoring can reduce complications and shorten ICU/hospital LOS

Editor's Notes

  • #5 Problem: poor baseline matching – different APACHE II, different Creatinine, etc.
  • #6 French multicentre trial, 676 Patients, assigned to PAC or no PAC, treatment up to attending physician – no difference in 90 day mortality
  • #8 3803 pt screened, 1994 randomized, 997 pat each group, same mortality, no difference in mortality after 1 year. PAC-man trial in ICU population with similar results.
  • #9 535 critical care physicians working in 86 ICUs participated, multiple choice questionnaire consisting of 31 questions regarding all aspects of bedside pulmonary artery catheterization, The mean score of all respondents was 72.2 +/- 14.4%, significantly lower (p <.0001) in case of uncompleted postgraduate training (67.3 +/- 14.7%, lower quartile 56.7%, median 70.0%, upper quartile 76.7%), as compared with completed postgraduate training (76.1 +/- 13.0%, lower quartile 70.0%, median 80.0%, upper quartile 86.7%).
  • #12 retrospectively analyzed 373 patients, maximum EVLW was significantly higher in nonsurvivors (n= 186) than in survivors (n= 187) [median, 14.3 mL/kg vs 10.2 mL/kg, respectively; p < 0.001]
  • #15 188 ICU patients.
  • #17 Fluid responsiveness depends on compliance of heart and systolic function – both are usually unknown. Surprisingly in a retrospective study by Osman (Crit Care Med 2007) even the combination of CVP/PAOP and SVI didn’t predict fluid responsiveness very well.
  • #18 Of the 24 studies included in this analysis, 5 studies compared CVP with the measured circulating blood volume while 19 studies determined the relationship between CVP and change in cardiac performance following a fluid challenge (generally defined as a 10 to 15% increase in stroke index/cardiac index). In all, 830 patients across a spectrum of medical and surgical disciplines were studied. Regression for CVP-BV is 0.16. the pooled area under the ROC curve was 0.56 for (ΔCVP).
  • #19 Z is aortic impedance – variable.
  • #20 Dependent on amount of fluid in chest, vet=ventricular ejection time; Unlike bioimpedance, bioreactance-based noninvasive CO measurement does not use the static impedance Zo and does not depend on the distance between the electrodes L for the calculations of SV and CO, which significantly reduces the uncertainty in the result.
  • #21 Dependent on amount of fluid in chest, vet=ventricular ejection time; Unlike bioimpedance, bioreactance-based noninvasive CO measurement does not use the static impedance Zo and does not depend on the distance between the electrodes L for the calculations of SV and CO, which significantly reduces the uncertainty in the result.
  • #22 In addition to changing resistance to blood flow ( Zo), changes in intrathoracic volume also produce changes in electrical capacitive and inductive (i.e., bioreactance) properties that result in phase shifts of the received signal relative to the applied signal.
  • #23 Although clinical utility has been increasingly recognized in some clinical settings (13, 14), bioimpedance has been found to be inaccurate in intensive care units (ICUs) and other settings where significant electrical noise and body motion exist (5, 9). Also, the technique is sensitive to placement of the electrodes on the body, variations in patient body size, and other physical factors that impact on electrical conductivity between the electrodes and skin (e.g., temperature and humidity).
  • #24 Within each sticker, one electrode is used by the high-frequency current generator to inject the high-frequency sine wave into the body, while the other electrode is used by the voltage input amplifier. Two stickers are placed on the right side of the body, and two stickers are placed on the left side of the body. The stickers on a given side of the body are paired, so that the currents are passed between the outer electrodes of the pair and voltages are recorded from between the inner electrodes. A noninvasive CO measurement signal is thus determined separately from each side of the body, and the final noninvasive CO measurement signal is obtained by averaging these two signals.
  • #26 high-frequency (75 kHz) sine wave generator and four dualelectrode “stickers” that are used to establish electrical contact with the body. Within each sticker, one electrode is used by the high-frequency current generator to inject the high-frequency sine wave into the body, while the other electrode is used by the voltage input amplifier. Two stickers are placed on the right side of the body, and two stickers are placed on the left side of the body. The stickers on a given side of the body are paired, so that the currents are passed between the outer electrodes of the pair and voltages are recorded from between the inner electrodes. A noninvasive CO measurement signal is thus determined separately from each side of the body, and the final noninvasive CO measurement signal is obtained by averaging these two signals.
  • #27 Measurement of CO and, sometimes more importantly, changes in CO can be extremely useful when assessing circulatory function Bioimpedance: To investigate the validity of thoracic bioimpedance, numerous studies have compared the results obtained from thoracic bioimpedance with values obtained from reference methods in different research settings. Some studies have reported very good correlations (6), while others have reported relatively poor correlations (8)
  • #29 Skewness: a measure for lack of symmetry – e.g: an arterial pressure waveform in which the data points increase quickly in systole and fall slowly can result as an increase in vasoconstriction and would have increased skewness. Kurtosis: a measure of how peaked or flat the pressure data points are distributed from normal distribution
  • #31 σAP = standard deviation of arterial pressure
  • #36 The change in power during a single cardiac cycle should therefore be determined by stroke volume (input of mass) and the distribution of blood from the aorta into the peripheral circulation (removal of mass).
  • #37 Kurve factor is not changed with calibration – less influence of change of intravascular volume
  • #46 MTt mean transit time (half the indicator has passed) DSt downslope time (exponential downslope time) = The product of CO x DSt represents the largest individual mixing volume in a series of indicator mixing chambers.
  • #48 GEDV and ITBV are correlated via a fixed equation.
  • #52 Squara 2007, 110 pt., 65888 paired CO measurements, good correlation when stable, good prediction of change Marque 2009, 29 pt, 12099 simultanous measurements for each device, precision equal in all systems (8%) – therefore the reported realtive error of less than 30% (20%) in only 94% (79%) of patients (NiCOM) and 91% and 79% (Vigileo) are unaccabtable – but maybe change is more important than absolute value Mayer 2008, 40pt, 282 data pairs, rel error lower in ICU than in Ormeasurement with in the set limits of below 30% (20.7% in ICU, 28.4% in OR) Raval 2008, 111pt, 5 sites, ICU and Cath-lab, good correlation Squara2009, 20 pt, baseline and PEEP challenge, good correlation PiCCO quicker in detection of changes (NS), both systems showed the same decrease in CO
  • #53 Sixty-two patients were randomised to GDT and 60 patients to control treatment, primary outcome postop complications,
  • #56 40 pt for elective CABG-Sx, CVP + radial art line in one patient, central line with PiCCO femoral artery in GDT group
  • #57 1. Total cumulative amount of norepinephrine therapy during surgery and intensive care unit treatment. GDT Goal-directed therapy; EOS end of surgery. All values are expressed as mean ±SEM; ∗ p<0.01 2. Total cumulative amount of epinephrine therapy during surgery and intensive care unit treatment. GDT Goal-directed therapy; EOS end of surgery. All values are expressed as mean ±SEM; ∗ p<0.01
  • #59 67 studies overall (all fields of monitoring), 40 on hemodynamic monitoring (PAC, gastric tonometrie, CVP, DO2/VO2, ScvO2, mixed venous, EVLW, etc) no overall data for benefit, problem: probably biased, patients are not sick enough?
  • #60 Patients were randomly allocated to receive either PiCCO-guided management or institutional standard management using a central venous catheter and PAC, 263 measurements were recorded over a mean of, 61 days in the 16 patients with SAH
  • #61 Fairly good coefficients of correlation (r) , of TPCI or PCCI with PACI ( r=0.85, P=0.0001 and r0.77,P=0.0001), PACI = PAC, TPCI=transpulmonary, PCCI=calibrate pulse contour.
  • #63 DIND=delayed ischemic neurological deficit