The document provides step-by-step instructions for making a graph:
1) Collect data in a table, determine the range of values, and whether the independent variable goes on the x-axis and dependent on y-axis.
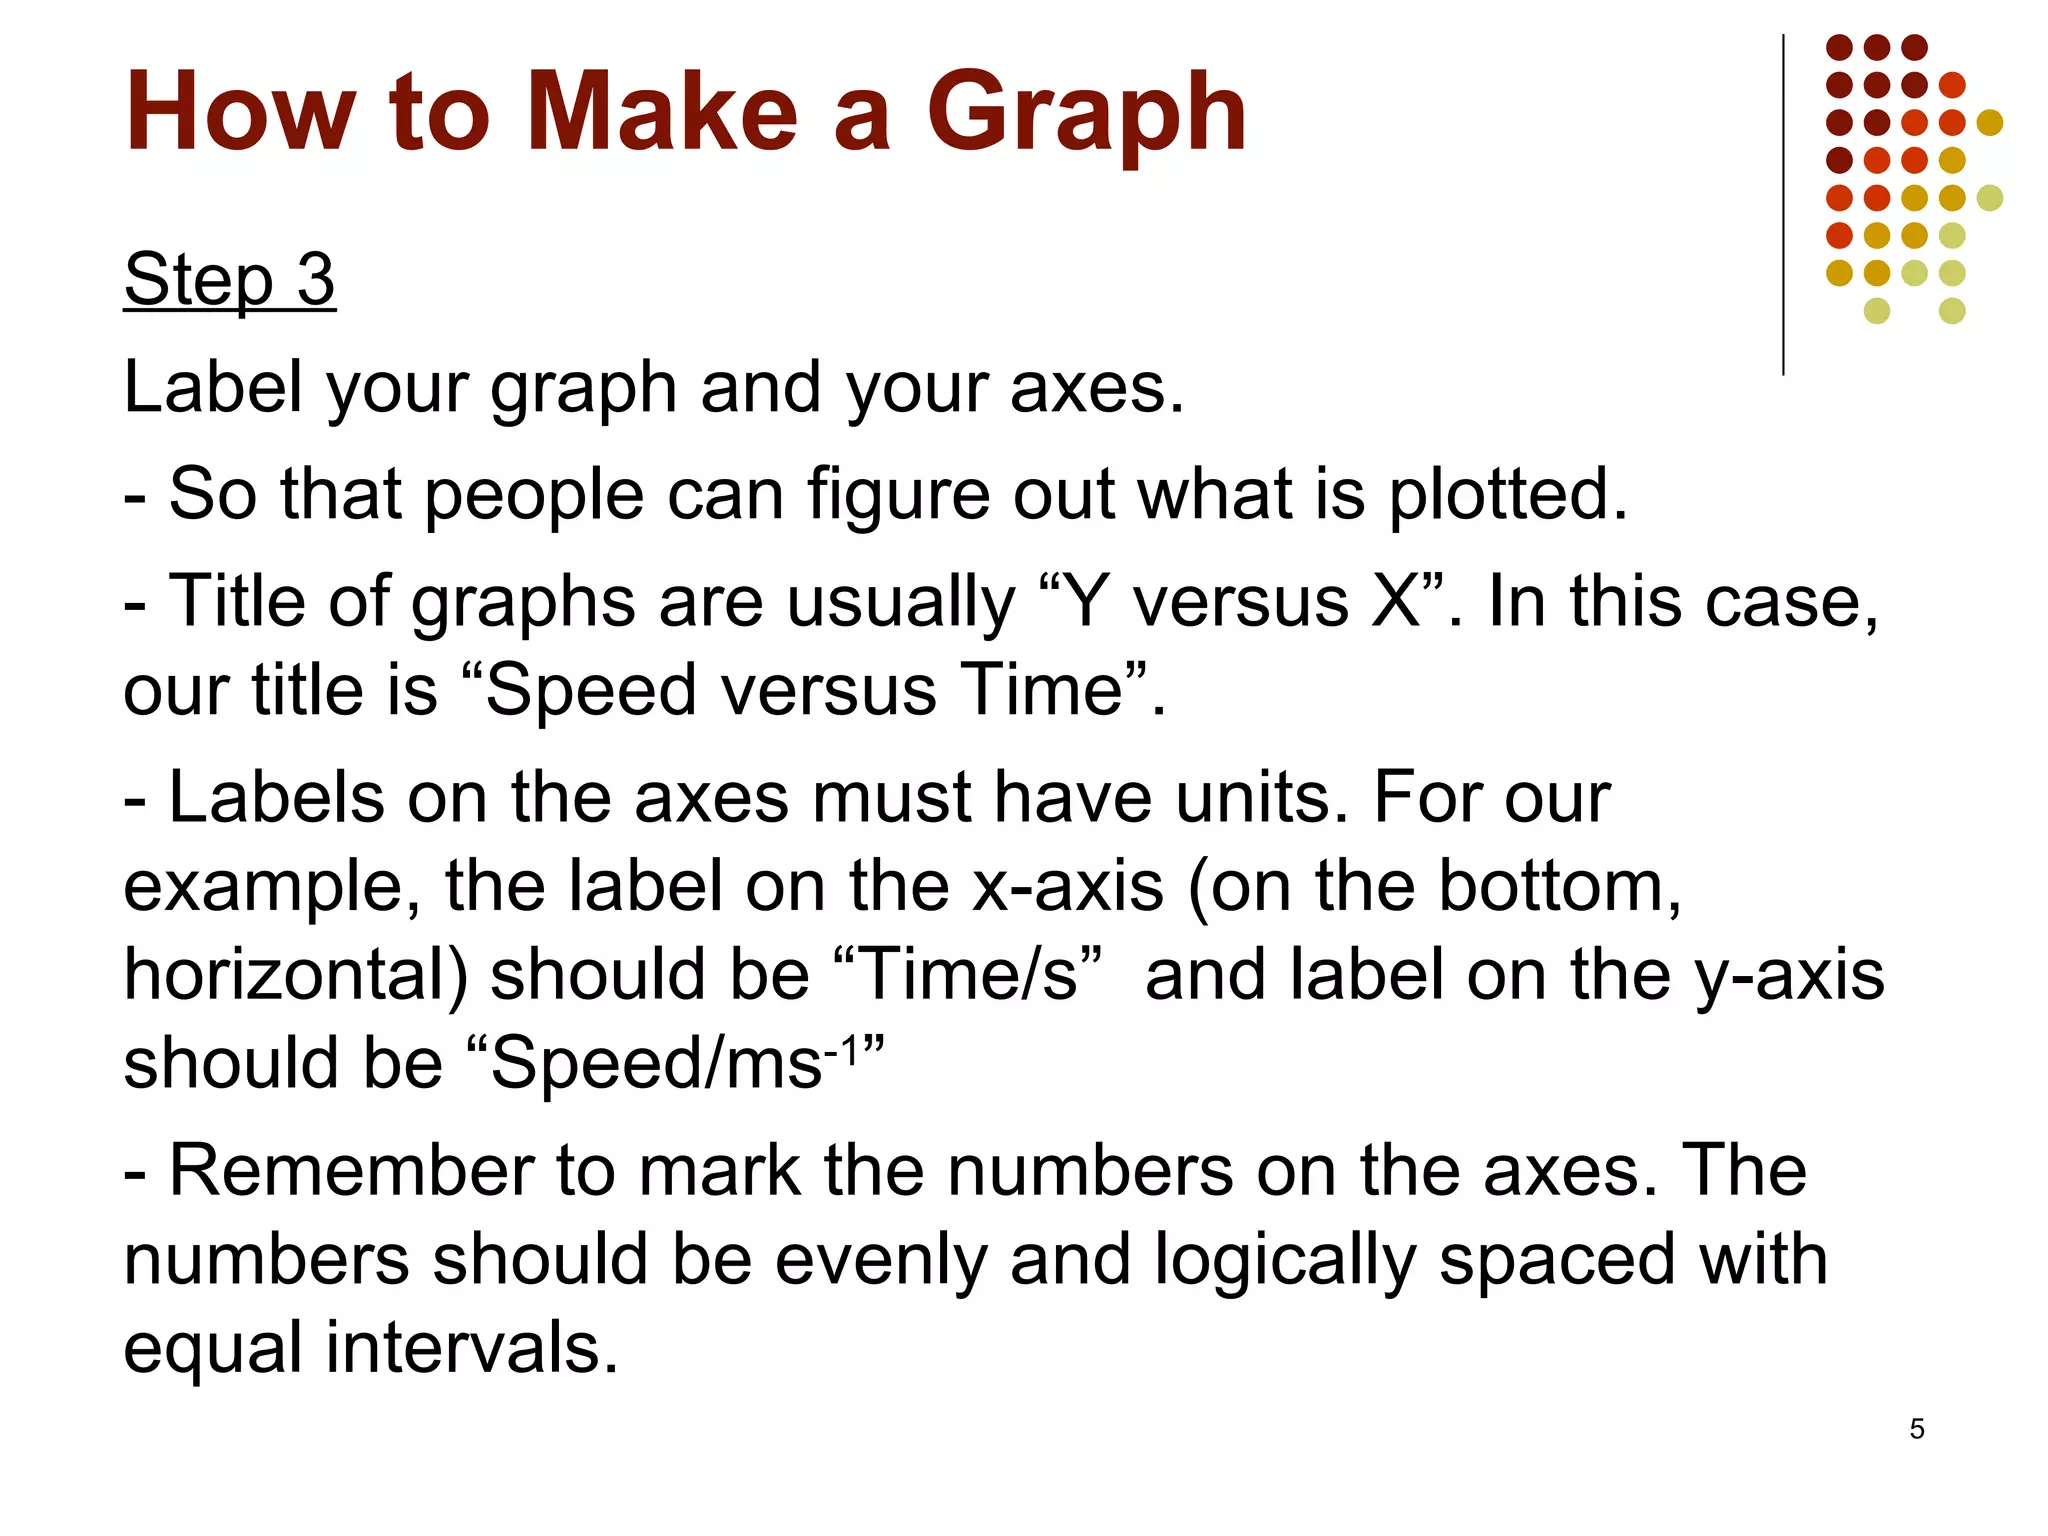
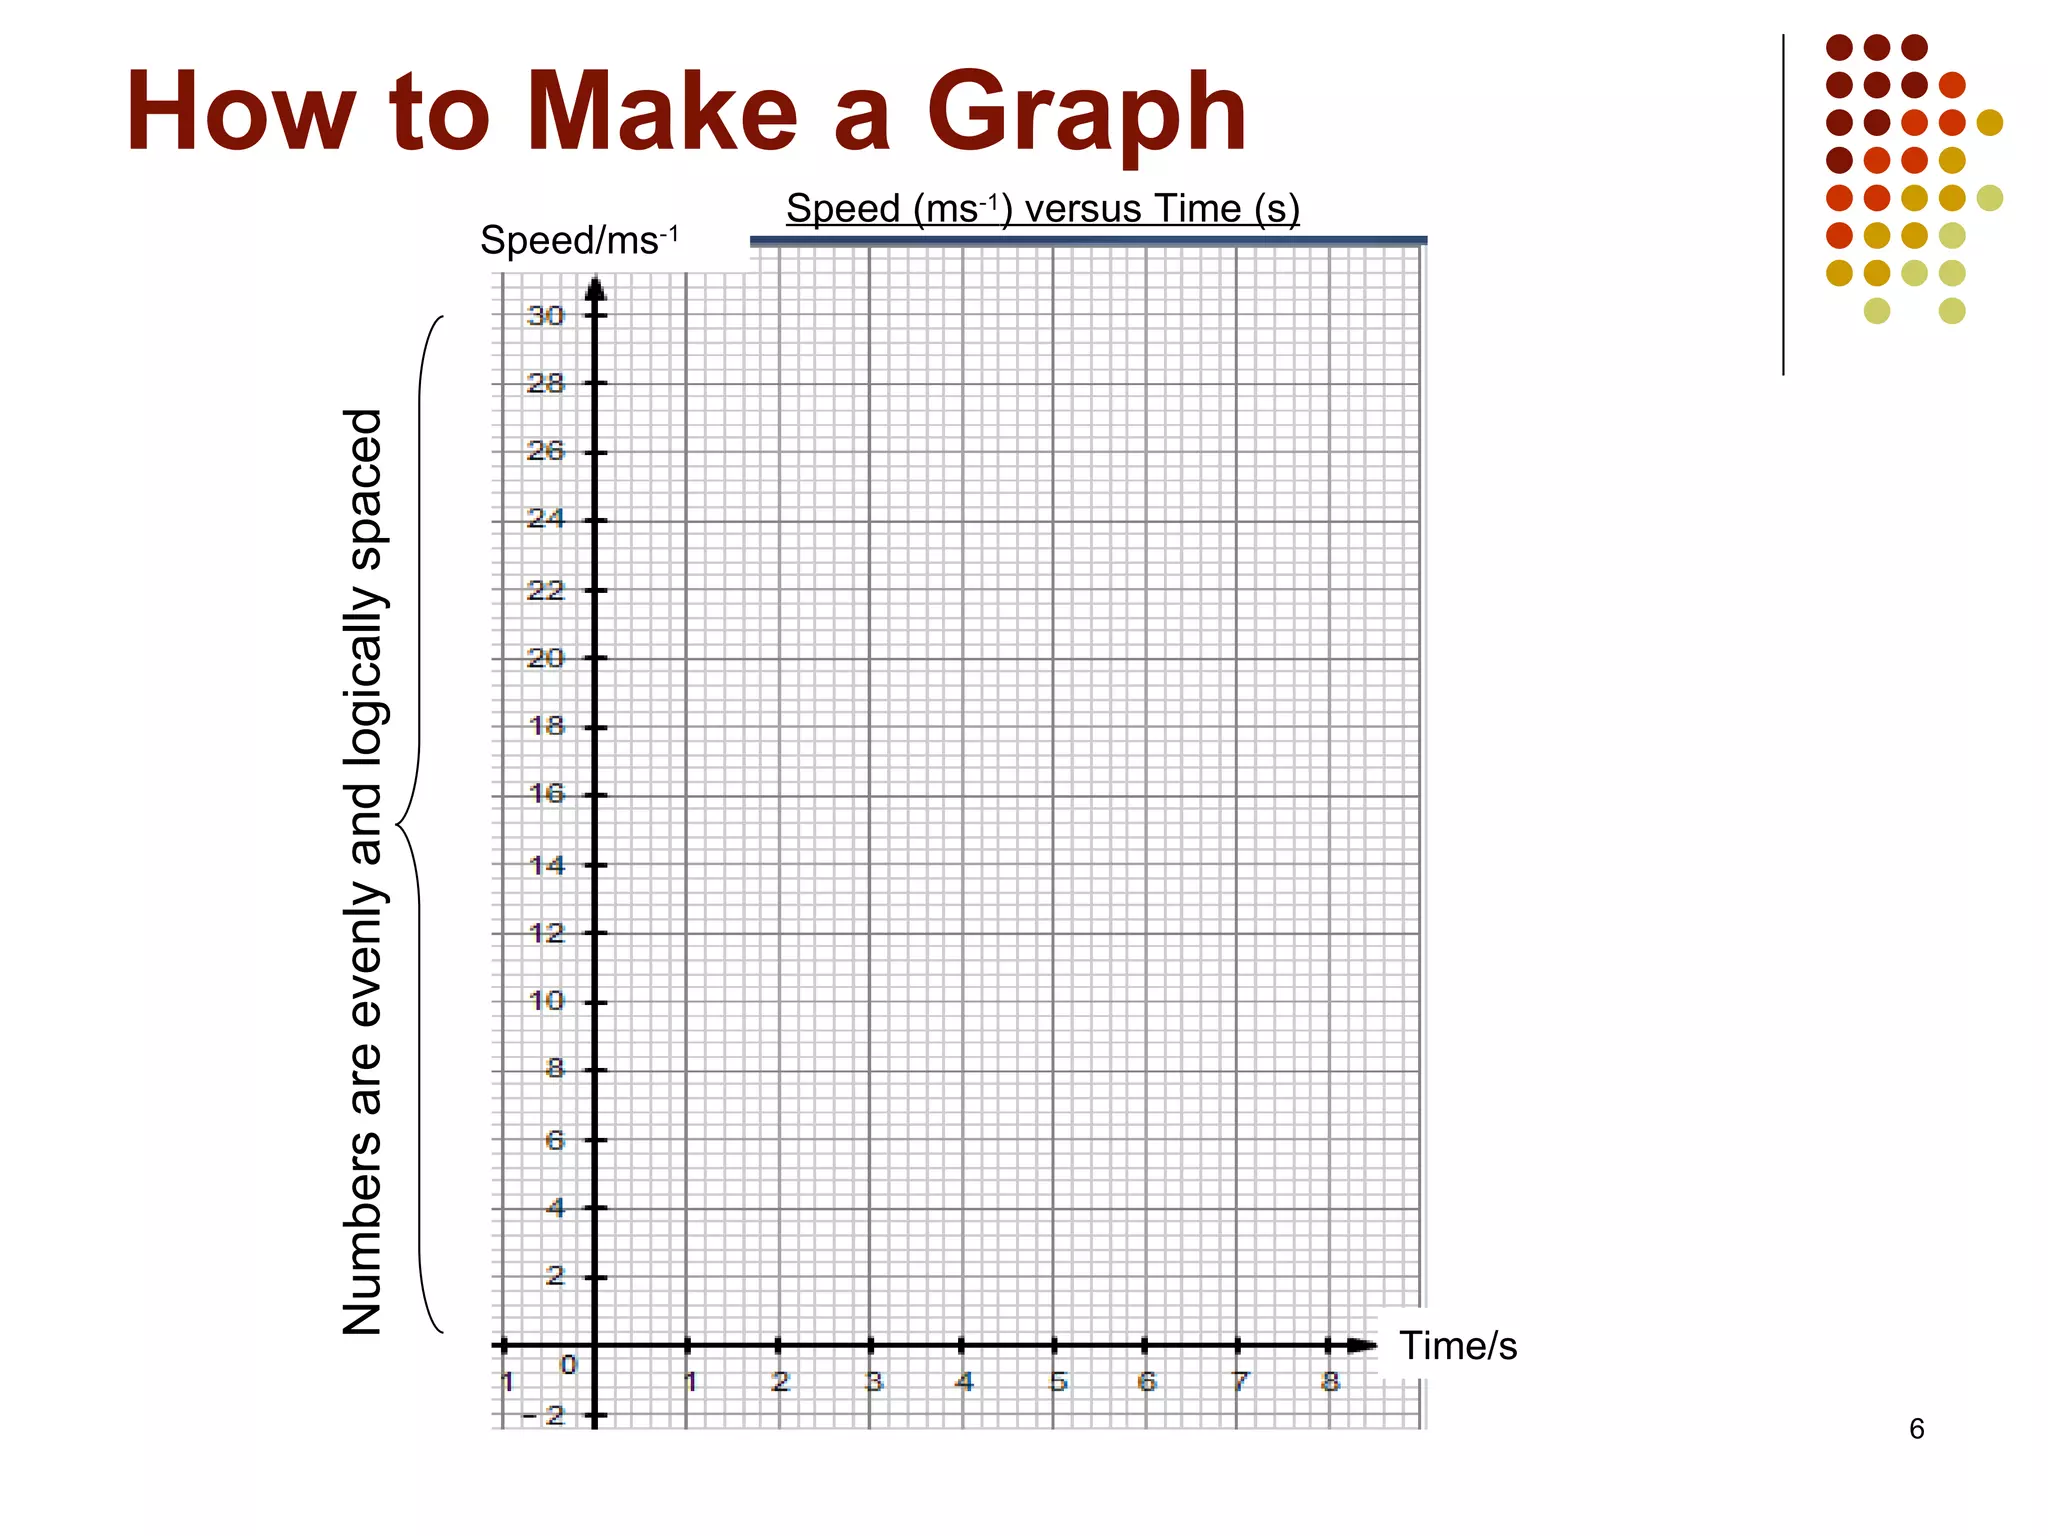
2) Label the graph with titles and units on each axis. Mark numbers on the axes at even intervals.
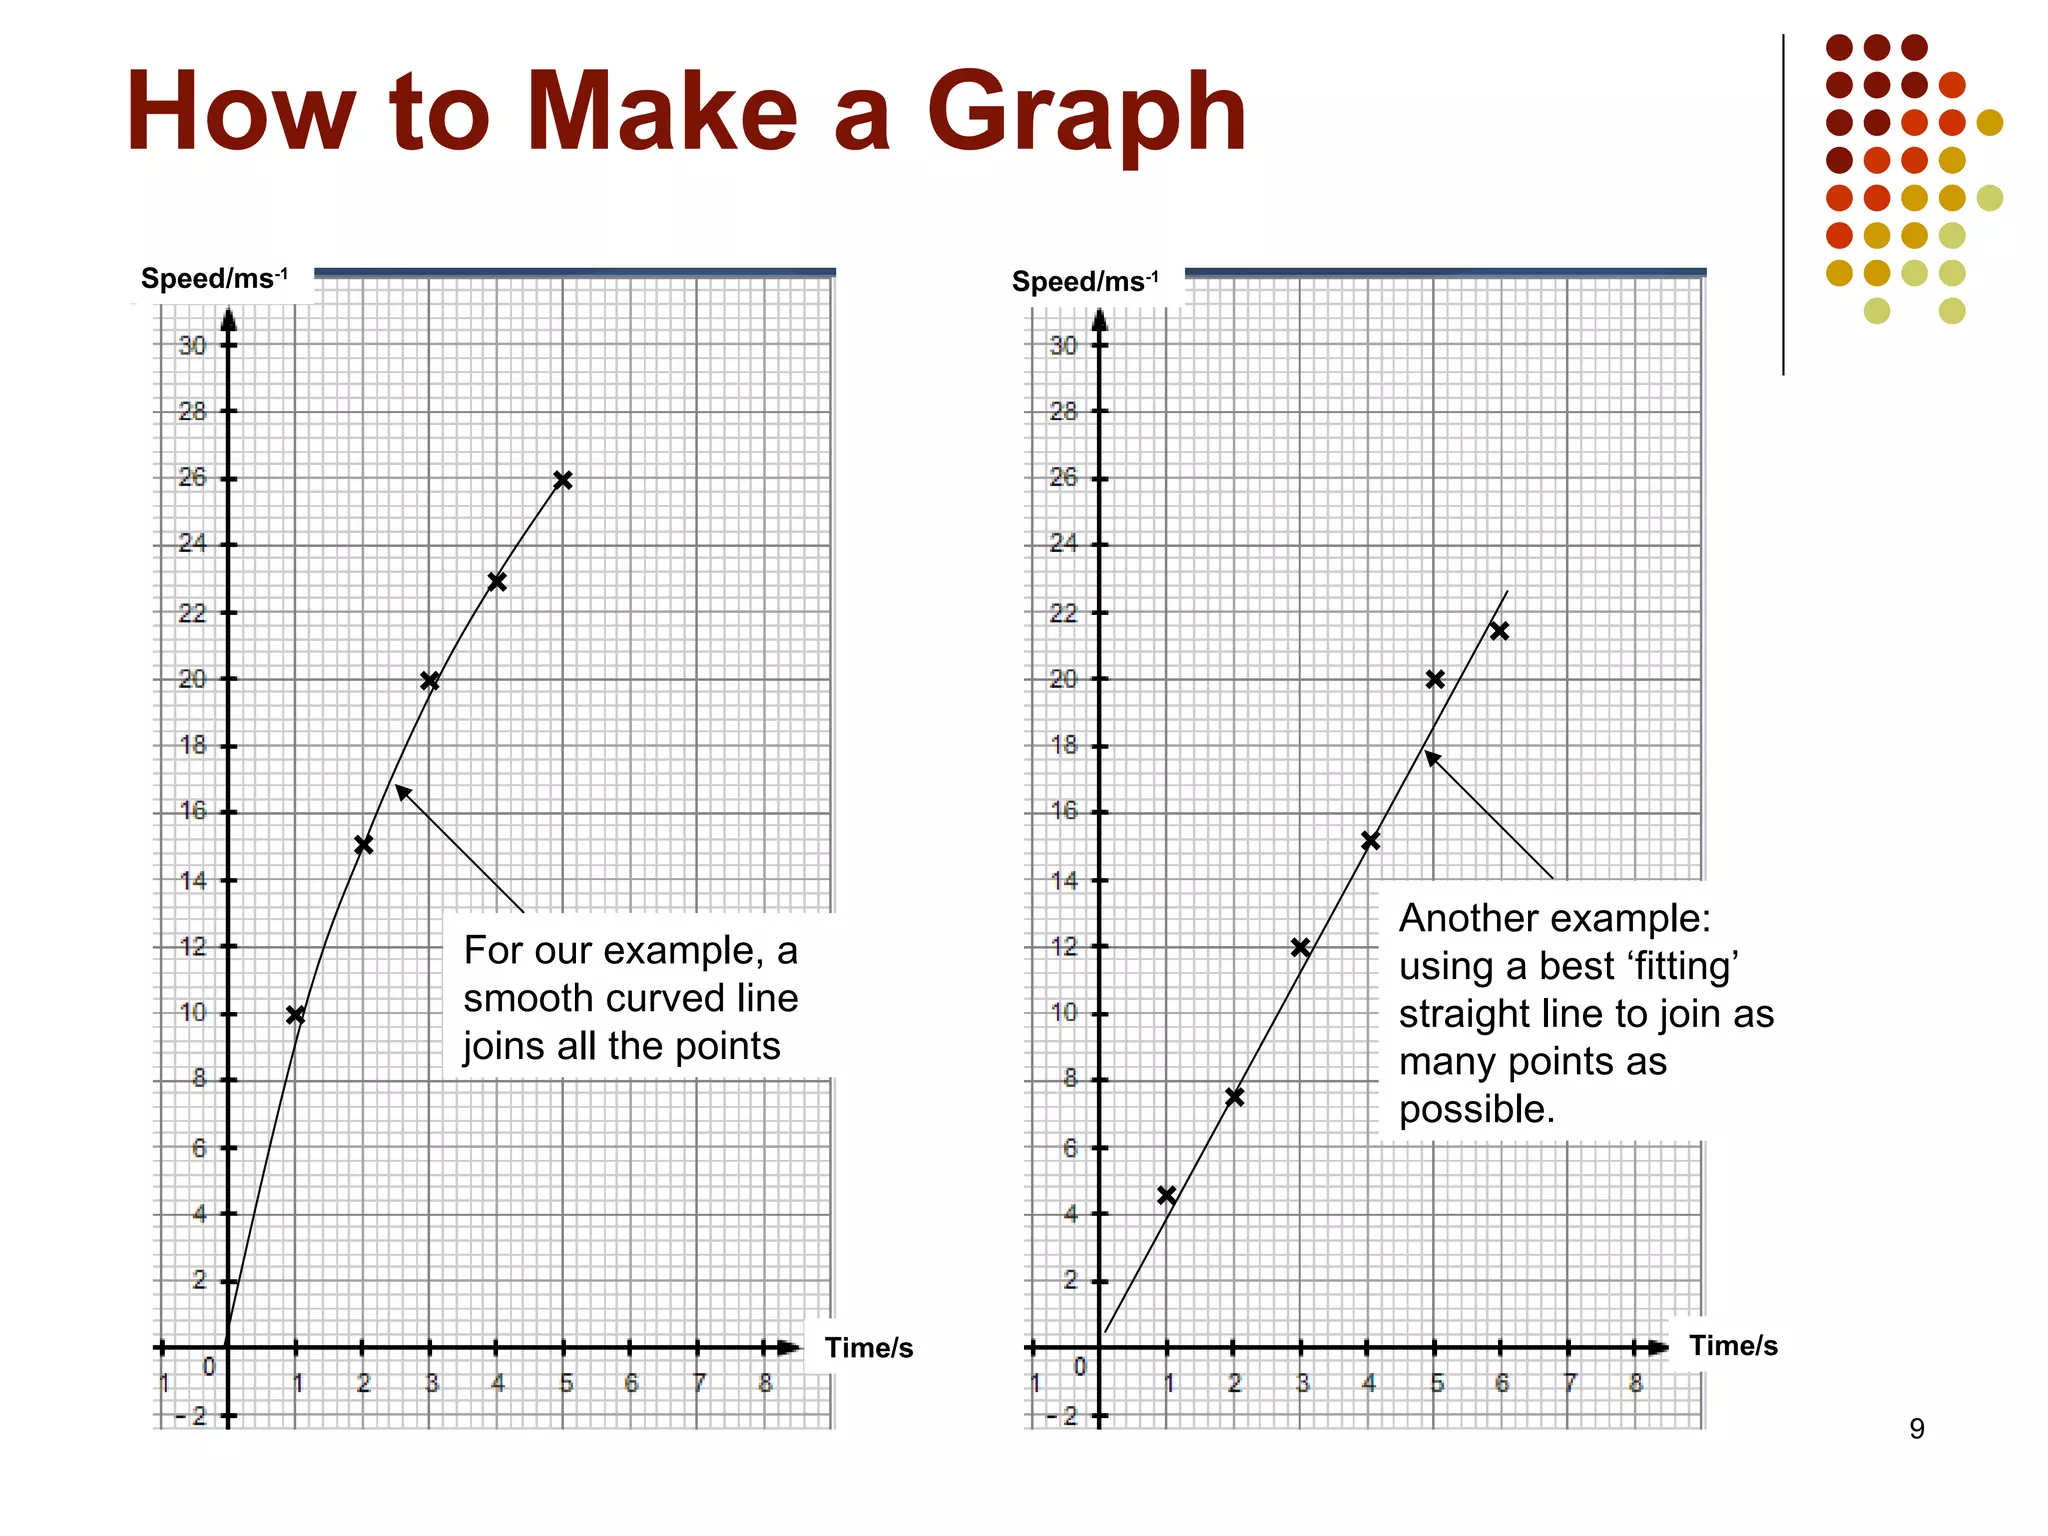
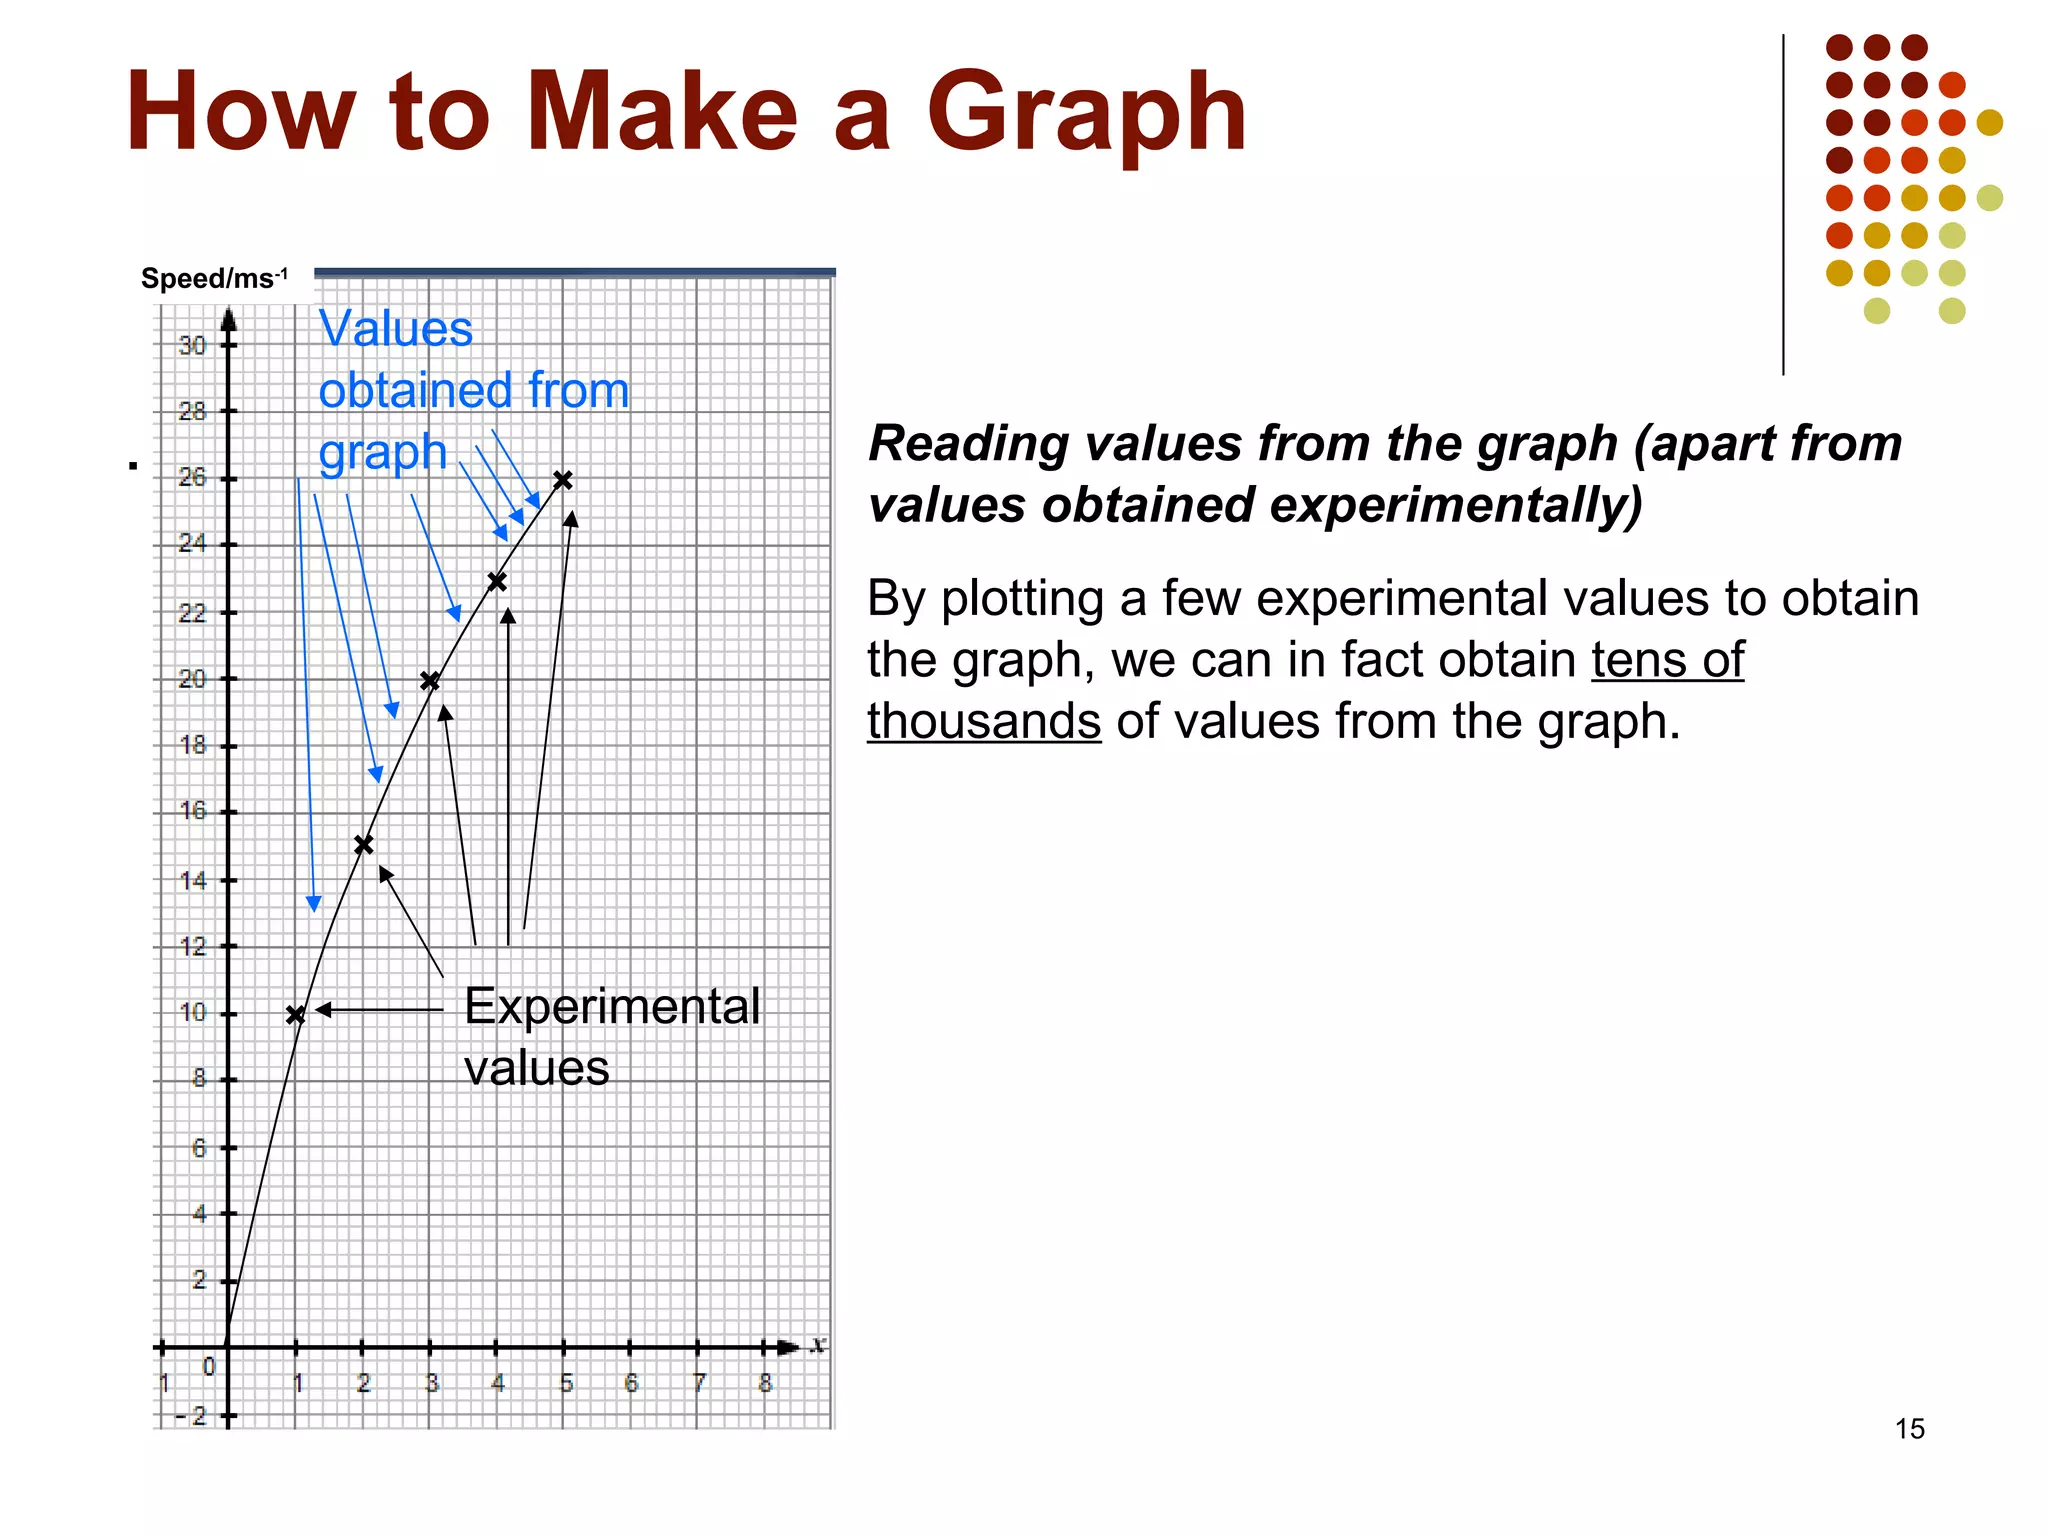
3) Plot the data points on the graph and draw a best-fit line through as many points as possible.