There are four main methods to graph linear equations:
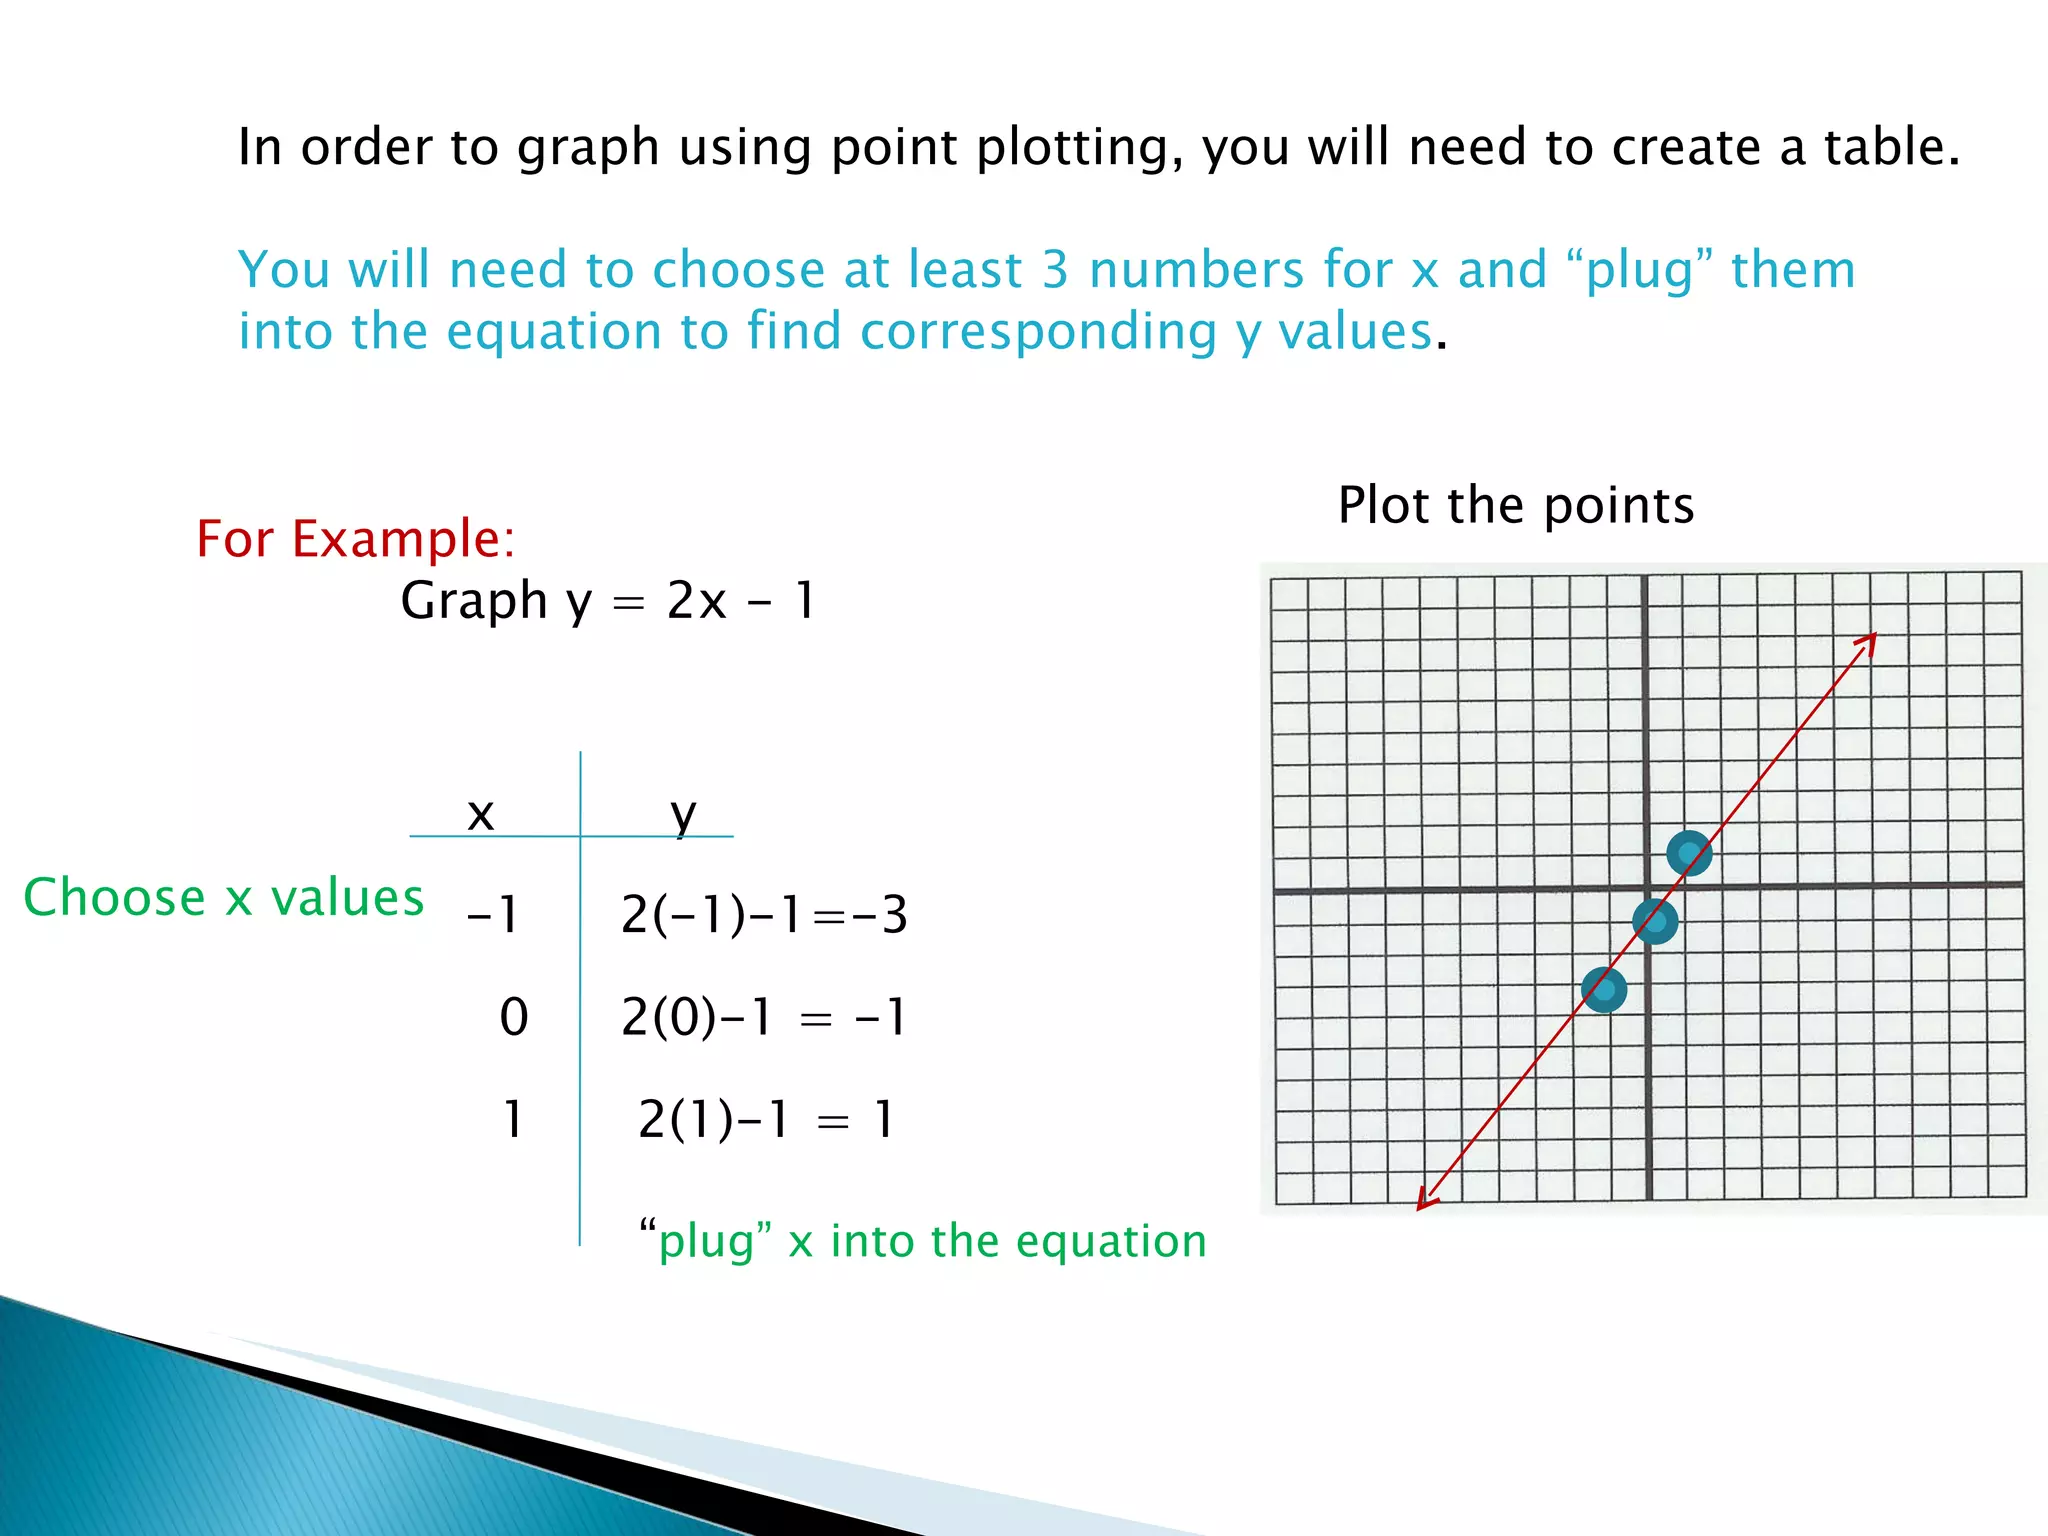
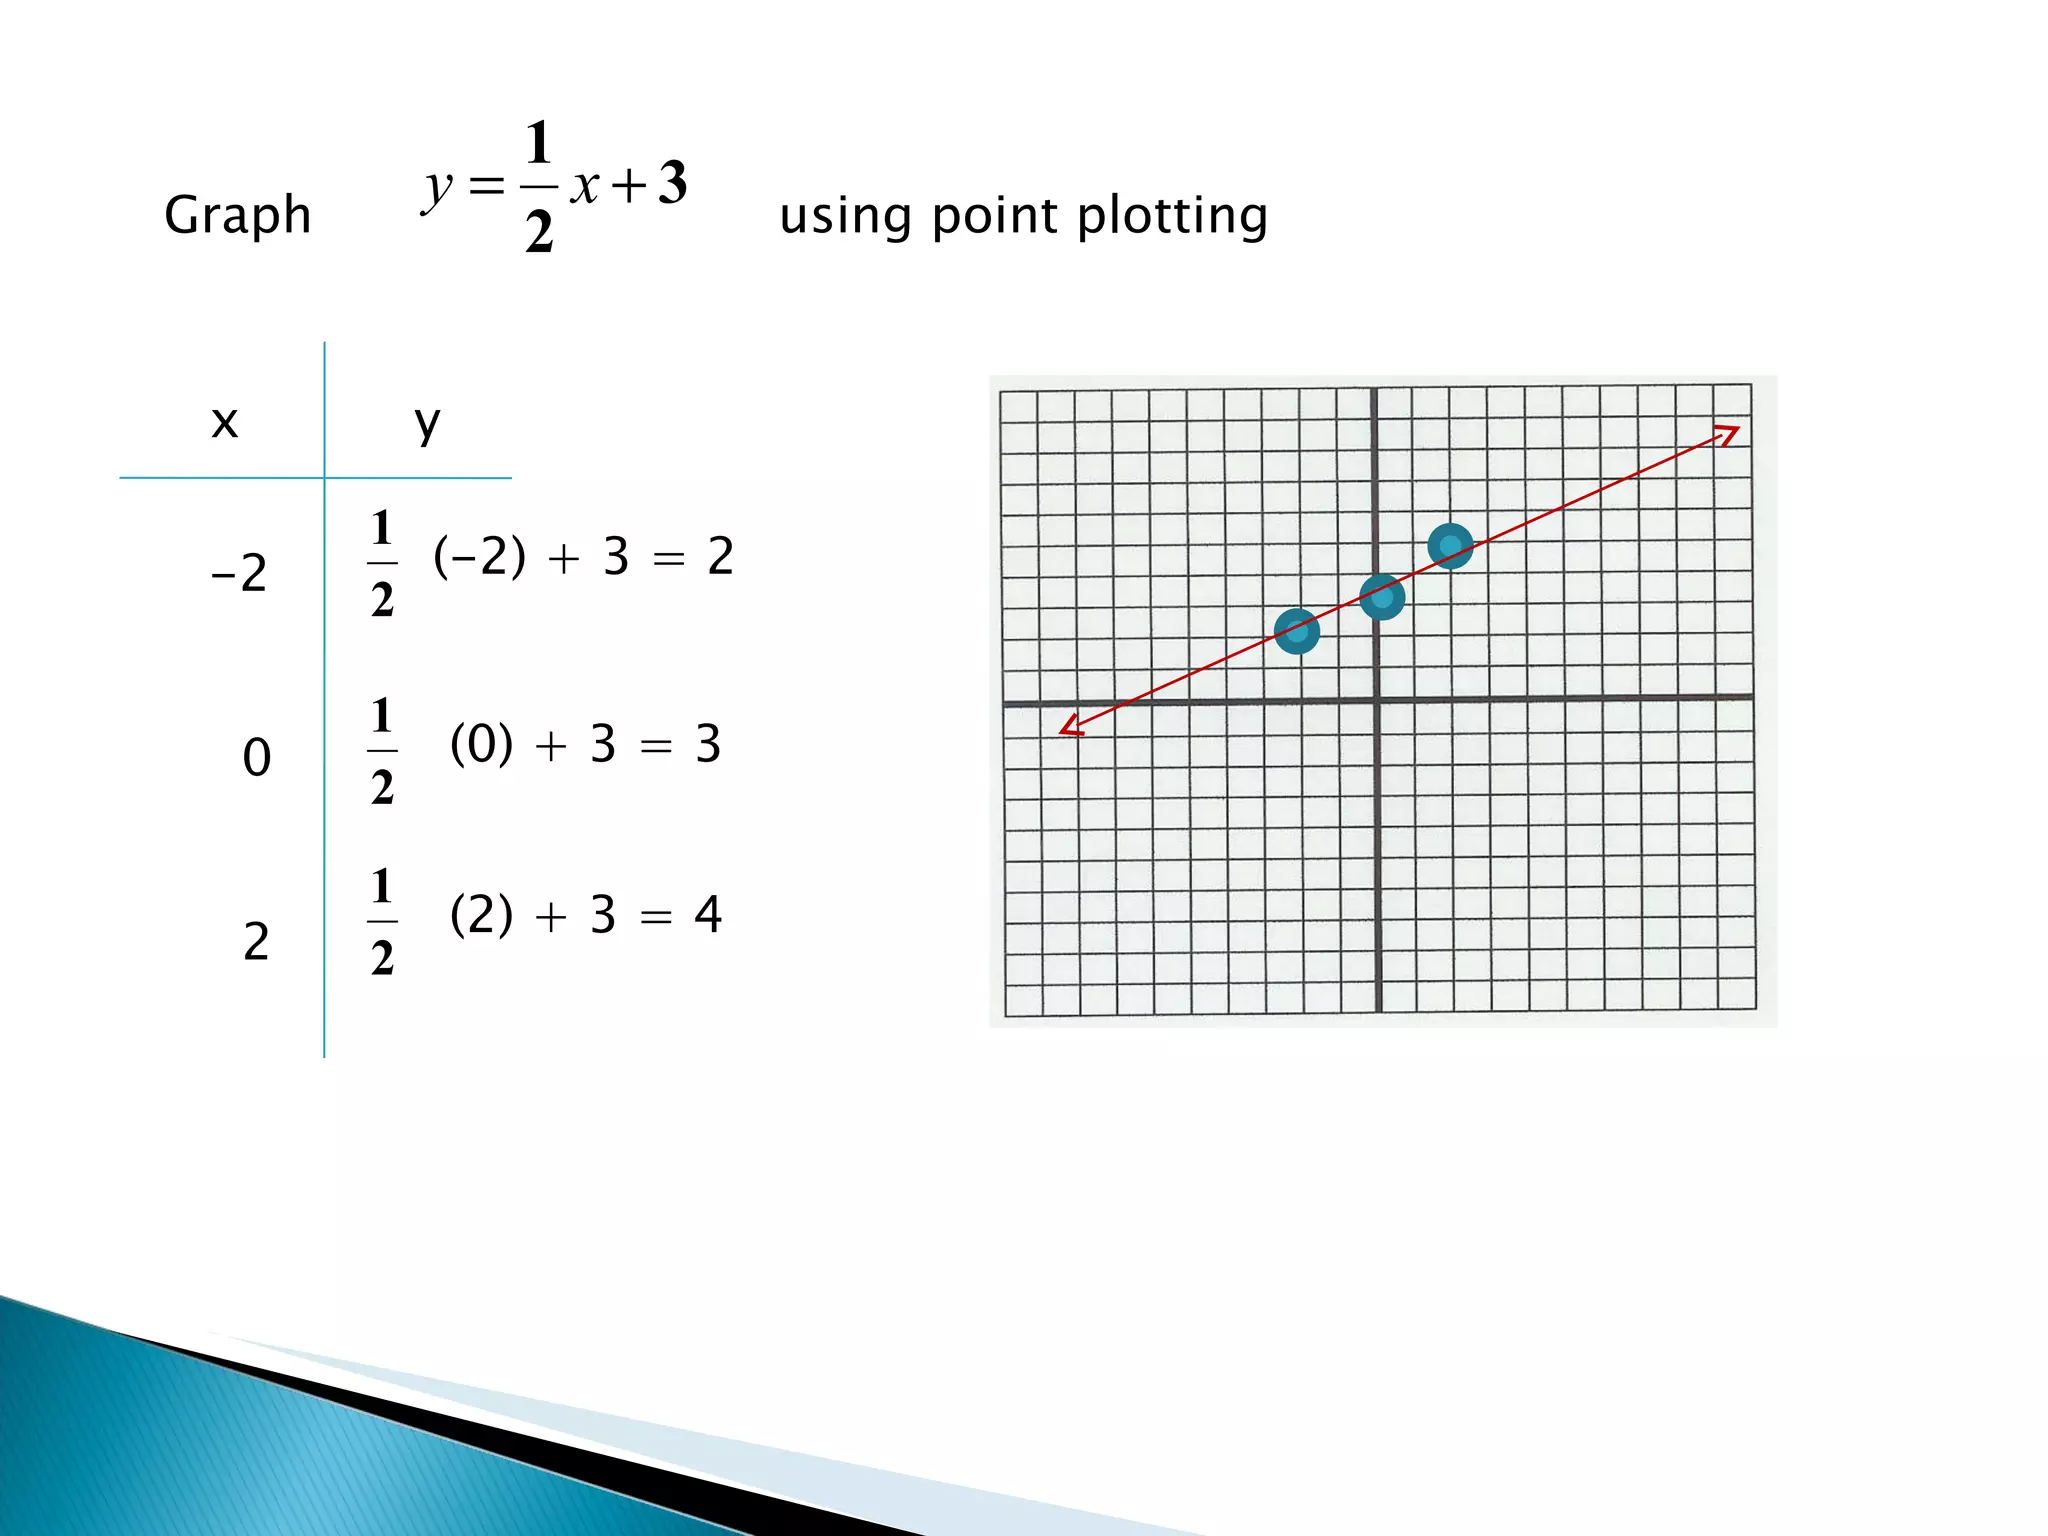
1) Point plotting involves choosing x-values, substituting them into the equation to find corresponding y-values, and plotting the points.
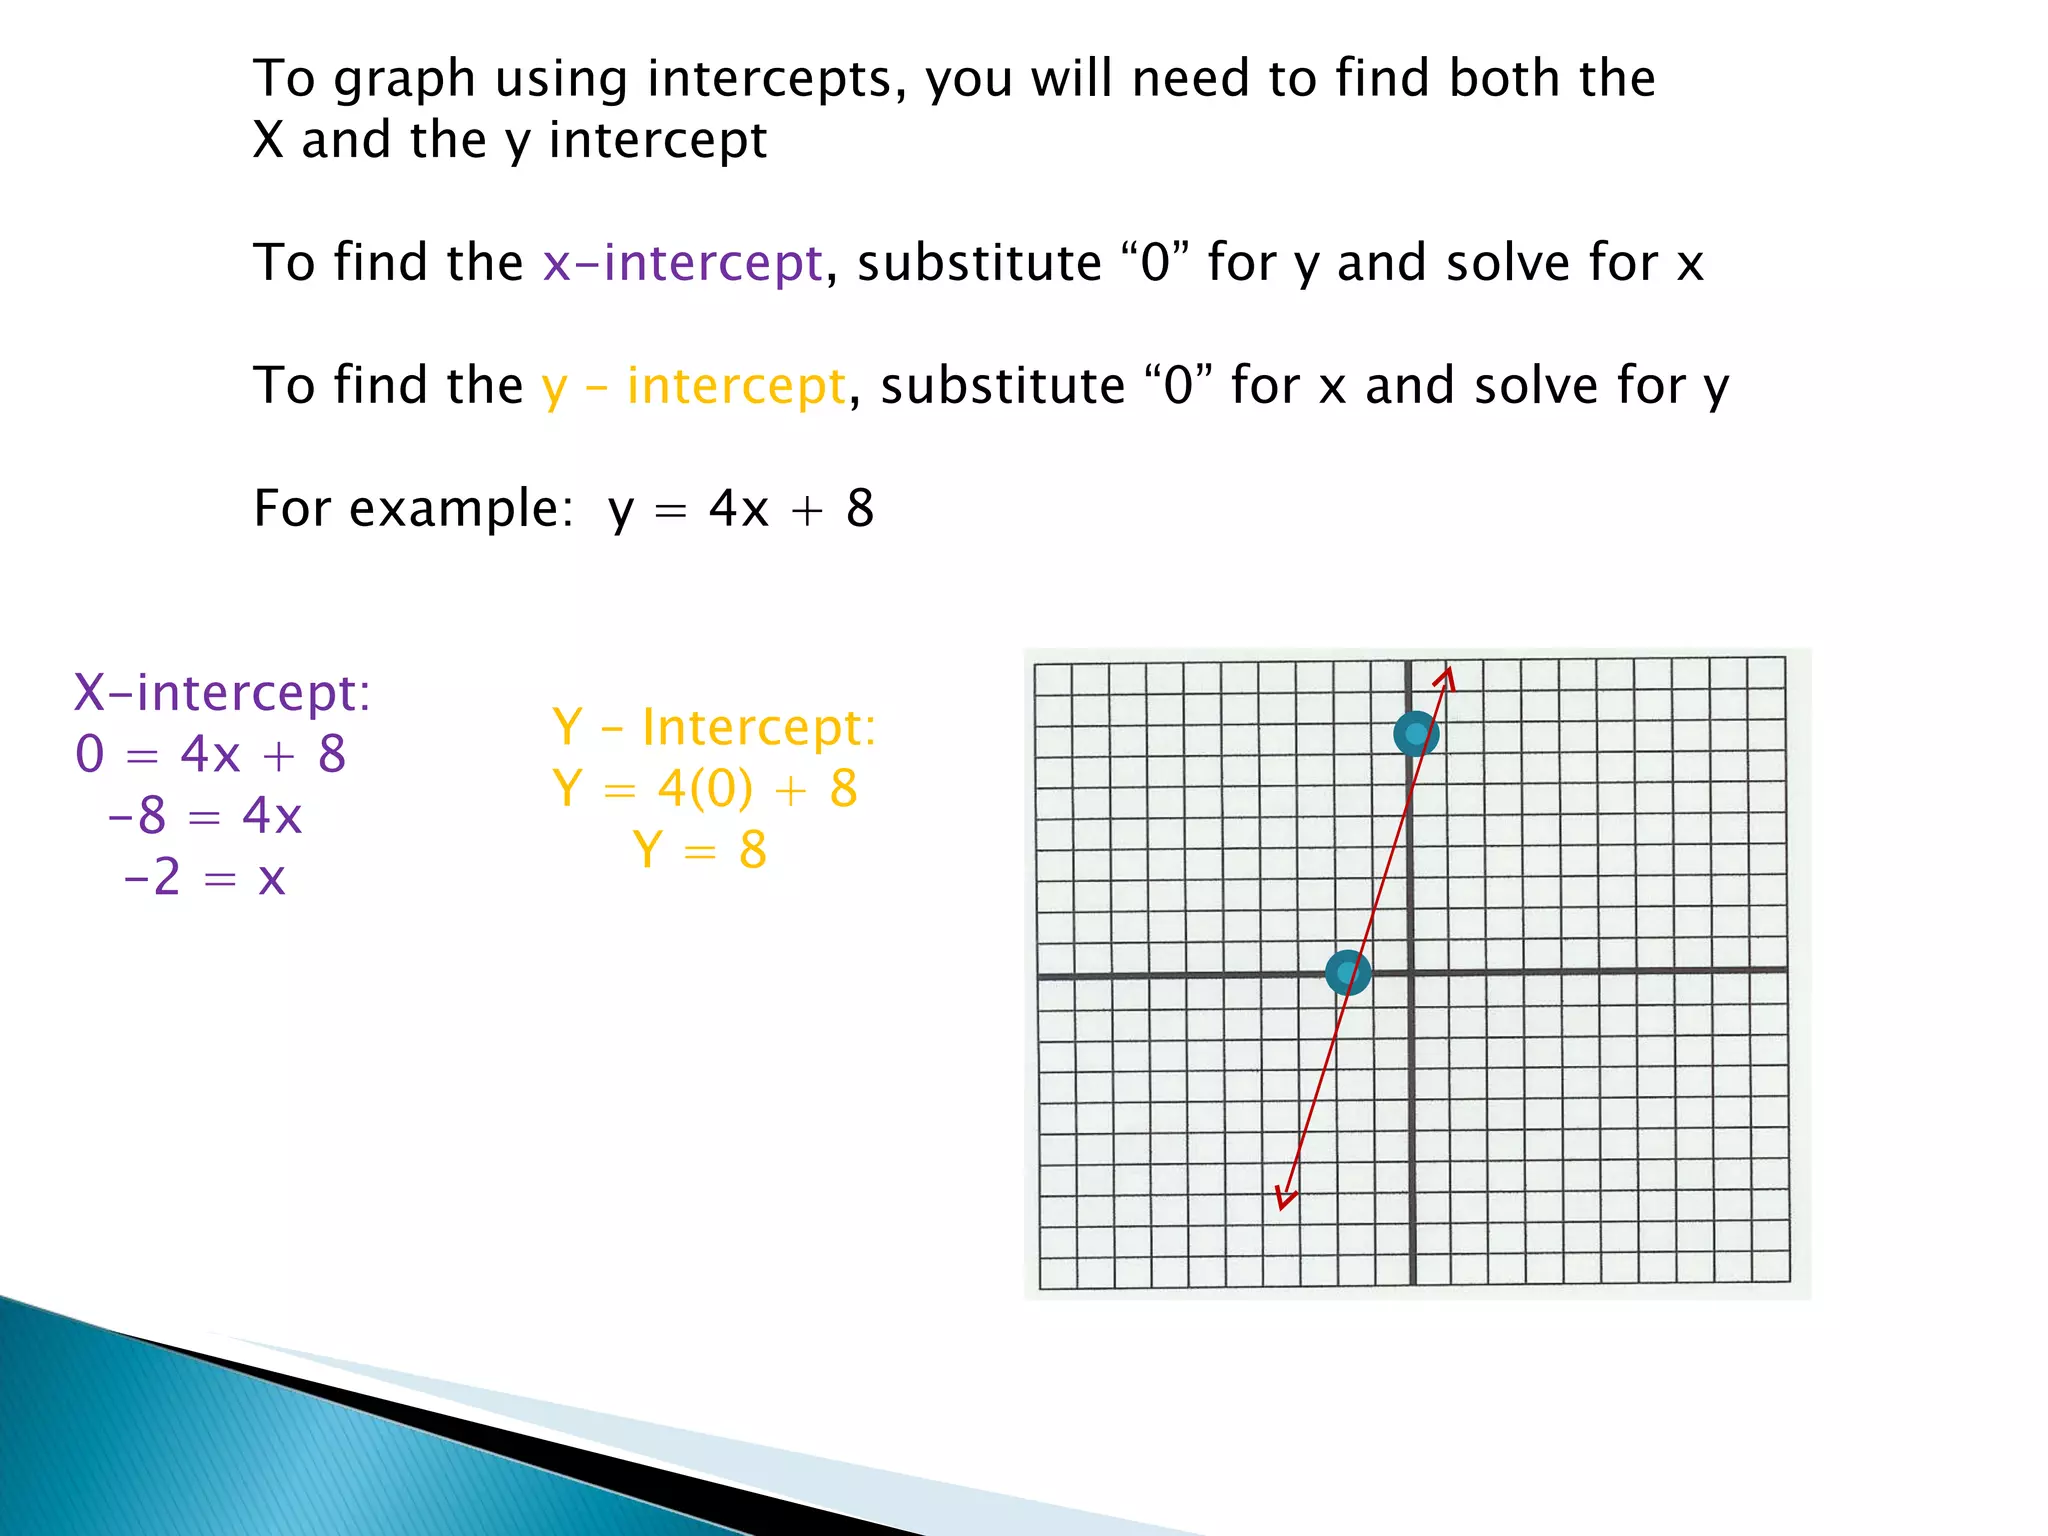
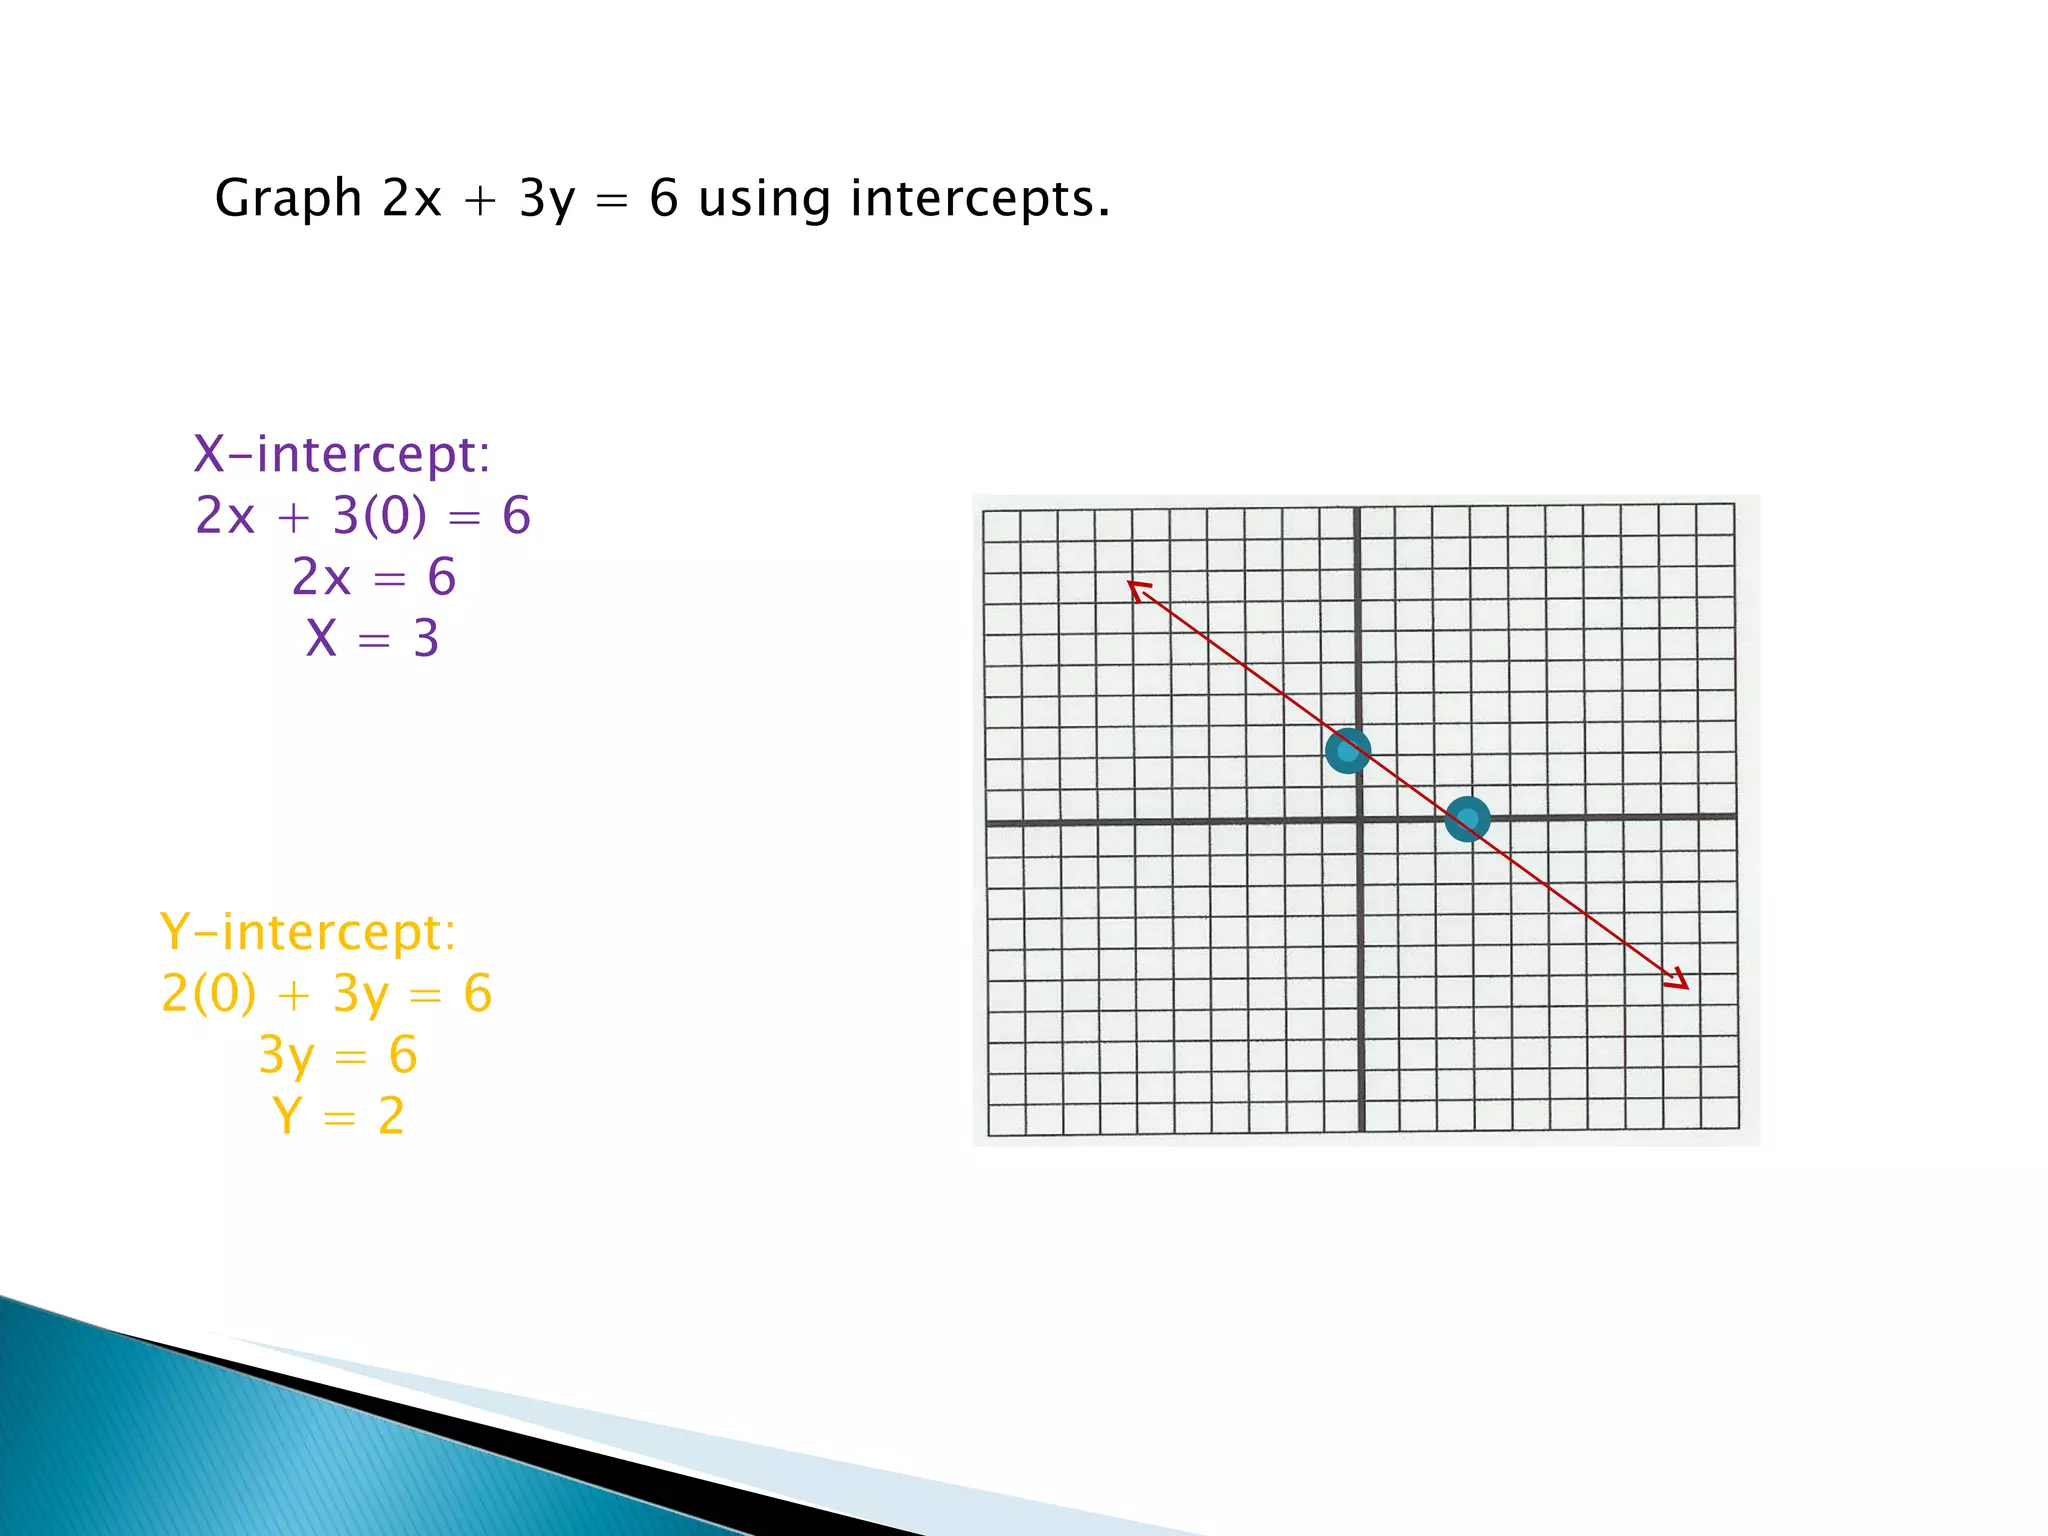
2) Using intercepts finds the x and y-intercepts by substituting 0 for x or y and solving for the other variable.
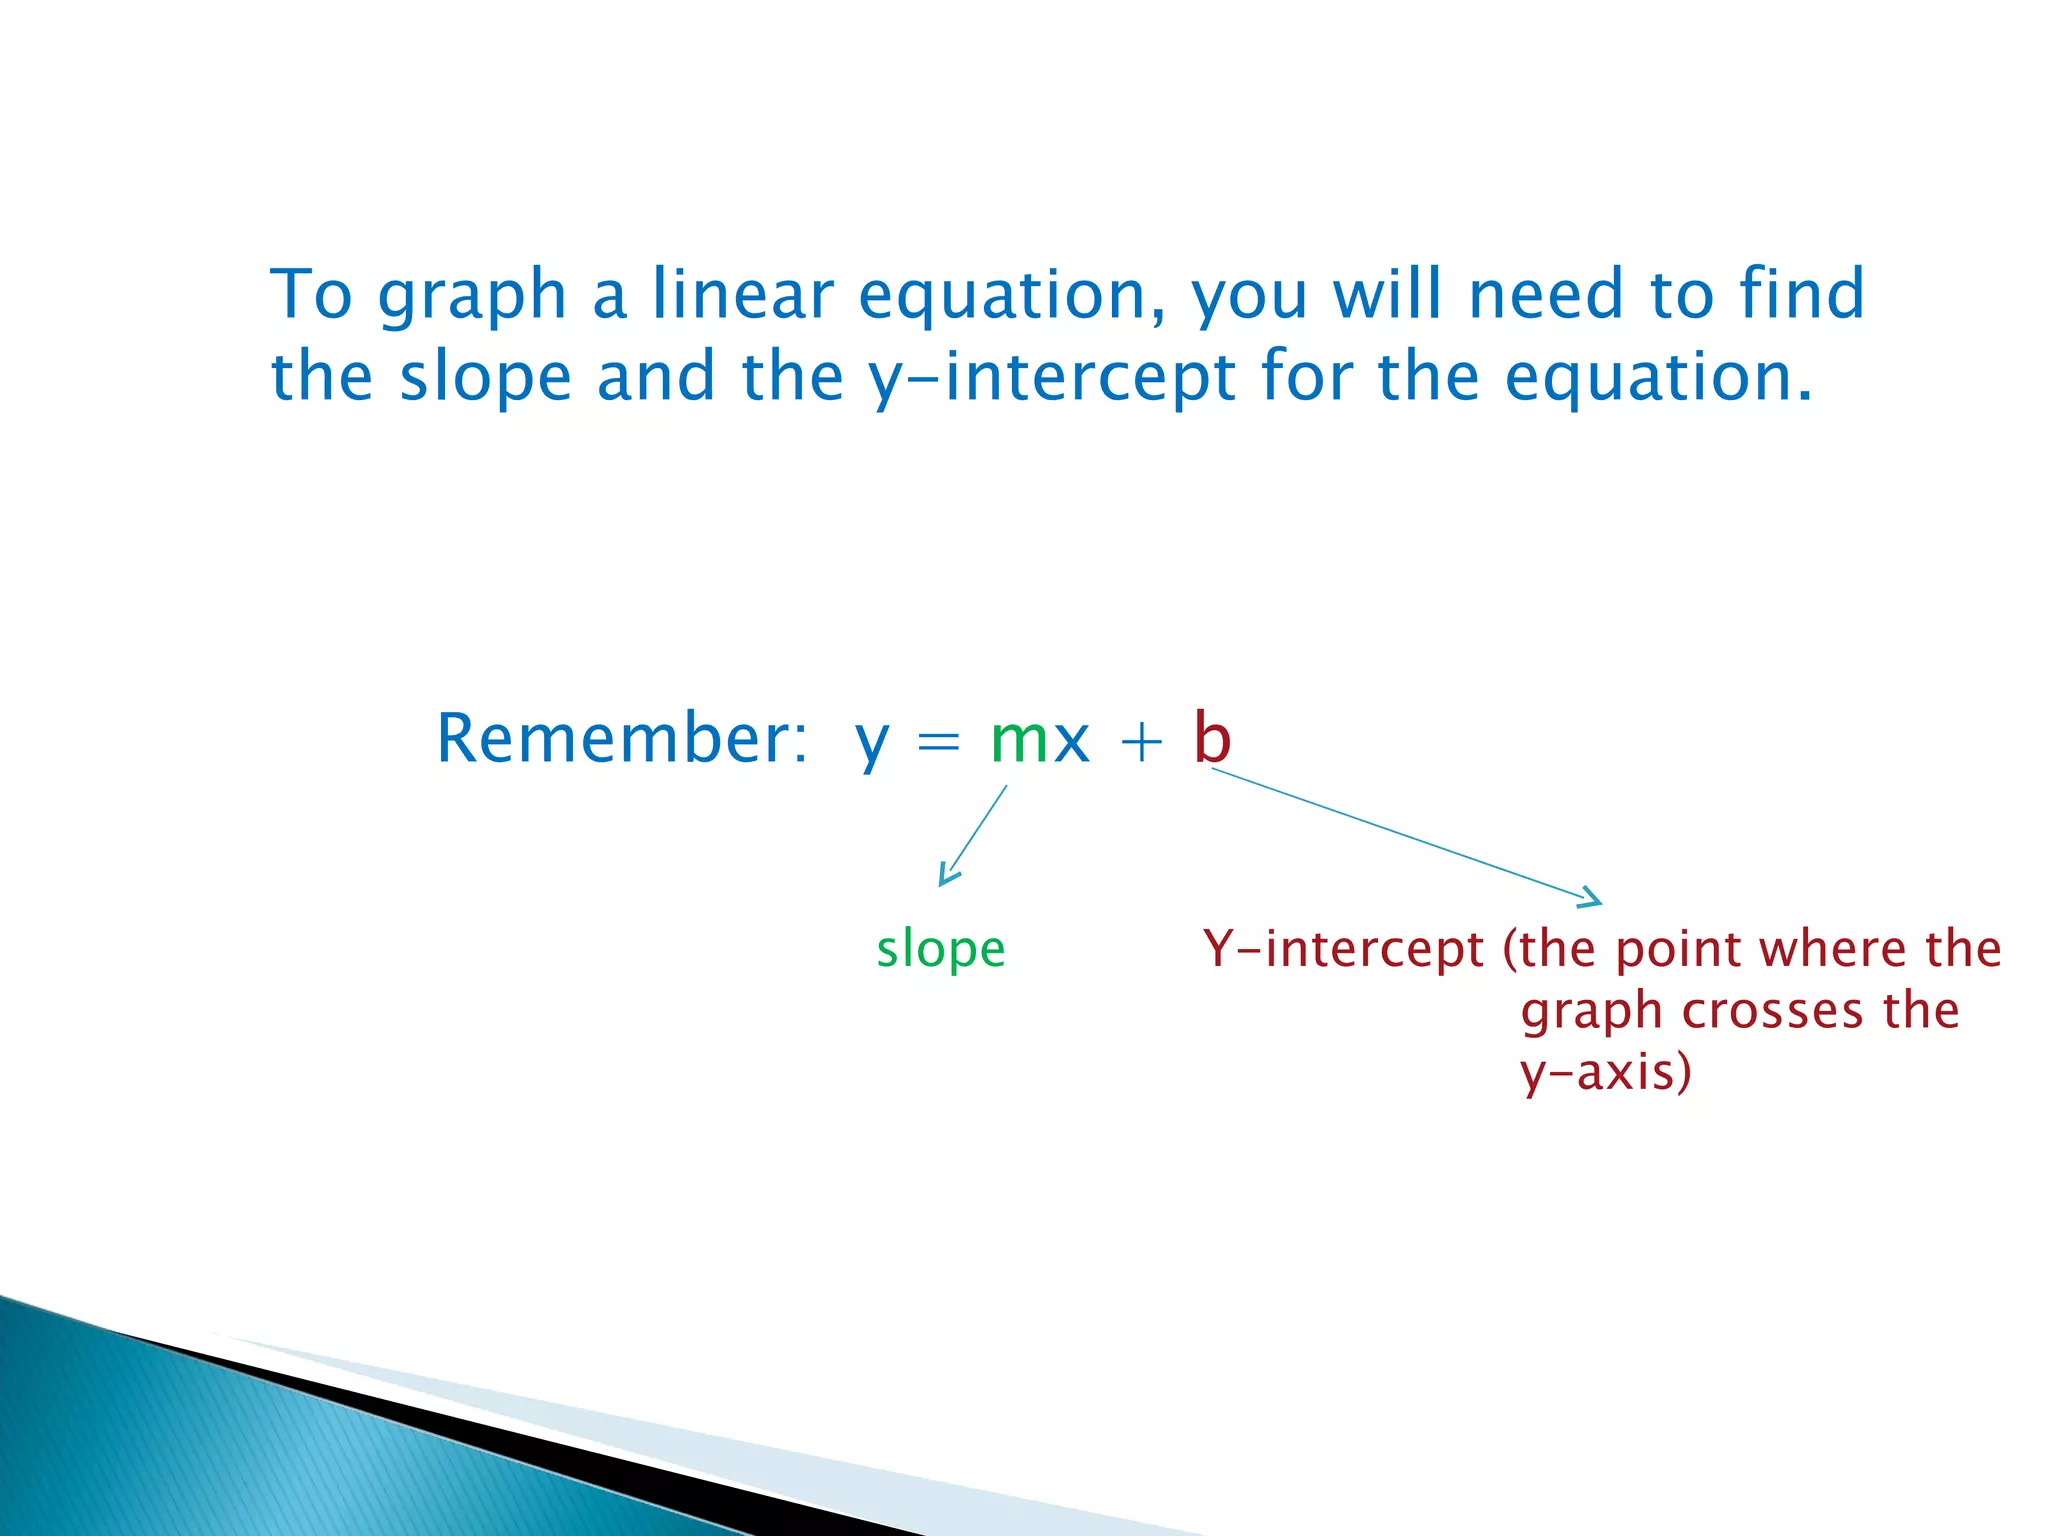
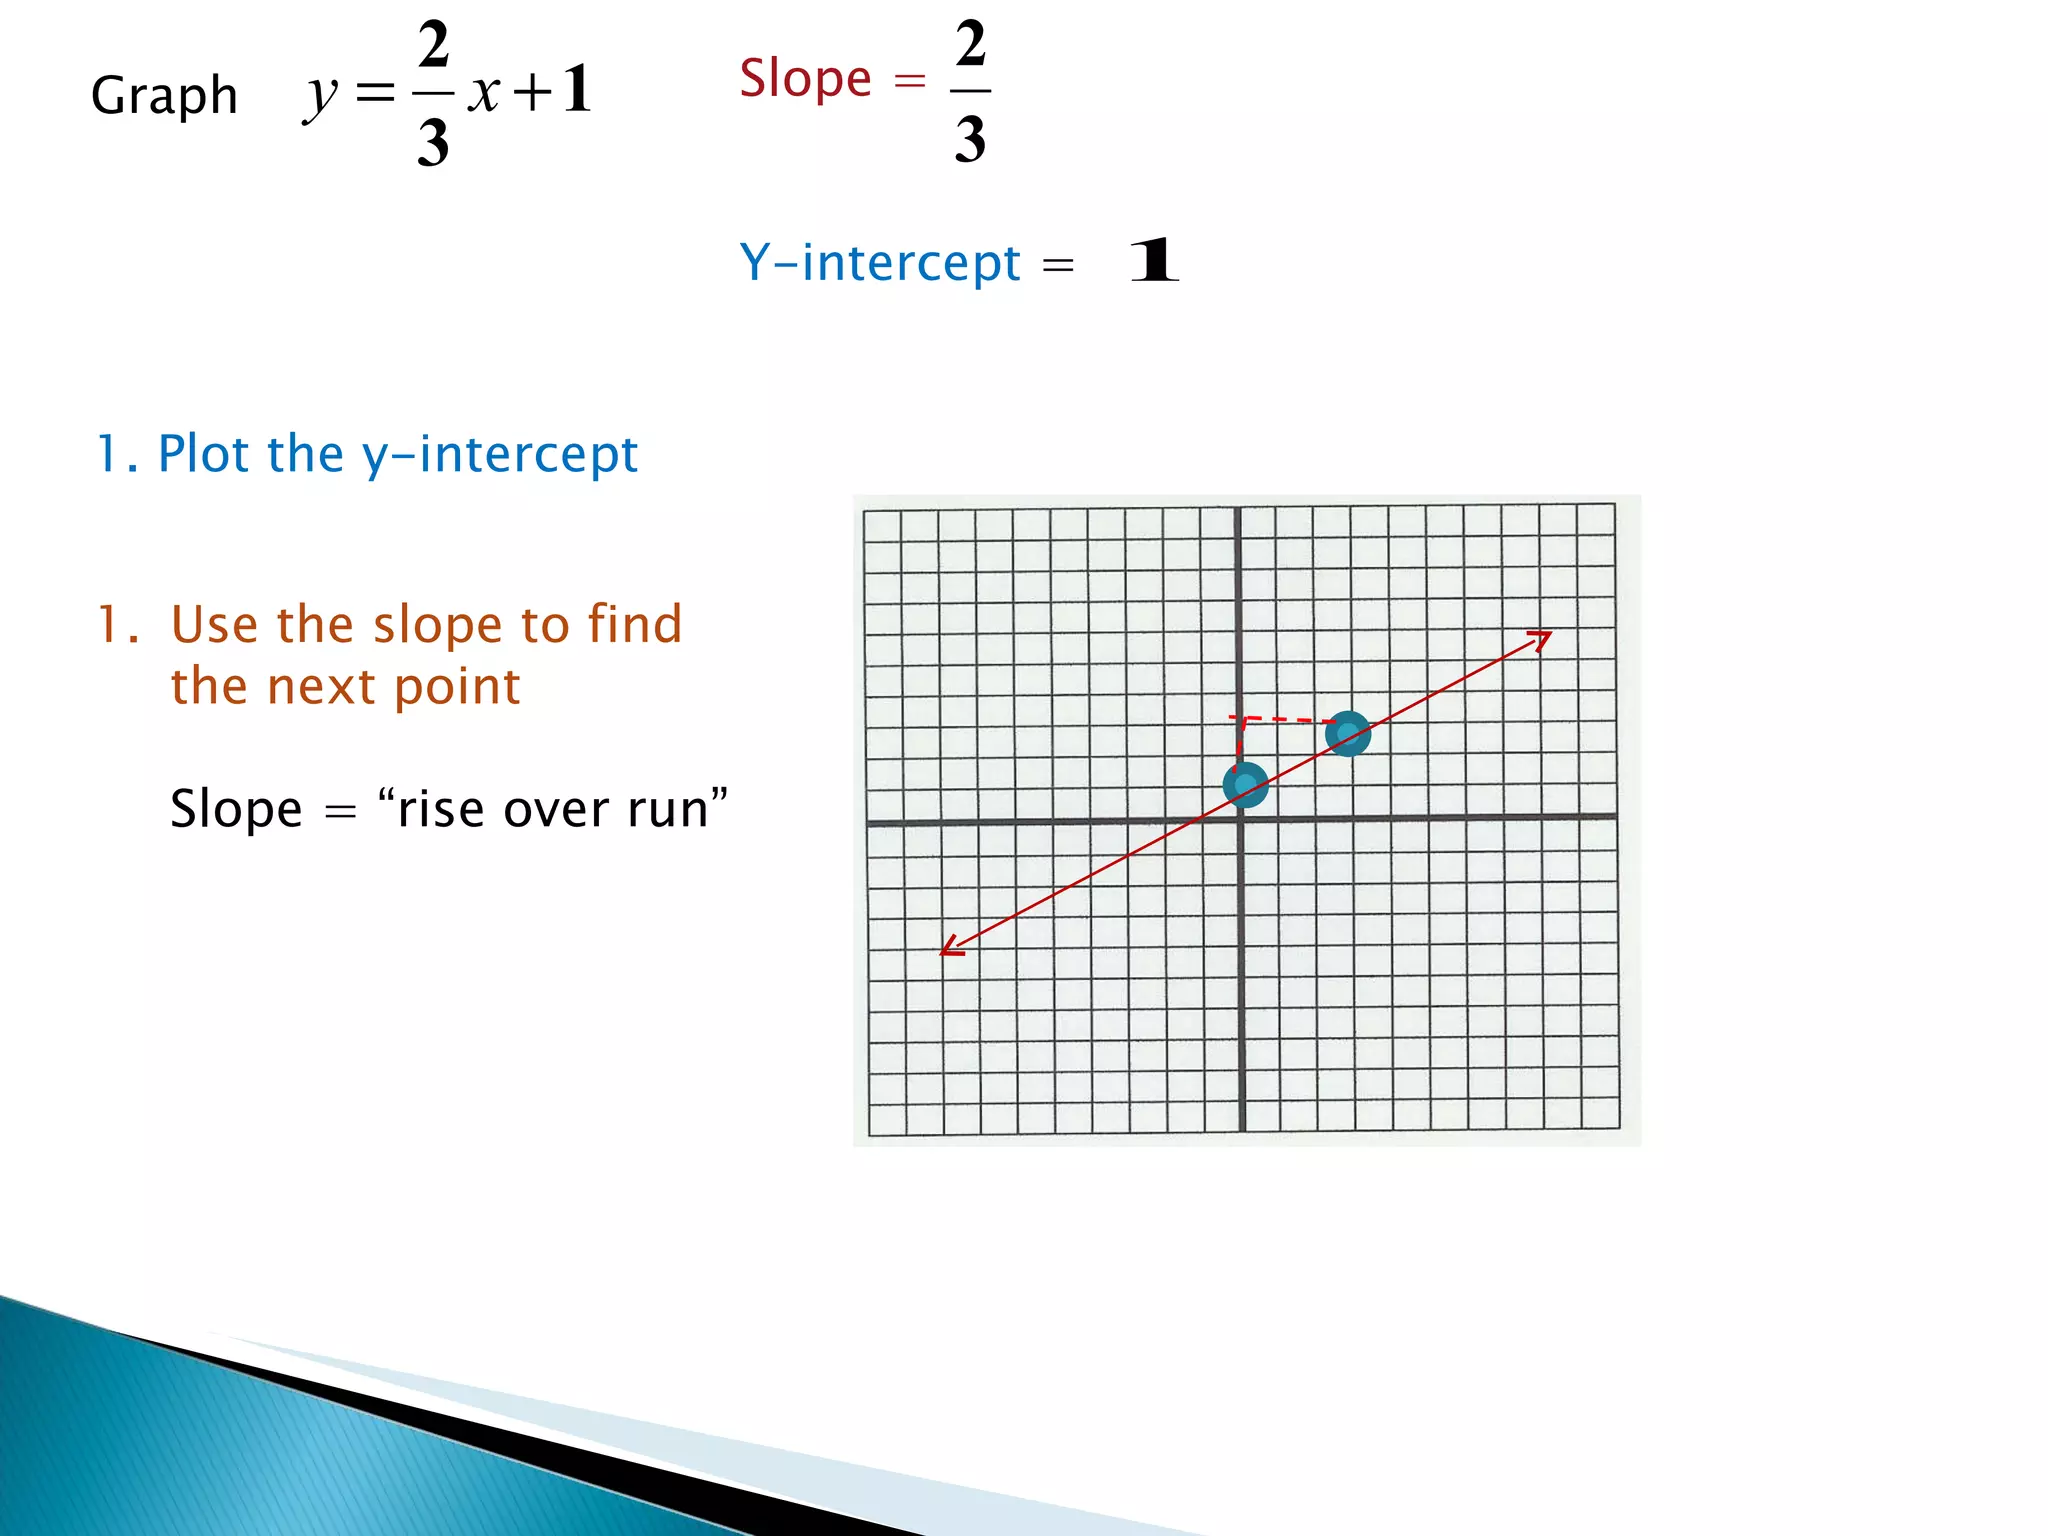
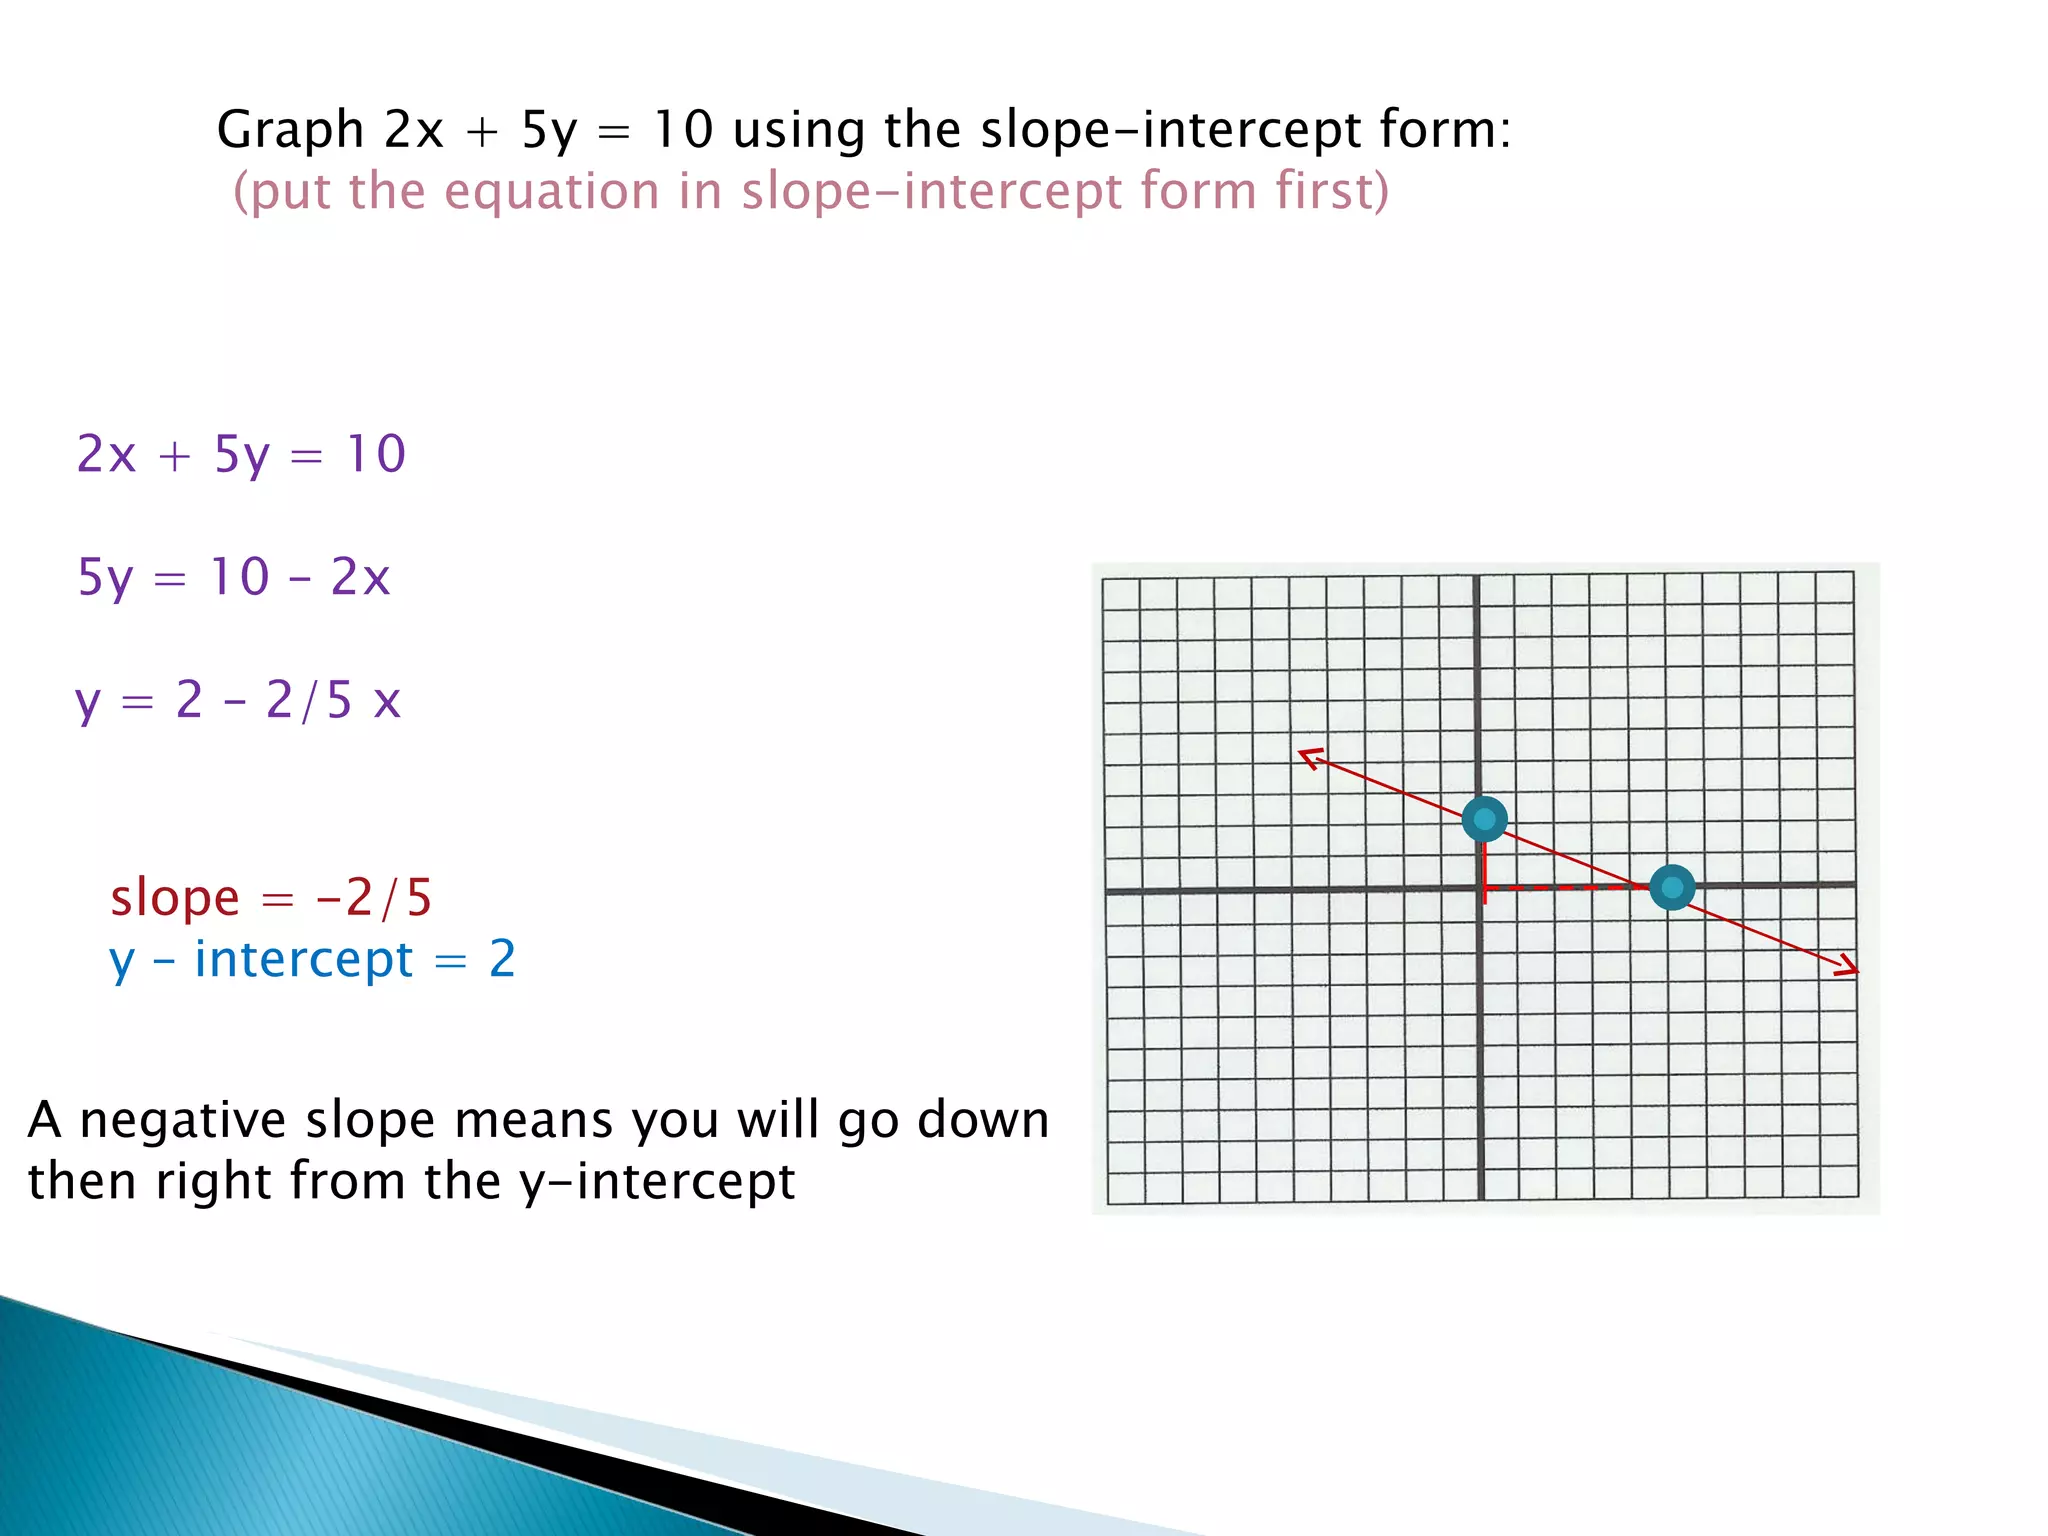
3) The slope-intercept form finds the slope and y-intercept to graph the line.
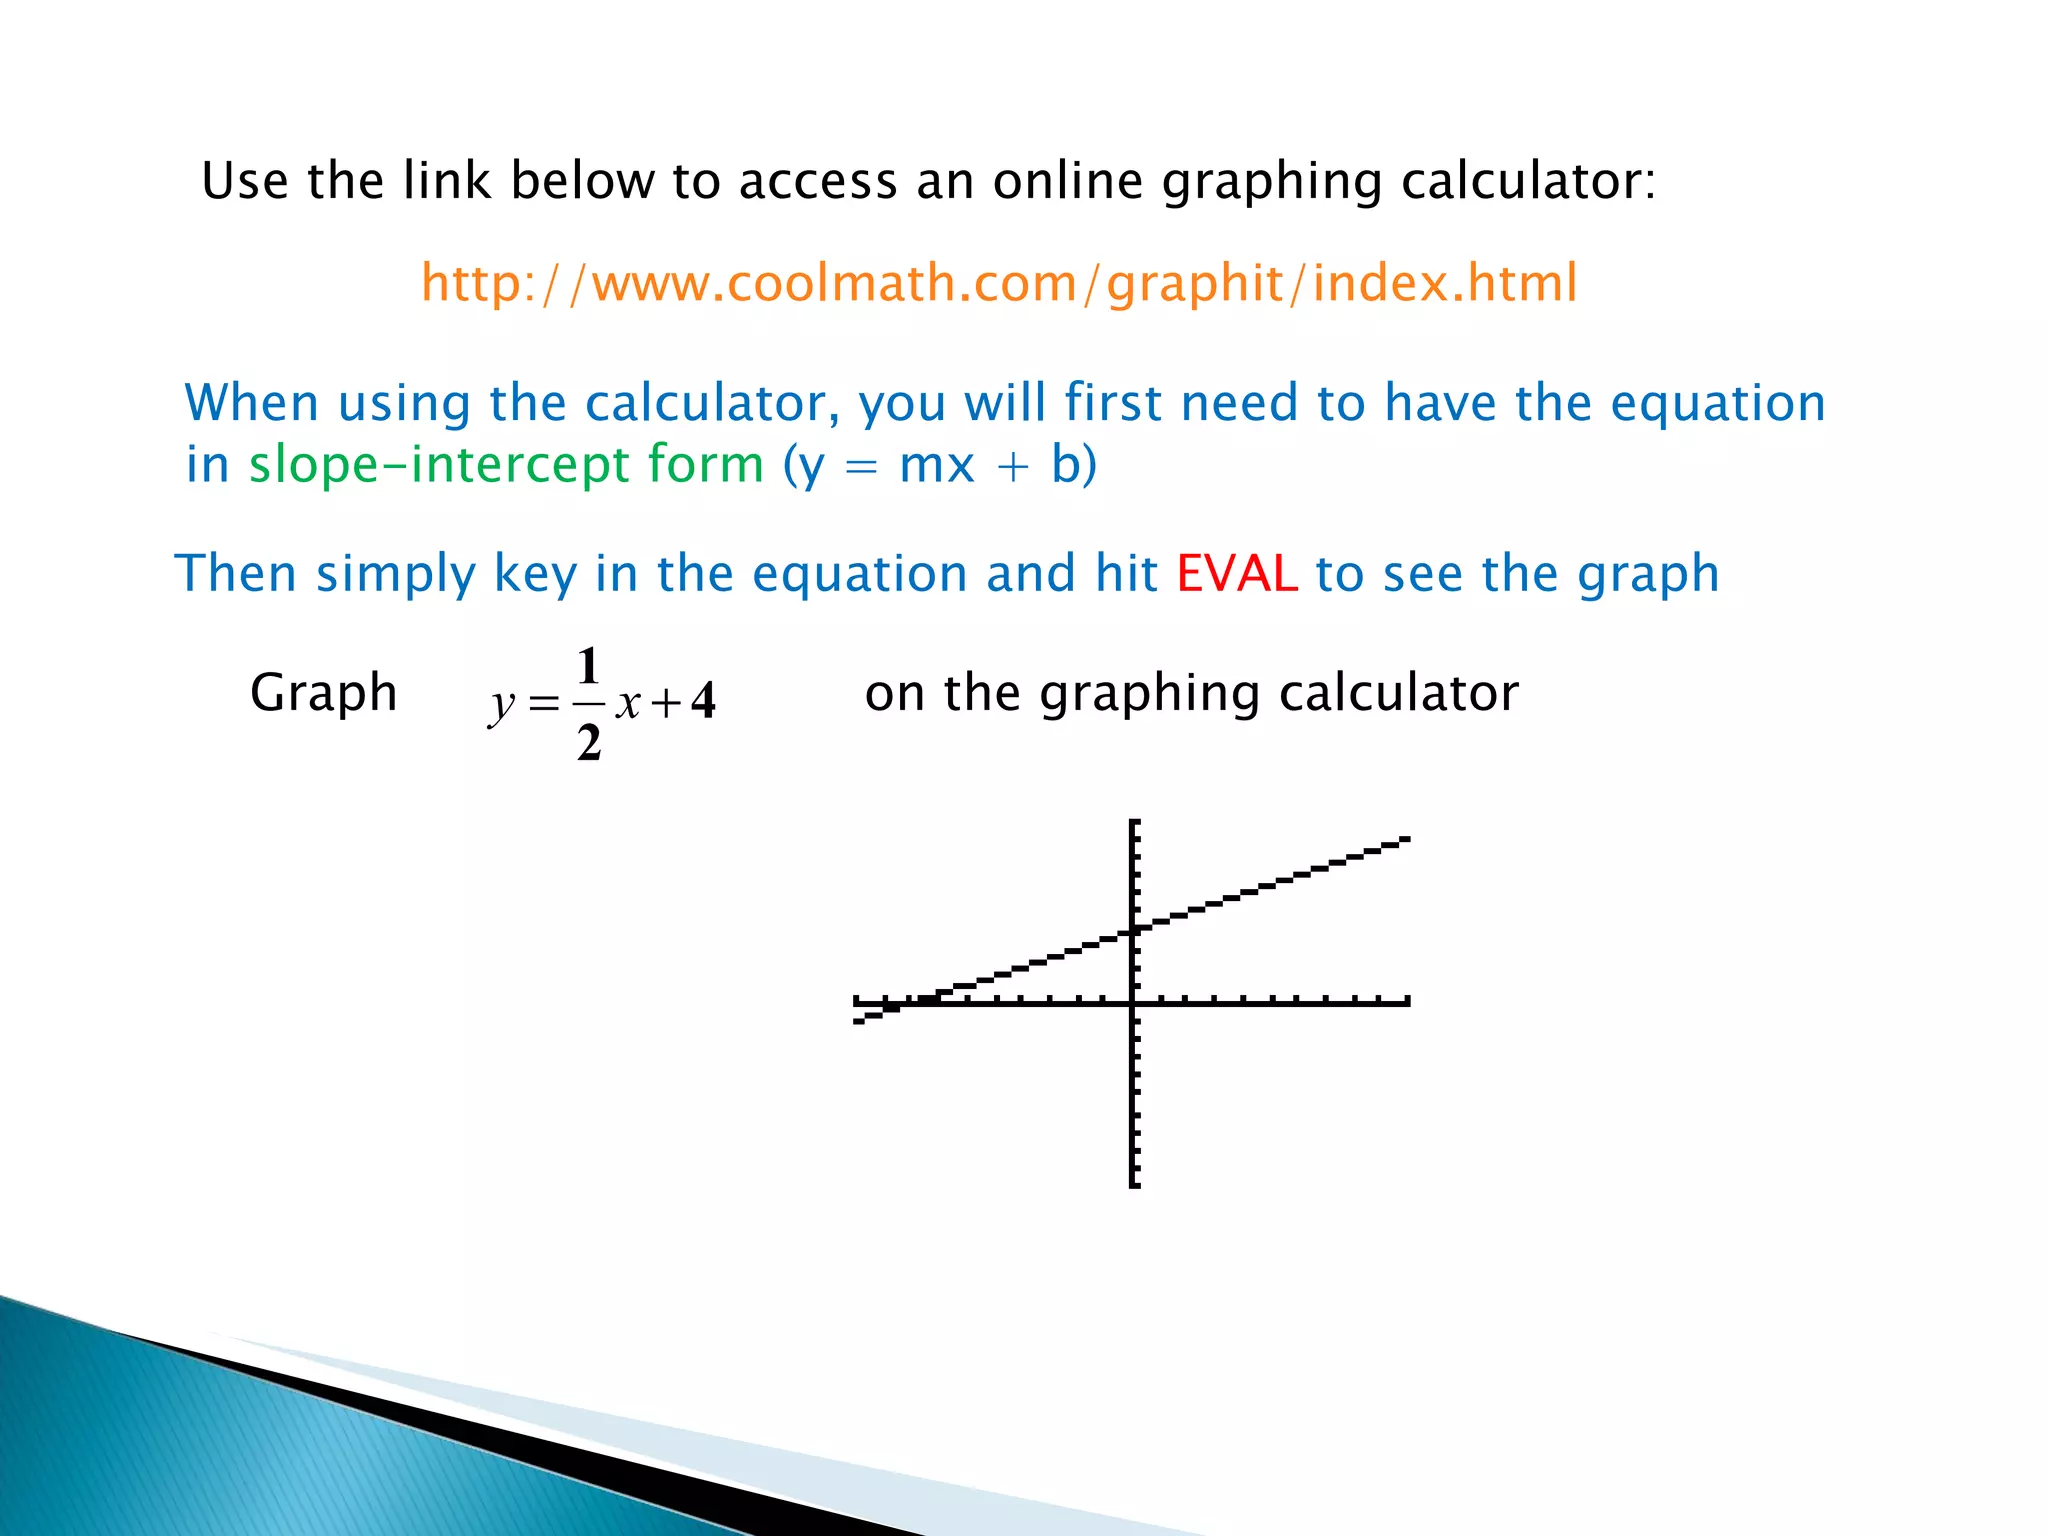
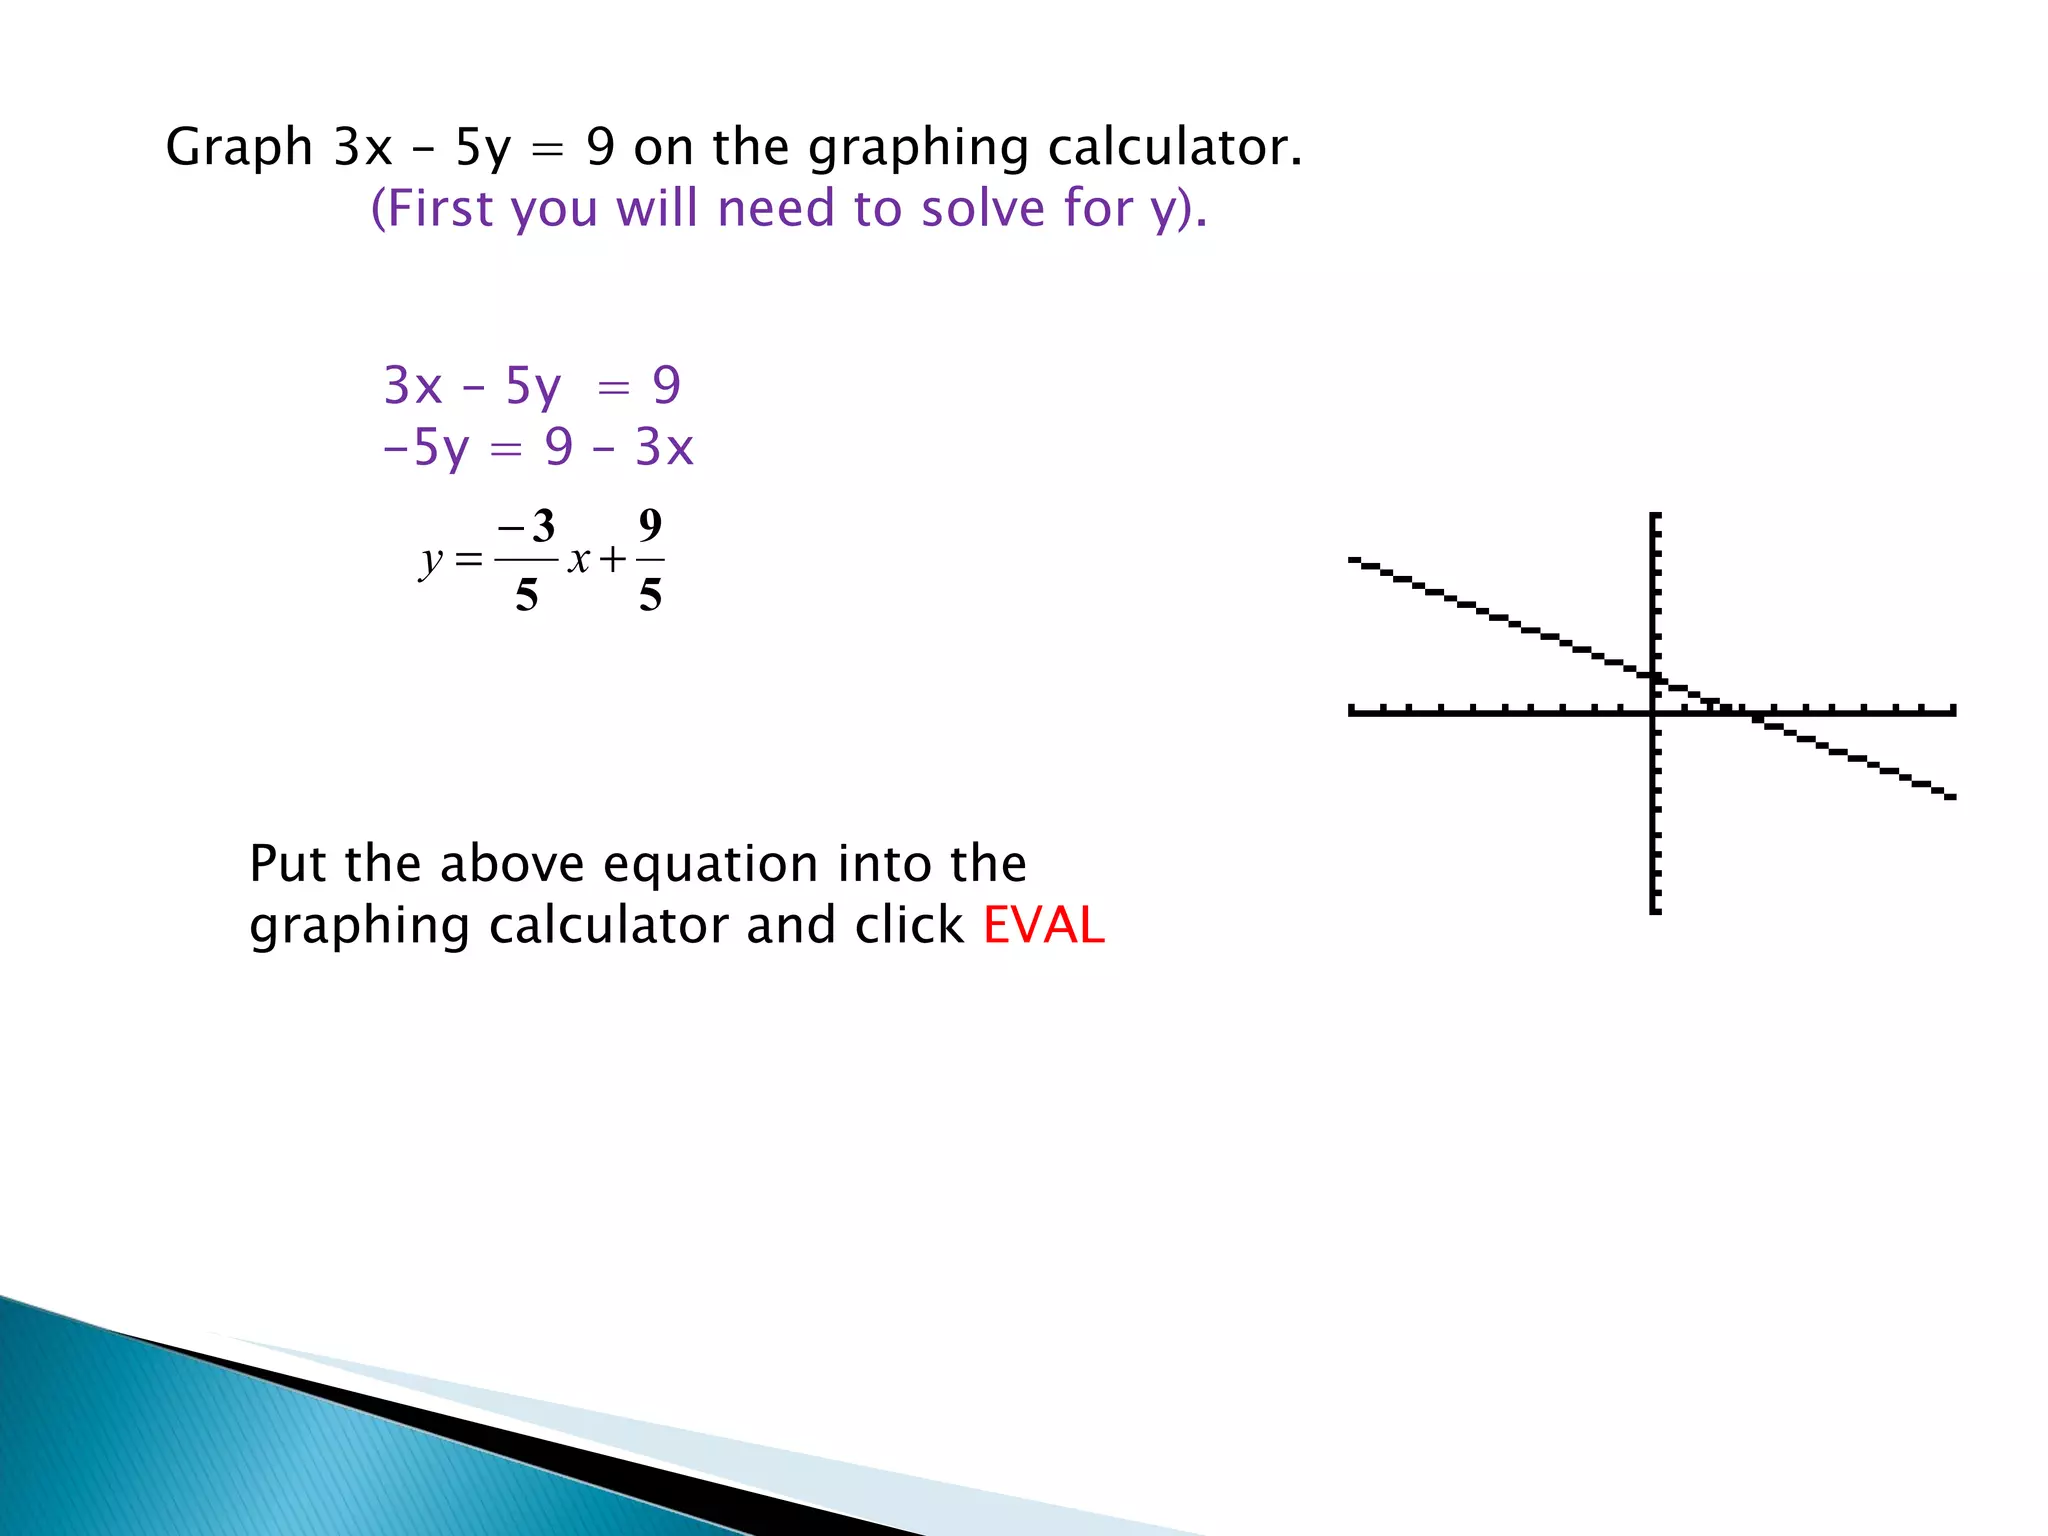
4) A graphing calculator can be used by inputting the equation in slope-intercept form (y=mx + b) and evaluating it to graph the line.