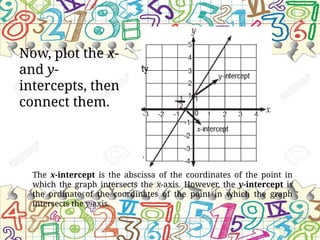
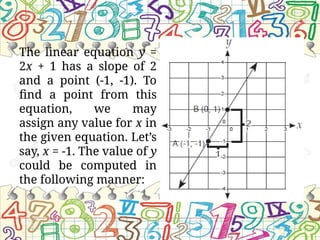
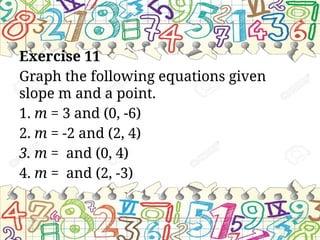
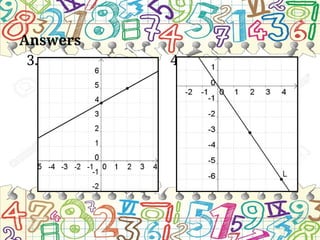
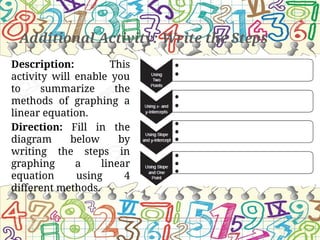
Graph of Linear
Equations
Review
How to determine the
slope of a line?
How can you describe
linear equations by
graphing?
Graph of Linear
Equations
Plot on a graph the points
(2, 3) and (-1 ,-1)
Learning Competency
Graph a linear equation given (a) any two
points; (b) the x – and y– intercepts; (c) the
slope and a point on the line. M8AL-If-2
Objectives:
1. Solve for the value of y in behalf of x
2. Graph the equation using any two points
Graph of Linear Equations
Linear function can be described by its
equation, either in the form y = mx + b or
Ax + By = C. A linear equation can also be
described by its graph. Graphing linear
equations can be done using any of the four
methods:
1. Using any two points on the line
2. Using x- and y-intercepts
3. Using the slope and a point
Using Two Points on the line
One method of graphing a linear
equation is using two points. In
Geometry, you learned that two points
determine a line. Since the graph of the
linear equation is a line, thus two points
are enough to draw a graph of a linear
equation.
Illustrative Example
Graph the function y = 2x + 1.
You may assign any two values for x, say 0 and 1.
By substitution,
y = 2x + 1 y = 2x + 1
y = 2(0) + 1 y = 2(1) + 1
y = 0 + 1 y = 2 + 1
y = 1 y = 3
If x = 0, then y = 1. Furthermore, if x = 1, then y = 3. So, the
ordered pairs are (0, 1) and (1, 3). This means that the line
passes through these points.
After finding
the ordered
pairs of the two
points, plot and
connect them.
Your output is
the graph of the
linear equation.
Exercise 8
Graph each linear equation that passes
through the given pair of points.
1. (1, 2) and (3, 4)
2. (5, 6) and (0, 11)
3. (-2, ) and (, -)
4. (-, -) and (, )
Answers
1. 3.
2. 4.
Using x-Intercept and y-Intercept
Secondly, the linear equation can be
graphed by using x-intercept a and y-
intercept b. The x- and y-intercepts of the
line could represent two points, which
are (a, 0) and (0, b). Thus, the intercepts
are enough to graph the linear equation.
Illustrative Example
To graph the equation y = 2x + 1 using this method, you need
to solve the x-intercept by letting y = 0 and the y-intercept by
letting x = 0.
Letting y = 0, the equation y = 2x + 1 becomes
0 = 2x + 1 Substitution
-2x = 1 Addition Property of Equality
x = -12 Multiplication Property of Equality
Letting x = 0, y = 2x + 1 becomes
y = 2(0) + 1 Substitution
y = 0 + 1 Simplification
y = 1 Simplification
The x-intercept a is -12 while the y-intercept b is 1.
Now, plot the x-
and y-
intercepts, then
connect them.
The x-intercept is the abscissa of the coordinates of the point in
which the graph intersects the x-axis. However, the y-intercept is
the ordinate of the coordinates of the point in which the graph
intersects the y-axis.
Exercise 9
Graph each linear equation whose x-
intercept a and y-intercept b are given
below.
1. a = 2 and b = 1
2. a = 4 and b = -1
3. a = -2 and b = -7
4. a = and b = -2
Answers
1. 3.
2. 4.
Using Slope and a Point
The third method in graphing linear
equation is by using the slope and one
point. This can be done by plotting first
the given point, then finding the other
point using the slope.
The linear equation y =
2x + 1 has a slope of 2
and a point (-1, -1). To
find a point from this
equation, we may
assign any value for x in
the given equation. Let’s
say, x = -1. The value of y
could be computed in
the following manner:
Exercise 11
Graph the following equations given
slope m and a point.
1. m = 3 and (0, -6)
2. m = -2 and (2, 4)
3. m = and (0, 4)
4. m = and (2, -3)
Answers
1. 2.
Answers
3. 4.
Group Board Work Contest
The class will be divided into 4
groups. In every problem given, 2
representative of the group can go to the
board and write the answer/solutions on
the board. The first group to answer
correctly will receive the point.
How important
is graphing in
real life
situations?
Generalization
The graph of a linear equation can be
drawn in the coordinate plane using
any two points, the x- and y- intercepts
of the line, slope and y-intercept and
using slope and one point. Graphing is
a clear representation of data which
could easily be understood.
Additional Activity: Write the Steps
Description: This
activity will enable you
to summarize the
methods of graphing a
linear equation.
Direction: Fill in the
diagram below by
writing the steps in
graphing a linear
equation using 4
different methods.
Thank you
for your
cooperation!
Janette M. Basco, SST-I
San Vicente National High School

graphoflinearequations-180821083542.pptx

  • 1.
  • 2.
    Review How to determinethe slope of a line?
  • 3.
    How can youdescribe linear equations by graphing?
  • 4.
  • 5.
    Plot on agraph the points (2, 3) and (-1 ,-1)
  • 6.
    Learning Competency Graph alinear equation given (a) any two points; (b) the x – and y– intercepts; (c) the slope and a point on the line. M8AL-If-2 Objectives: 1. Solve for the value of y in behalf of x 2. Graph the equation using any two points
  • 7.
    Graph of LinearEquations Linear function can be described by its equation, either in the form y = mx + b or Ax + By = C. A linear equation can also be described by its graph. Graphing linear equations can be done using any of the four methods: 1. Using any two points on the line 2. Using x- and y-intercepts 3. Using the slope and a point
  • 8.
    Using Two Pointson the line One method of graphing a linear equation is using two points. In Geometry, you learned that two points determine a line. Since the graph of the linear equation is a line, thus two points are enough to draw a graph of a linear equation.
  • 9.
    Illustrative Example Graph thefunction y = 2x + 1. You may assign any two values for x, say 0 and 1. By substitution, y = 2x + 1 y = 2x + 1 y = 2(0) + 1 y = 2(1) + 1 y = 0 + 1 y = 2 + 1 y = 1 y = 3 If x = 0, then y = 1. Furthermore, if x = 1, then y = 3. So, the ordered pairs are (0, 1) and (1, 3). This means that the line passes through these points.
  • 10.
    After finding the ordered pairsof the two points, plot and connect them. Your output is the graph of the linear equation.
  • 11.
    Exercise 8 Graph eachlinear equation that passes through the given pair of points. 1. (1, 2) and (3, 4) 2. (5, 6) and (0, 11) 3. (-2, ) and (, -) 4. (-, -) and (, )
  • 12.
  • 13.
    Using x-Intercept andy-Intercept Secondly, the linear equation can be graphed by using x-intercept a and y- intercept b. The x- and y-intercepts of the line could represent two points, which are (a, 0) and (0, b). Thus, the intercepts are enough to graph the linear equation.
  • 14.
    Illustrative Example To graphthe equation y = 2x + 1 using this method, you need to solve the x-intercept by letting y = 0 and the y-intercept by letting x = 0. Letting y = 0, the equation y = 2x + 1 becomes 0 = 2x + 1 Substitution -2x = 1 Addition Property of Equality x = -12 Multiplication Property of Equality Letting x = 0, y = 2x + 1 becomes y = 2(0) + 1 Substitution y = 0 + 1 Simplification y = 1 Simplification The x-intercept a is -12 while the y-intercept b is 1.
  • 15.
    Now, plot thex- and y- intercepts, then connect them. The x-intercept is the abscissa of the coordinates of the point in which the graph intersects the x-axis. However, the y-intercept is the ordinate of the coordinates of the point in which the graph intersects the y-axis.
  • 16.
    Exercise 9 Graph eachlinear equation whose x- intercept a and y-intercept b are given below. 1. a = 2 and b = 1 2. a = 4 and b = -1 3. a = -2 and b = -7 4. a = and b = -2
  • 17.
  • 18.
    Using Slope anda Point The third method in graphing linear equation is by using the slope and one point. This can be done by plotting first the given point, then finding the other point using the slope.
  • 19.
    The linear equationy = 2x + 1 has a slope of 2 and a point (-1, -1). To find a point from this equation, we may assign any value for x in the given equation. Let’s say, x = -1. The value of y could be computed in the following manner:
  • 20.
    Exercise 11 Graph thefollowing equations given slope m and a point. 1. m = 3 and (0, -6) 2. m = -2 and (2, 4) 3. m = and (0, 4) 4. m = and (2, -3)
  • 21.
  • 22.
  • 23.
    Group Board WorkContest The class will be divided into 4 groups. In every problem given, 2 representative of the group can go to the board and write the answer/solutions on the board. The first group to answer correctly will receive the point.
  • 24.
    How important is graphingin real life situations?
  • 25.
    Generalization The graph ofa linear equation can be drawn in the coordinate plane using any two points, the x- and y- intercepts of the line, slope and y-intercept and using slope and one point. Graphing is a clear representation of data which could easily be understood.
  • 26.
    Additional Activity: Writethe Steps Description: This activity will enable you to summarize the methods of graphing a linear equation. Direction: Fill in the diagram below by writing the steps in graphing a linear equation using 4 different methods.
  • 27.
    Thank you for your cooperation! JanetteM. Basco, SST-I San Vicente National High School