Downloaded 1,529 times


![Example: CPU Profiling
# dtrace -x ustackframes=100 -n 'profile-997 /execname == "mysqld"/ {
@[ustack()] = count(); } tick-60s { exit(0); }'
dtrace: description 'profile-997 ' matched 2 probes
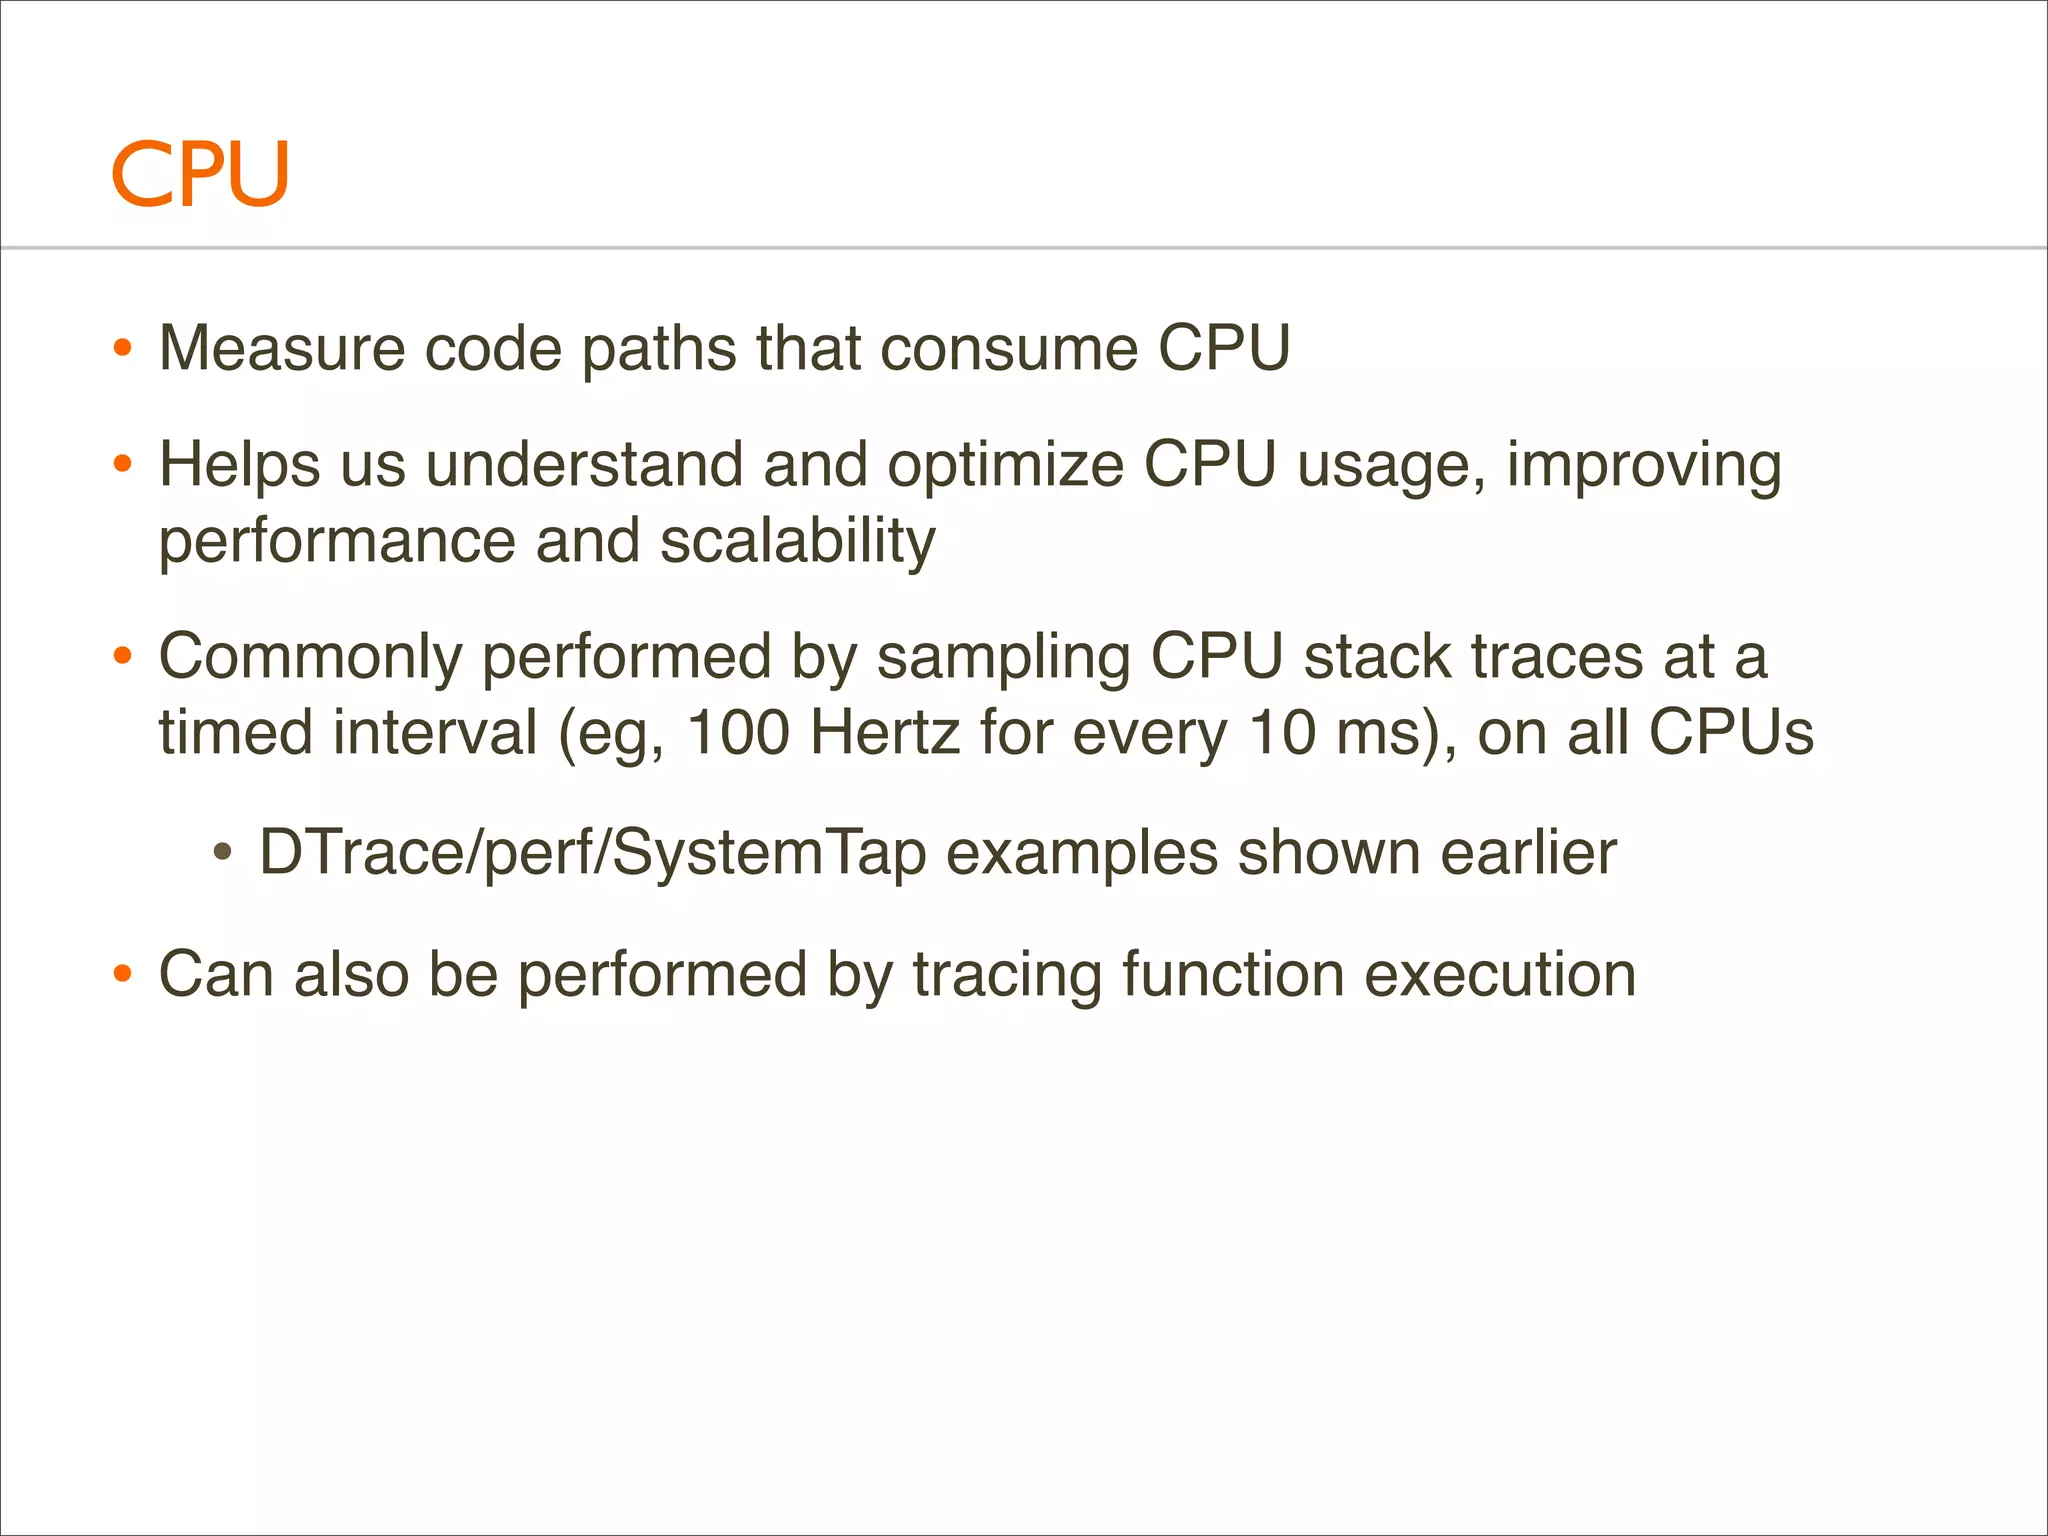
CPU
ID
FUNCTION:NAME
1 75195
:tick-60s
[...]
libc.so.1`__priocntlset+0xa
libc.so.1`getparam+0x83
libc.so.1`pthread_getschedparam+0x3c
libc.so.1`pthread_setschedprio+0x1f
mysqld`_Z16dispatch_command19enum_server_commandP3THDPcj+0x9ab
mysqld`_Z10do_commandP3THD+0x198
mysqld`handle_one_connection+0x1a6
libc.so.1`_thrp_setup+0x8d
libc.so.1`_lwp_start
4884
mysqld`_Z13add_to_statusP17system_status_varS0_+0x47
mysqld`_Z22calc_sum_of_all_statusP17system_status_var+0x67
mysqld`_Z16dispatch_command19enum_server_commandP3THDPcj+0x1222
mysqld`_Z10do_commandP3THD+0x198
mysqld`handle_one_connection+0x1a6
libc.so.1`_thrp_setup+0x8d
libc.so.1`_lwp_start
5530](https://image.slidesharecdn.com/lisa13flamegraphs-131107112122-phpapp01/75/Blazing-Performance-with-Flame-Graphs-12-2048.jpg)
![Example: CPU Profiling
# dtrace -x ustackframes=100 -n 'profile-997 /execname == "mysqld"/ {
@[ustack()] = count(); } tick-60s { exit(0); }'
dtrace: description 'profile-997 ' matched 2 probes
CPU
ID
FUNCTION:NAME
Profiling
1 75195
:tick-60s
Command
[...]
libc.so.1`__priocntlset+0xa
(DTrace)
libc.so.1`getparam+0x83
libc.so.1`pthread_getschedparam+0x3c
libc.so.1`pthread_setschedprio+0x1f
mysqld`_Z16dispatch_command19enum_server_commandP3THDPcj+0x9ab
mysqld`_Z10do_commandP3THD+0x198
mysqld`handle_one_connection+0x1a6
libc.so.1`_thrp_setup+0x8d
libc.so.1`_lwp_start
4884
Stack
Trace
mysqld`_Z13add_to_statusP17system_status_varS0_+0x47
mysqld`_Z22calc_sum_of_all_statusP17system_status_var+0x67
mysqld`_Z16dispatch_command19enum_server_commandP3THDPcj+0x1222
mysqld`_Z10do_commandP3THD+0x198
mysqld`handle_one_connection+0x1a6
libc.so.1`_thrp_setup+0x8d
libc.so.1`_lwp_start
5530
# of occurrences](https://image.slidesharecdn.com/lisa13flamegraphs-131107112122-phpapp01/75/Blazing-Performance-with-Flame-Graphs-13-2048.jpg)
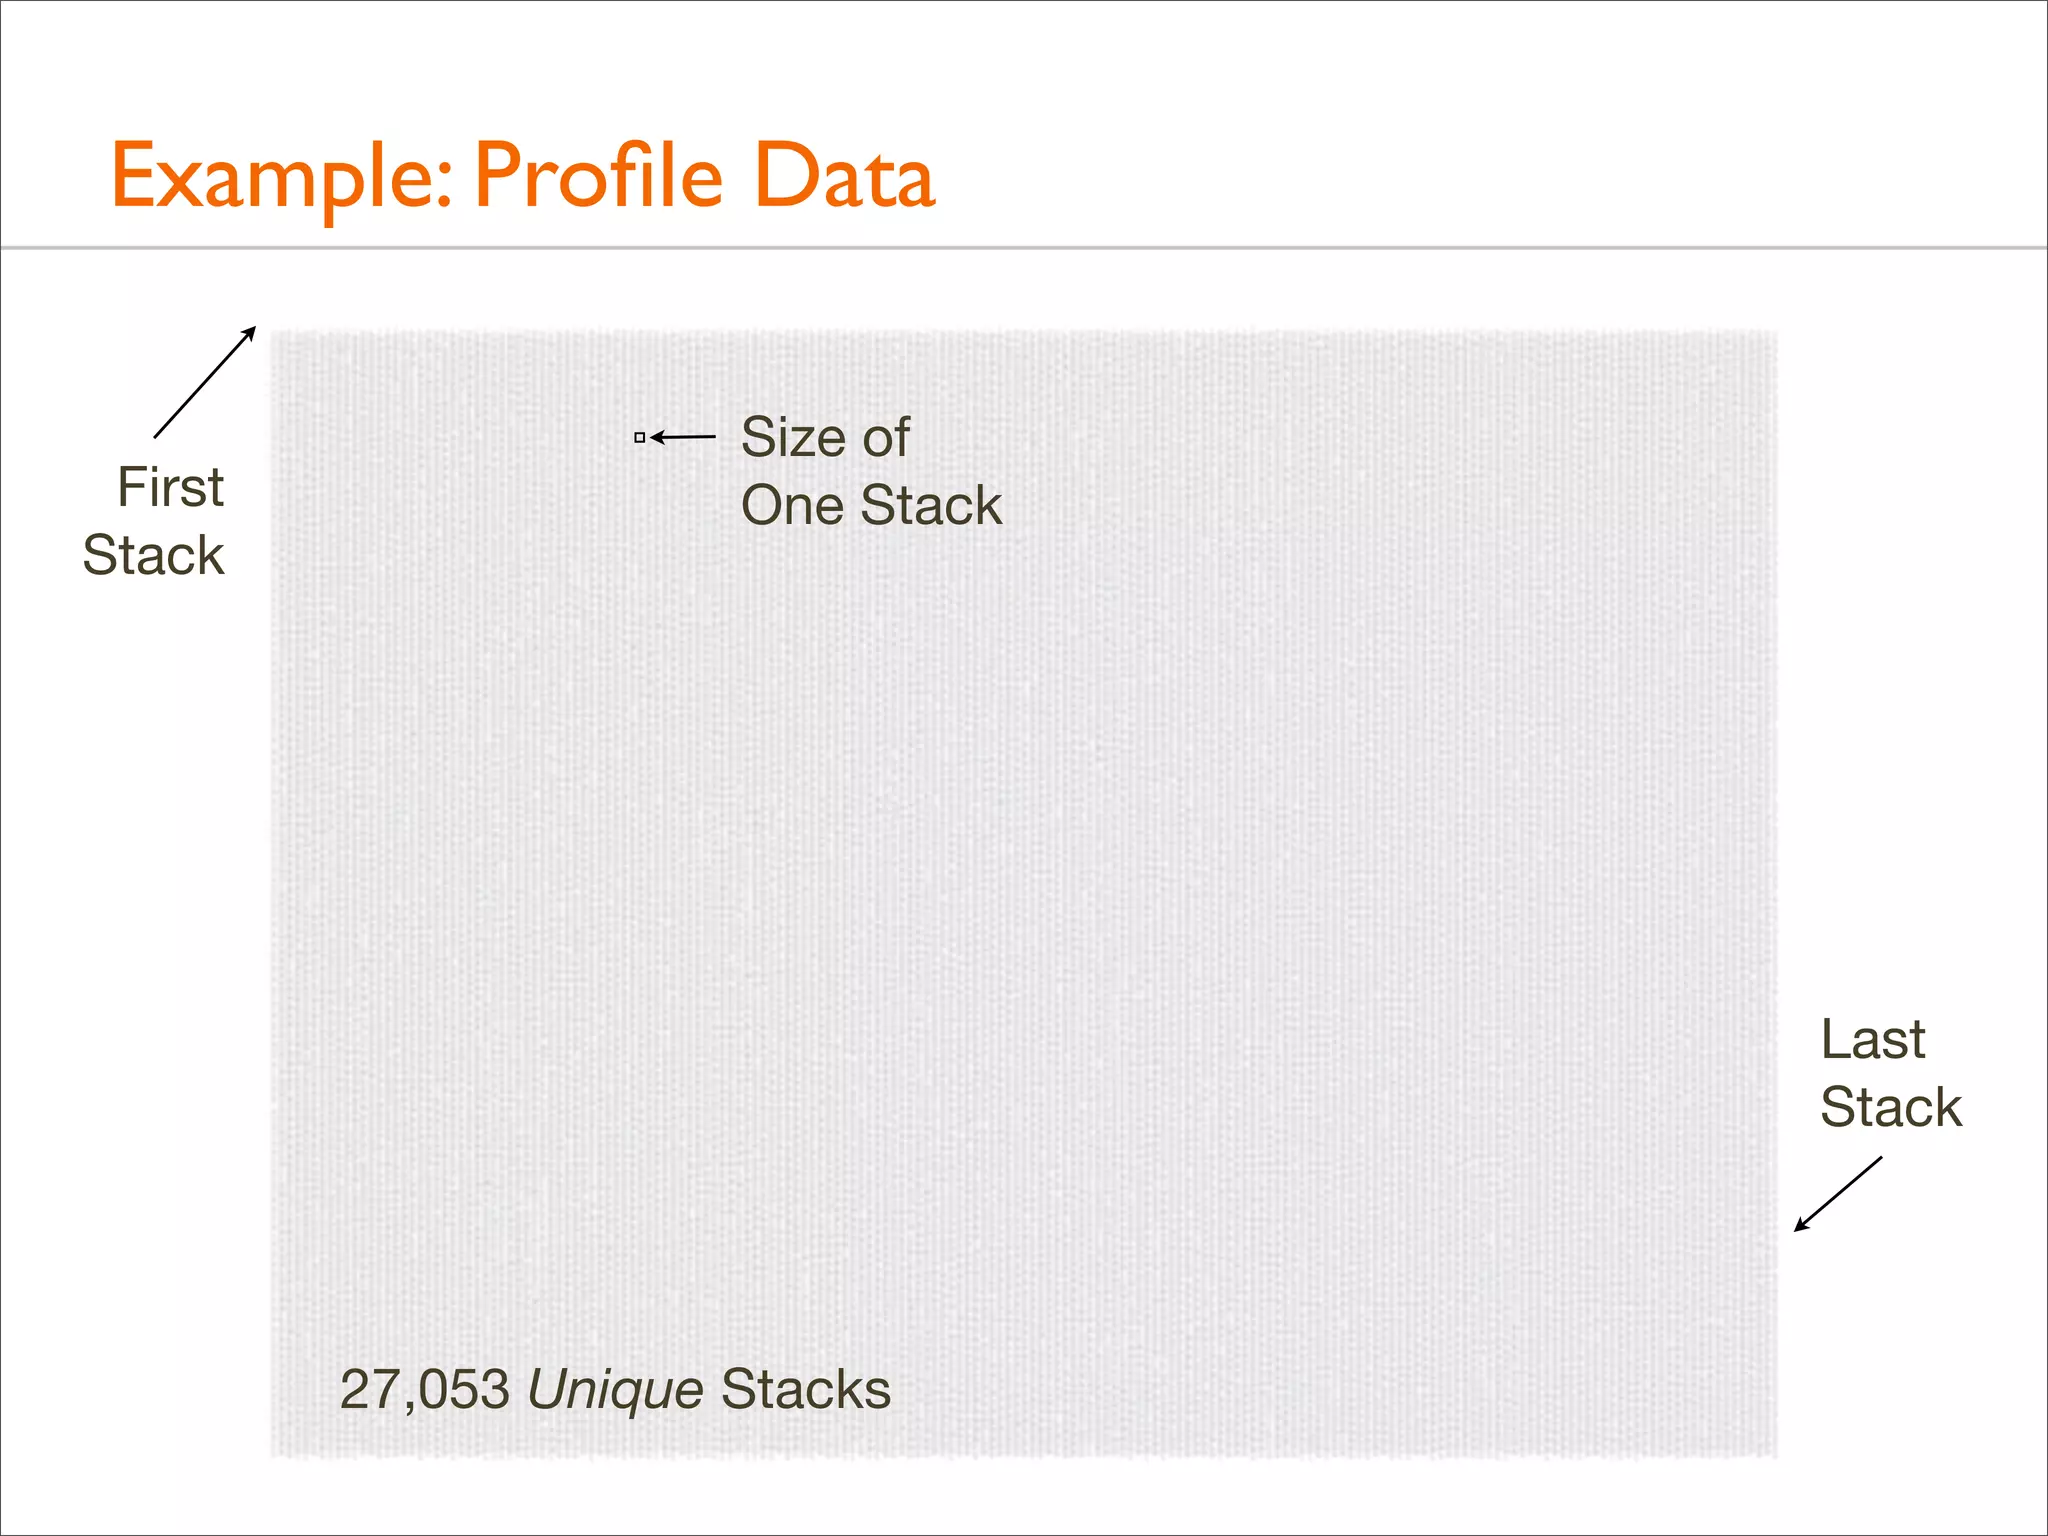
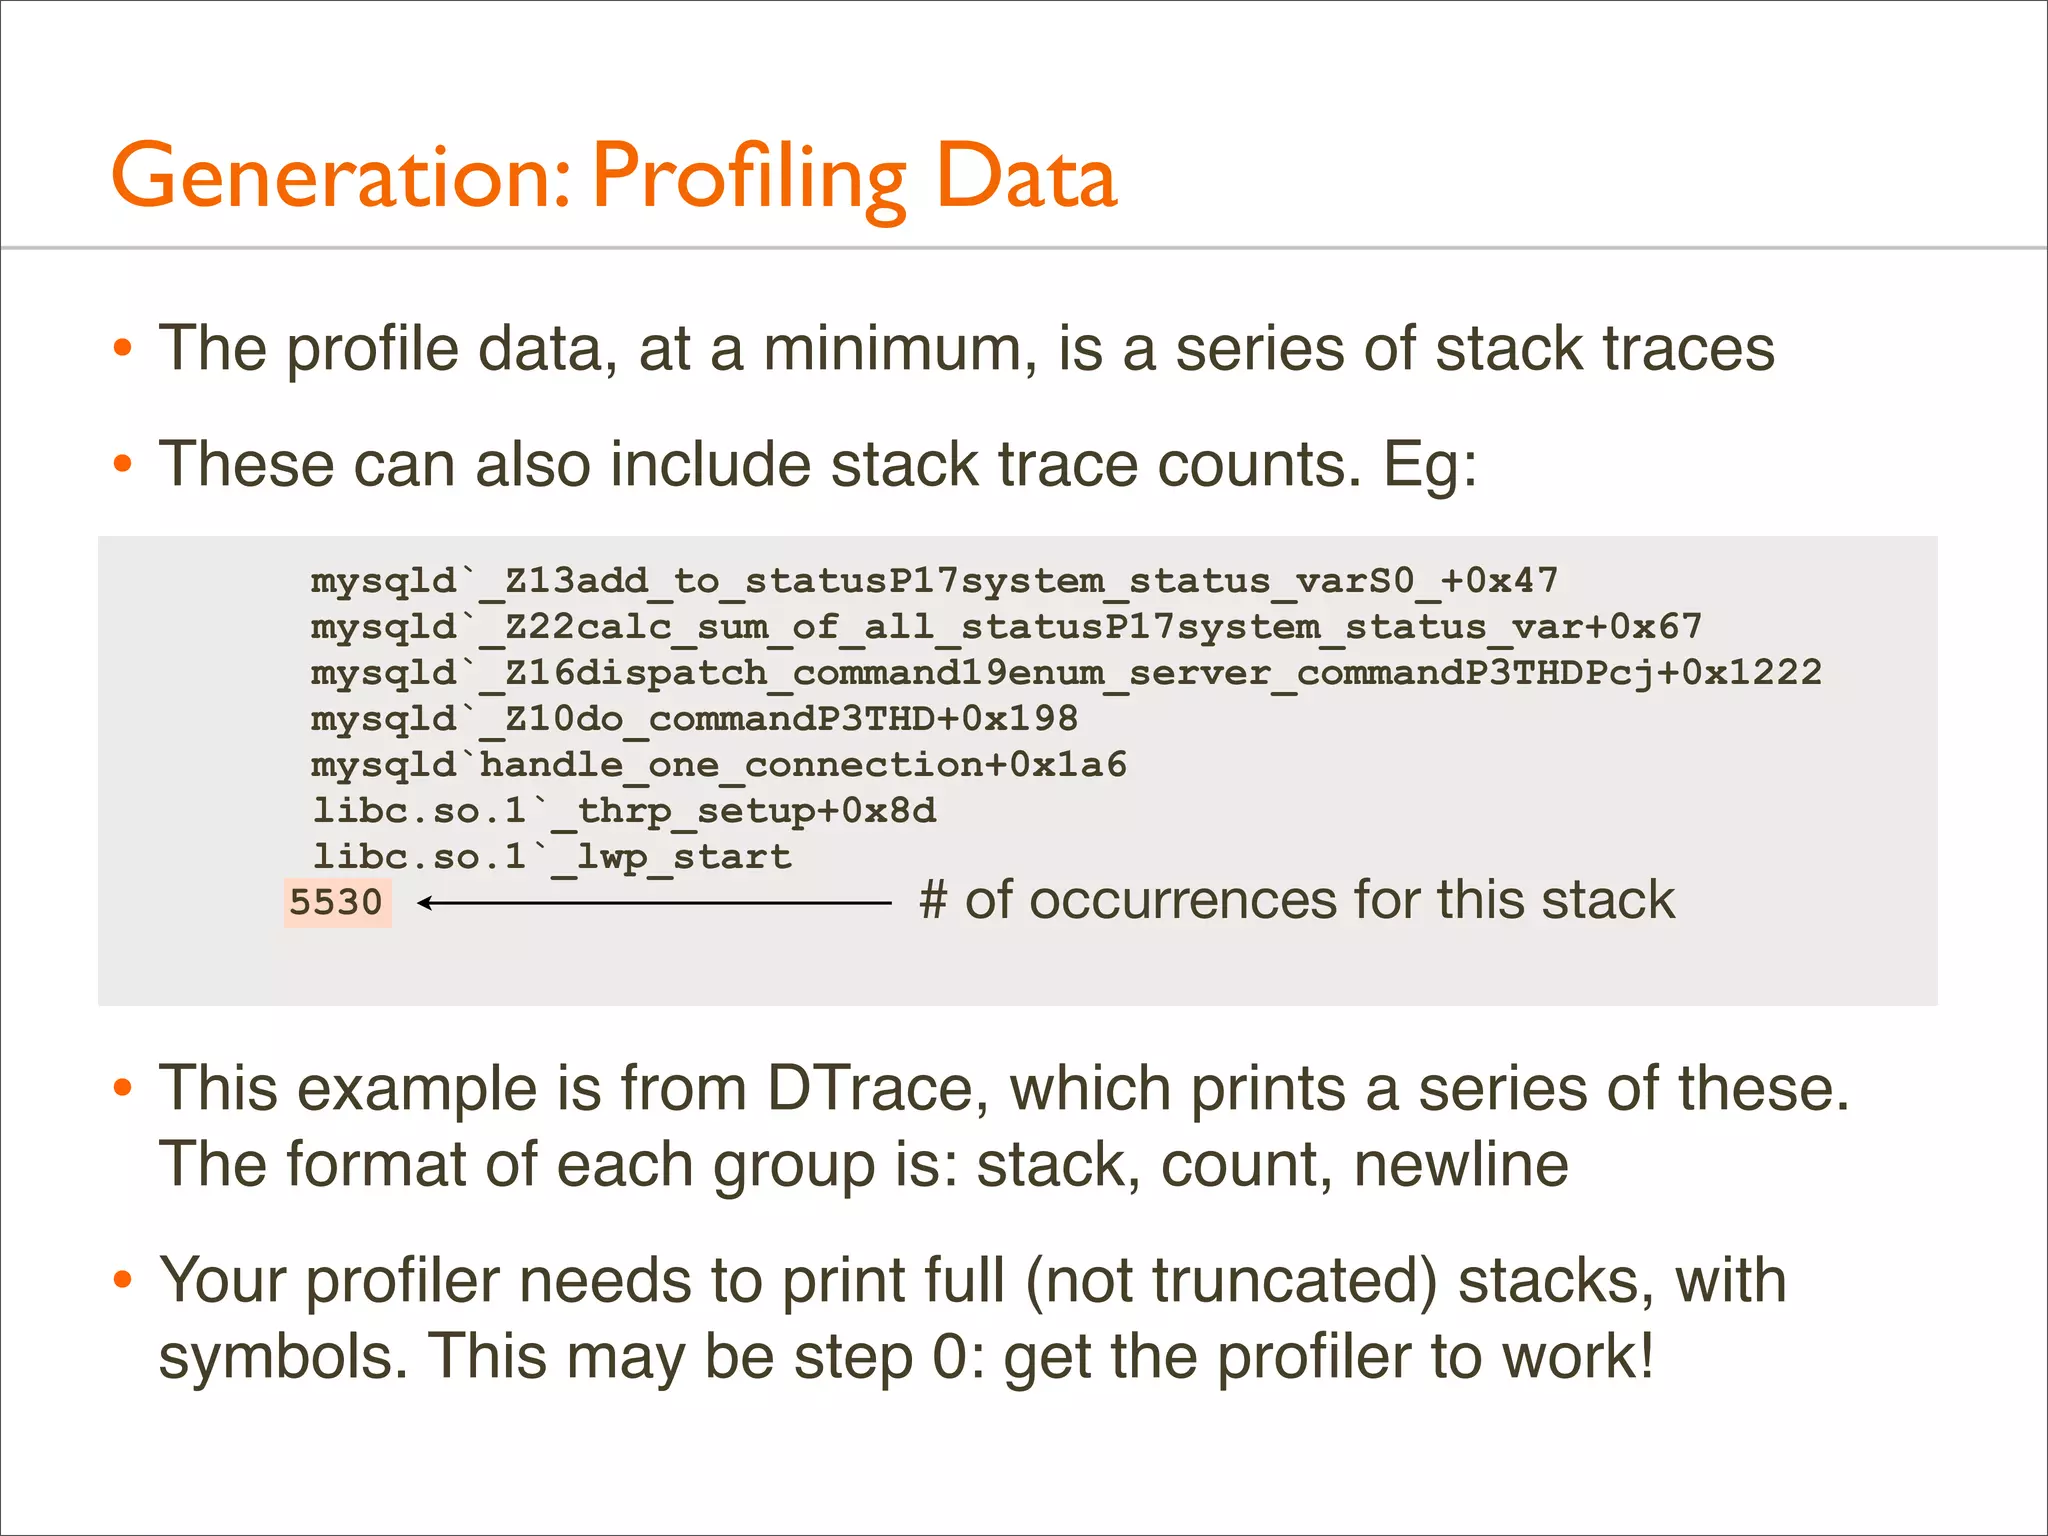
![Example: Profile Data
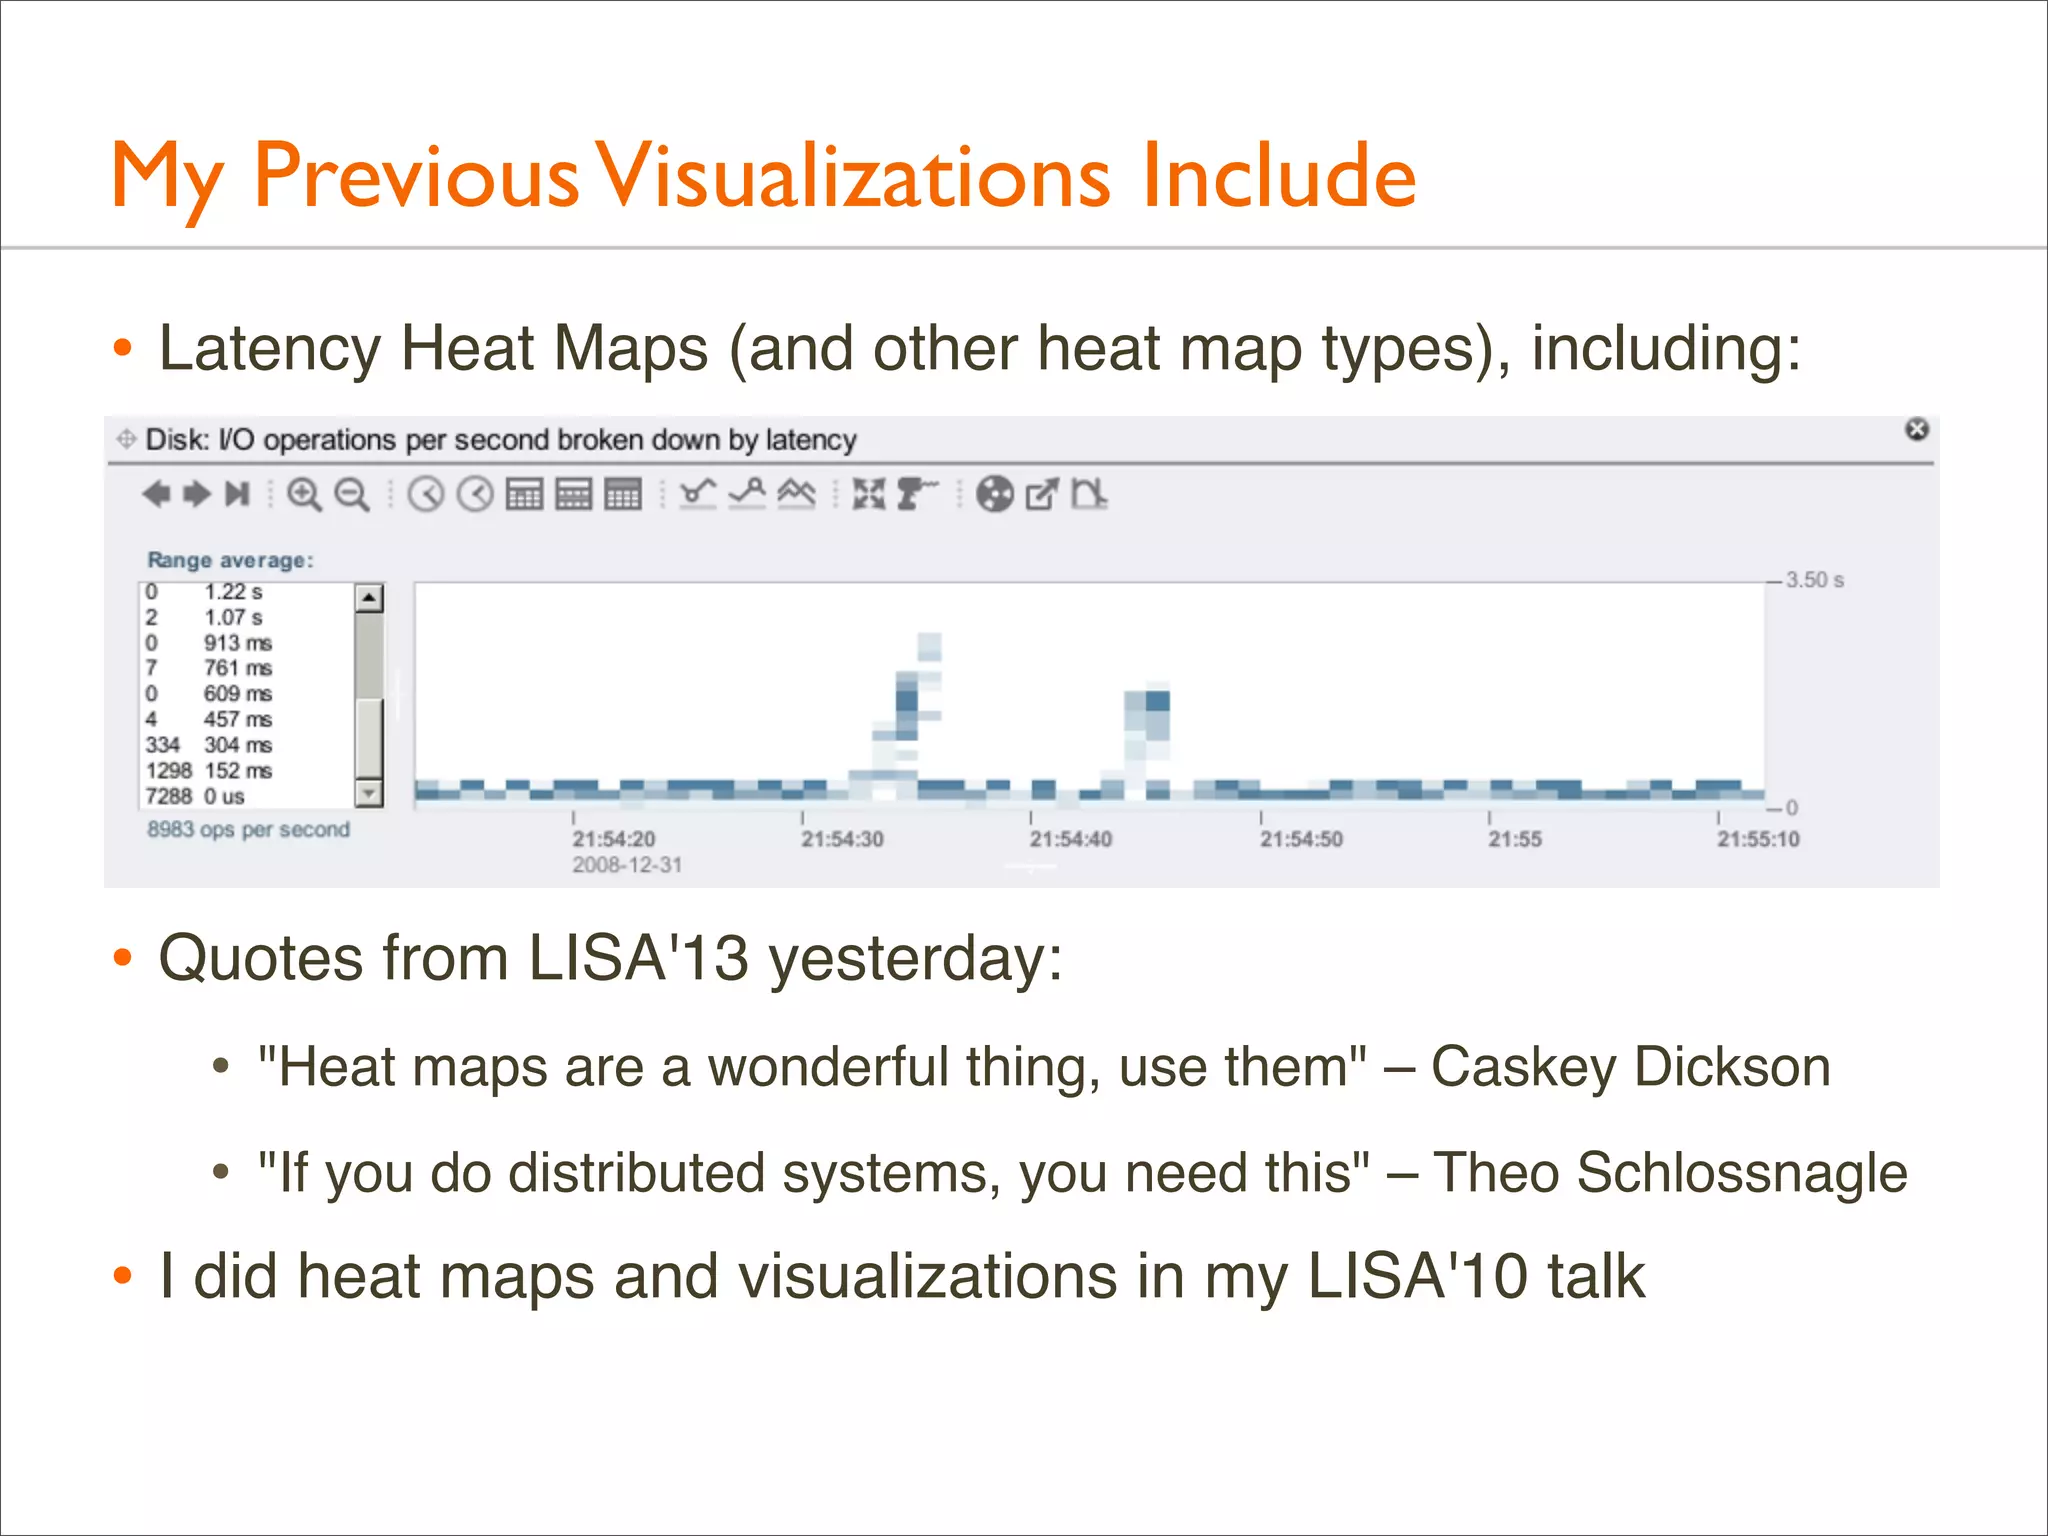
• Over 500,000 lines were elided from that output (“[...]”)
• Full output looks like this...](https://image.slidesharecdn.com/lisa13flamegraphs-131107112122-phpapp01/75/Blazing-Performance-with-Flame-Graphs-14-2048.jpg)


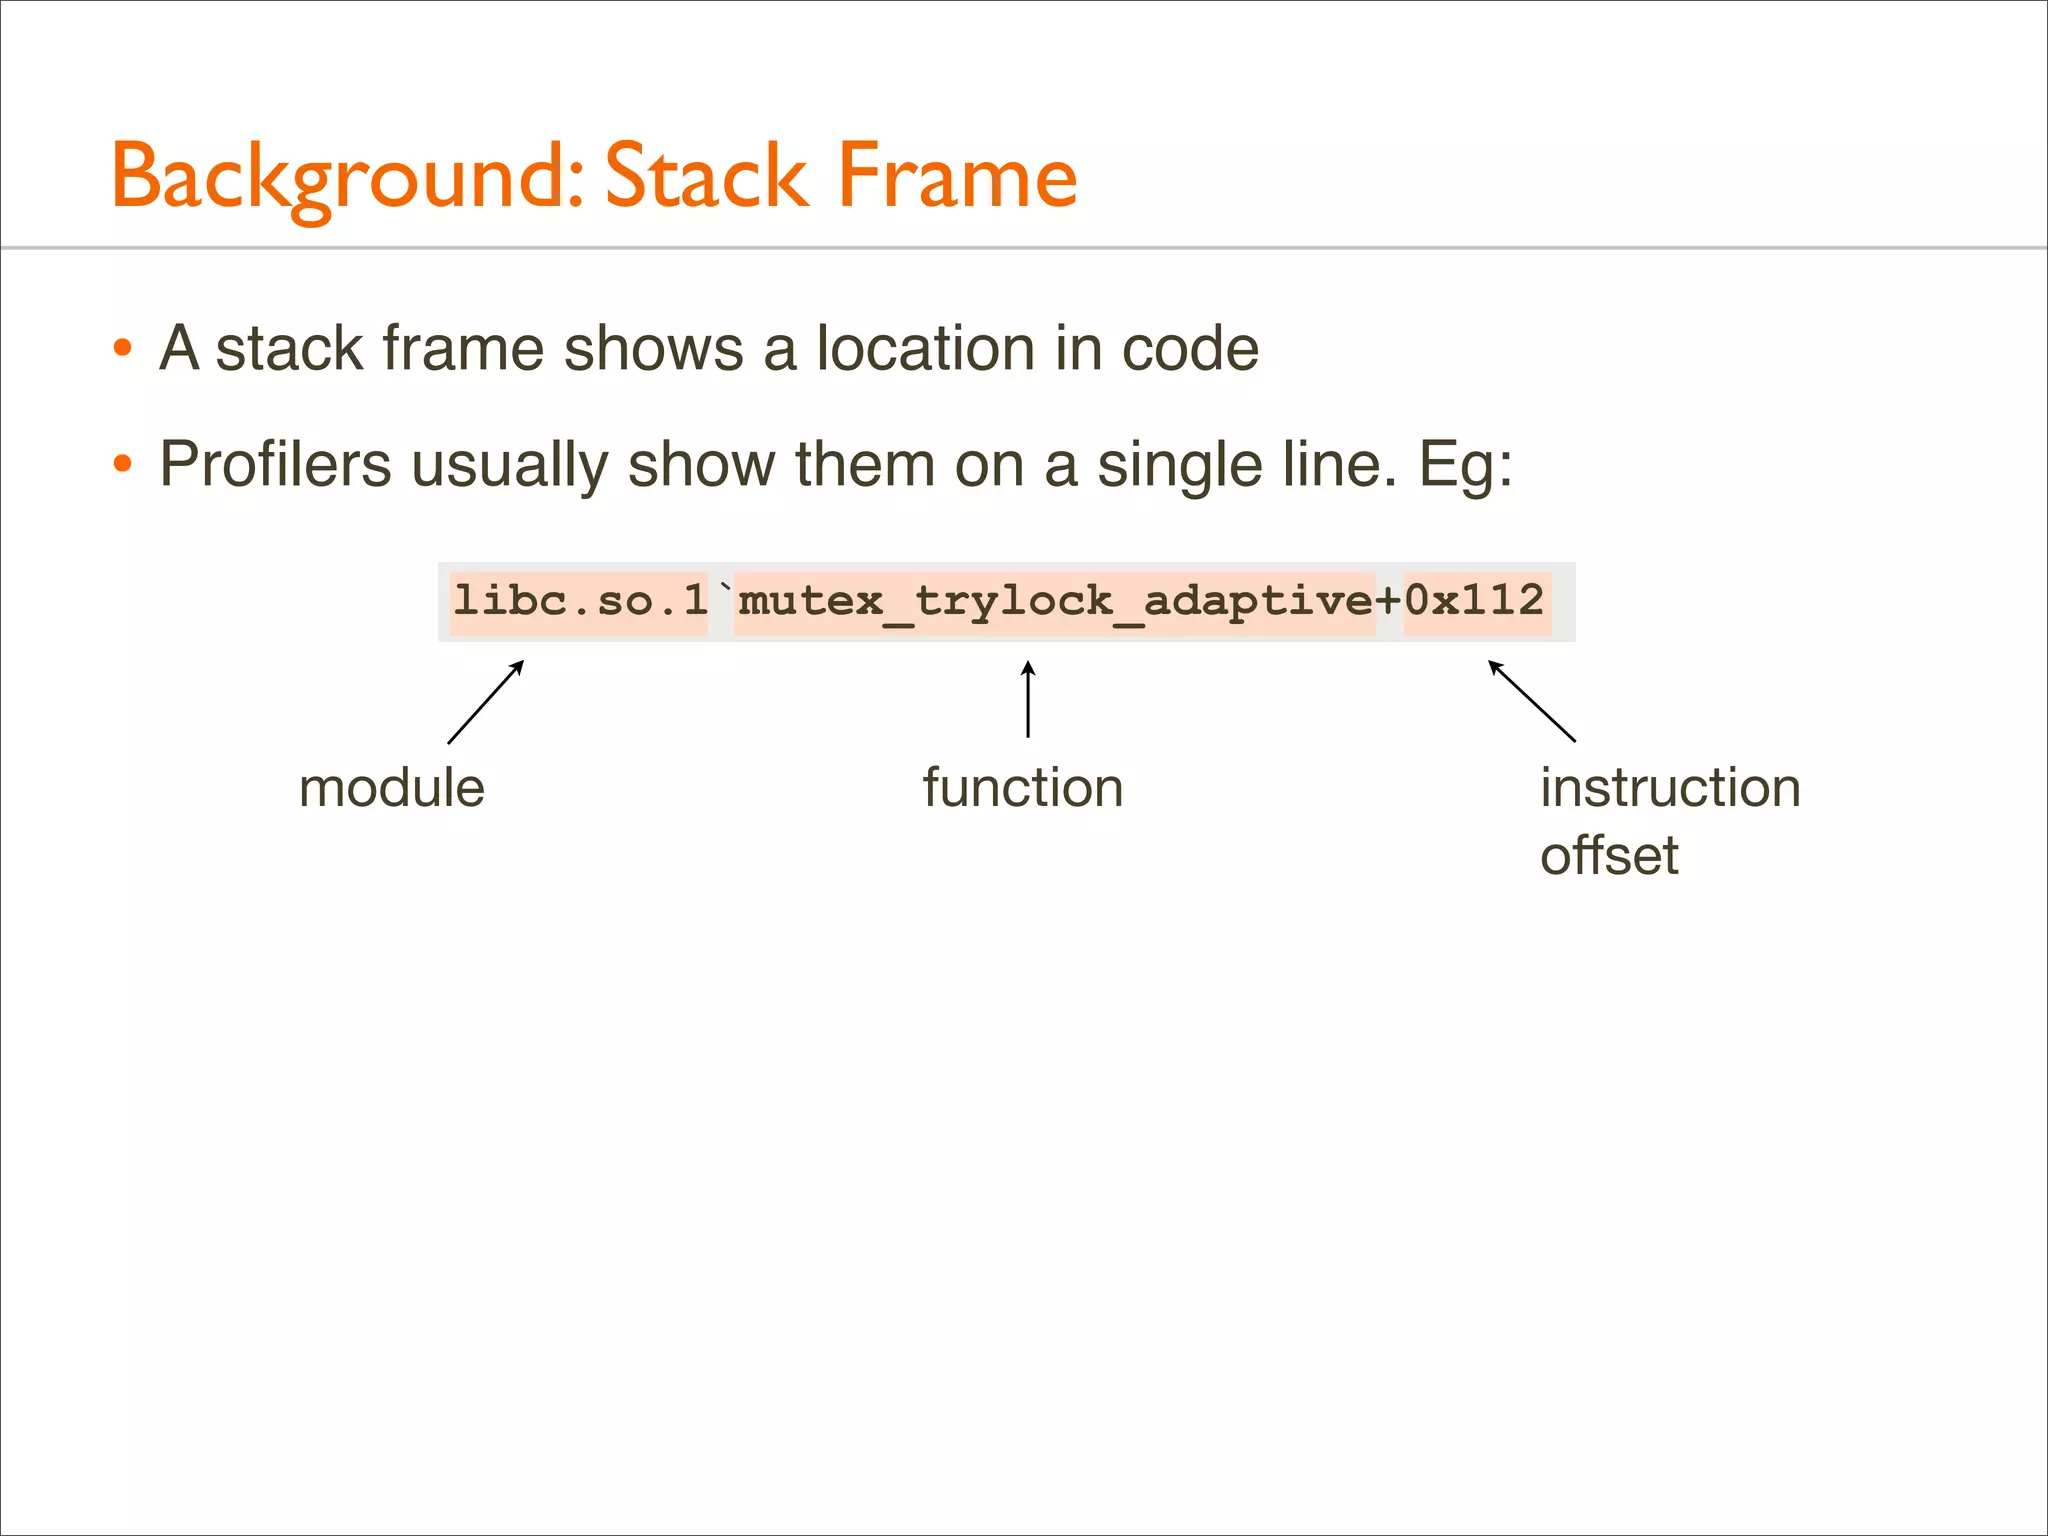
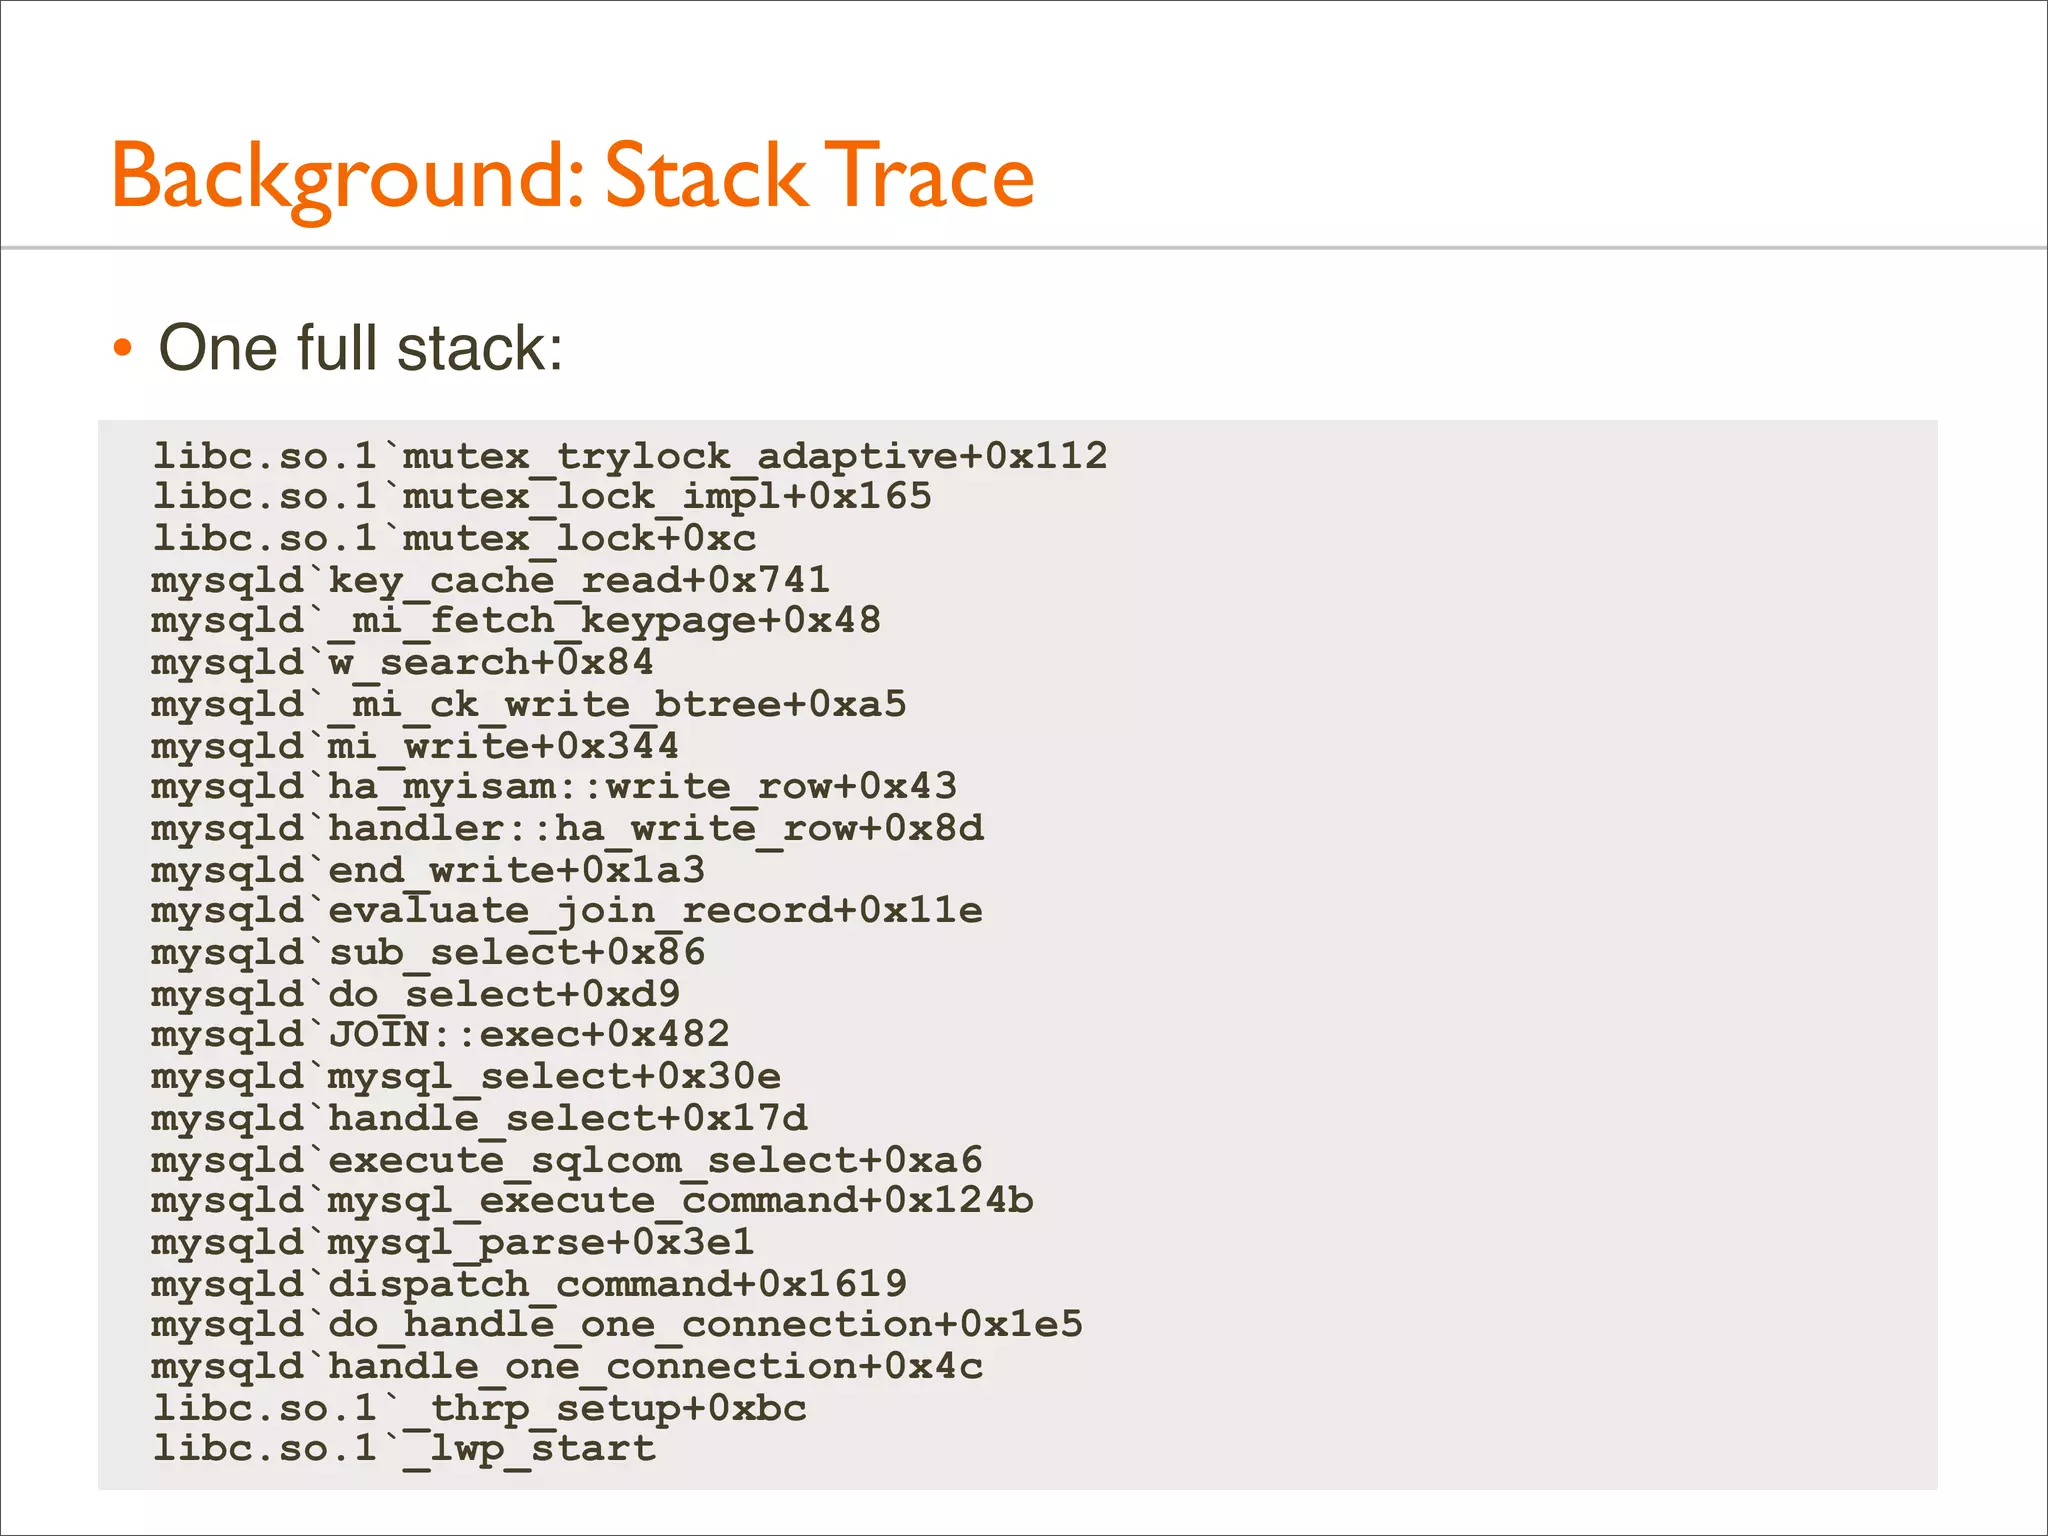
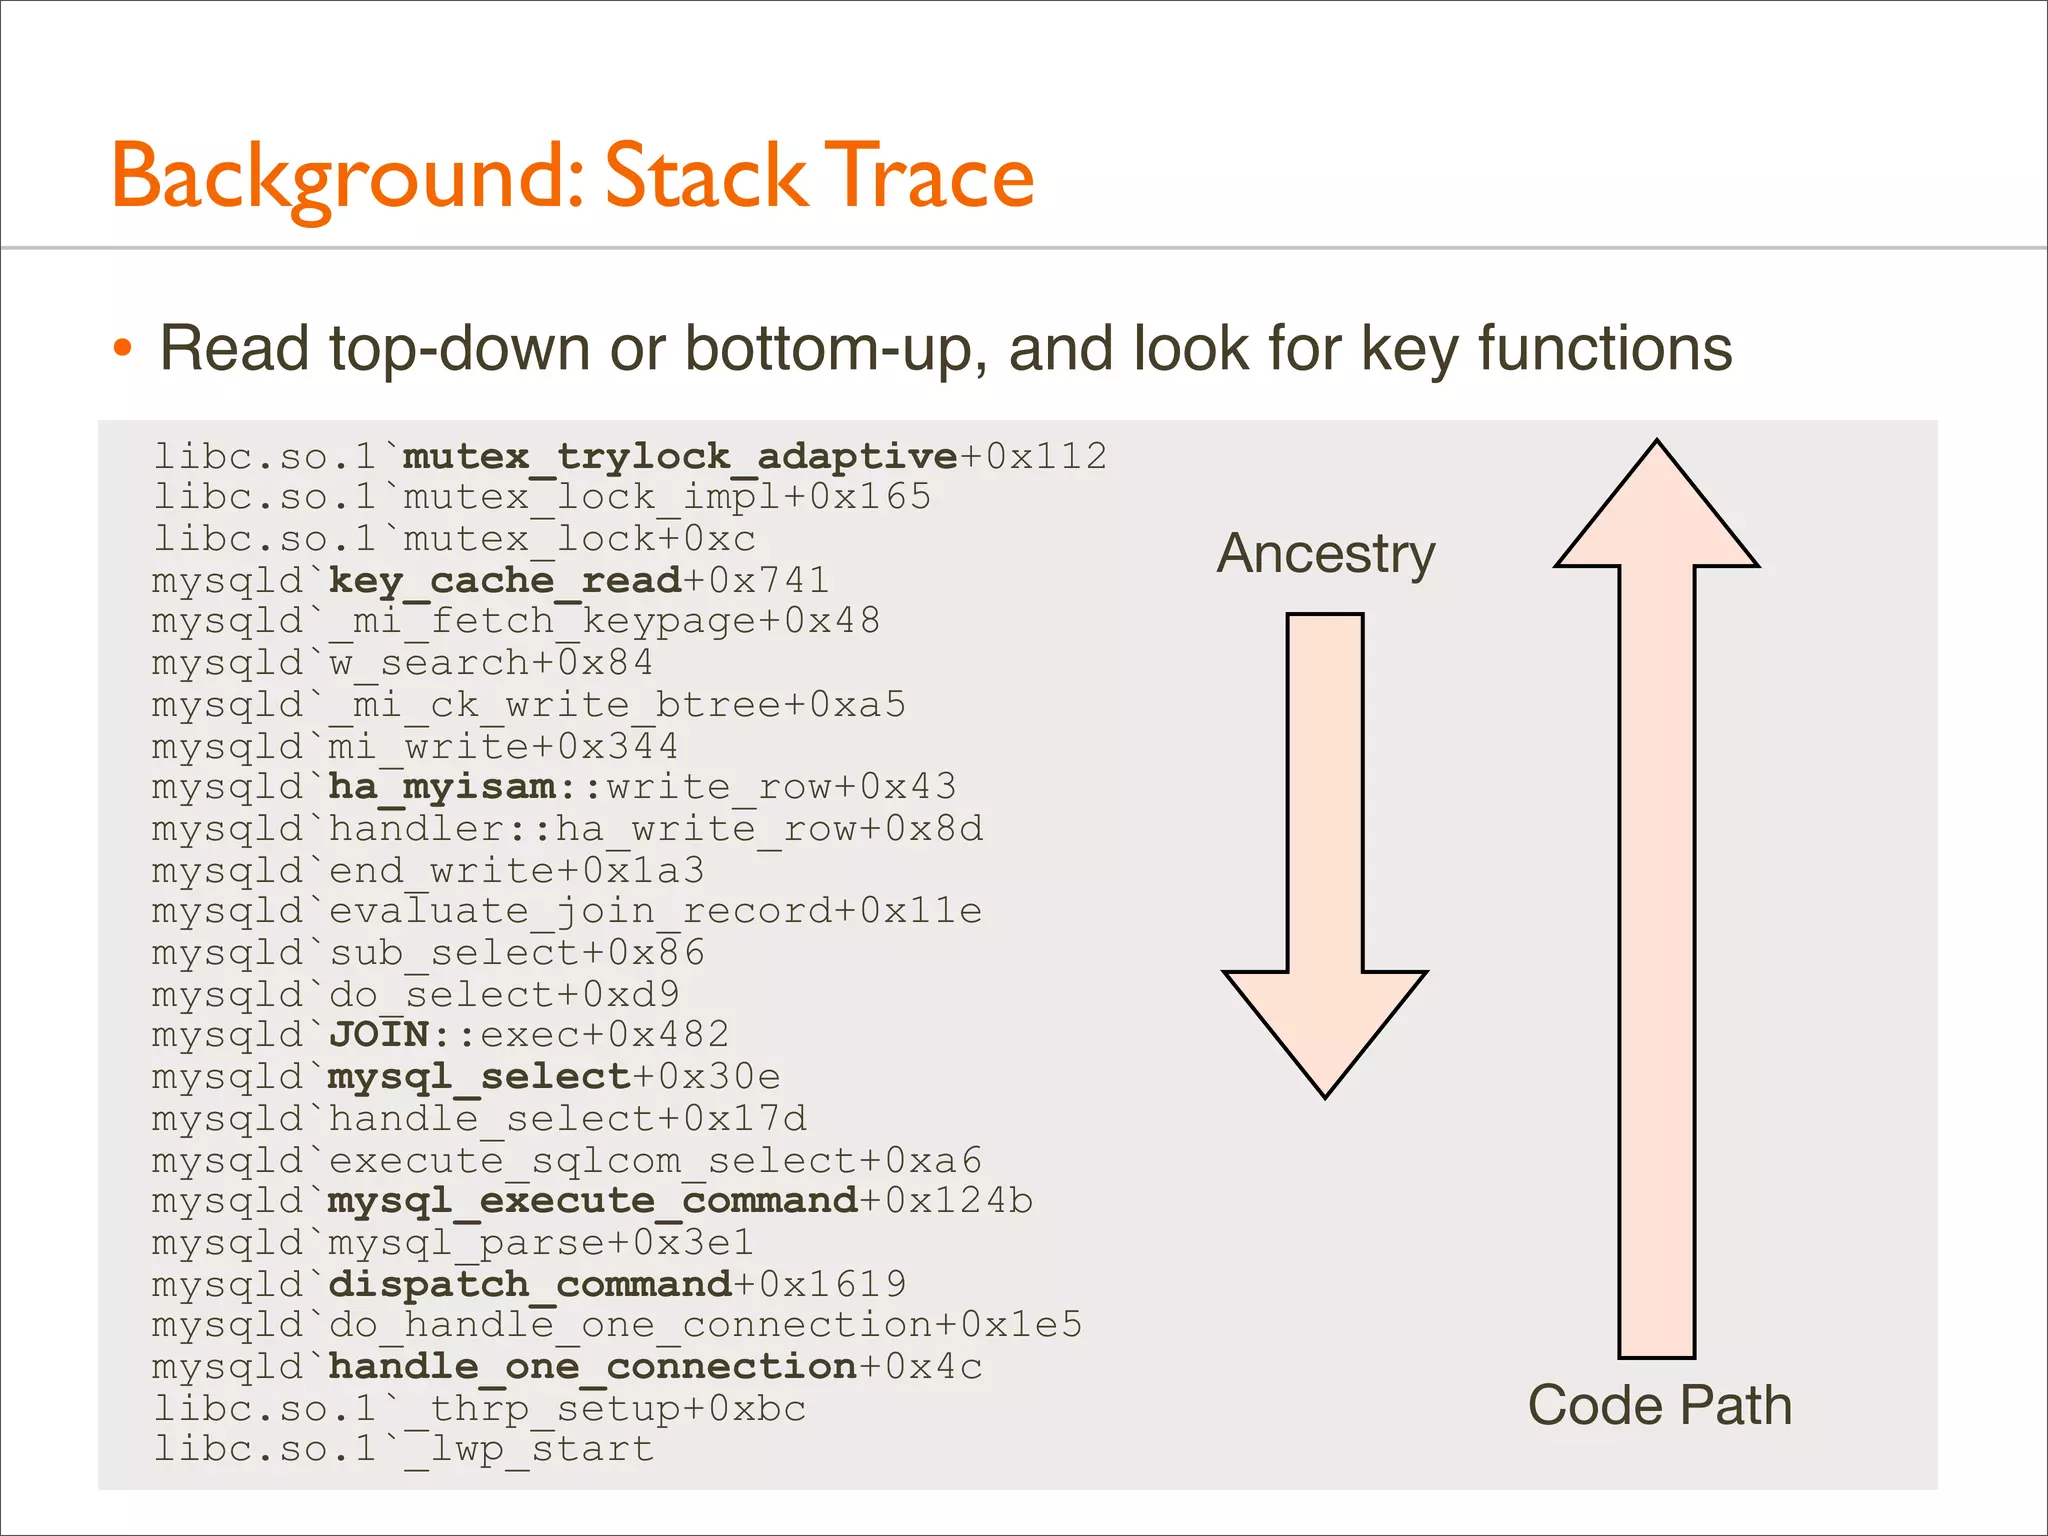
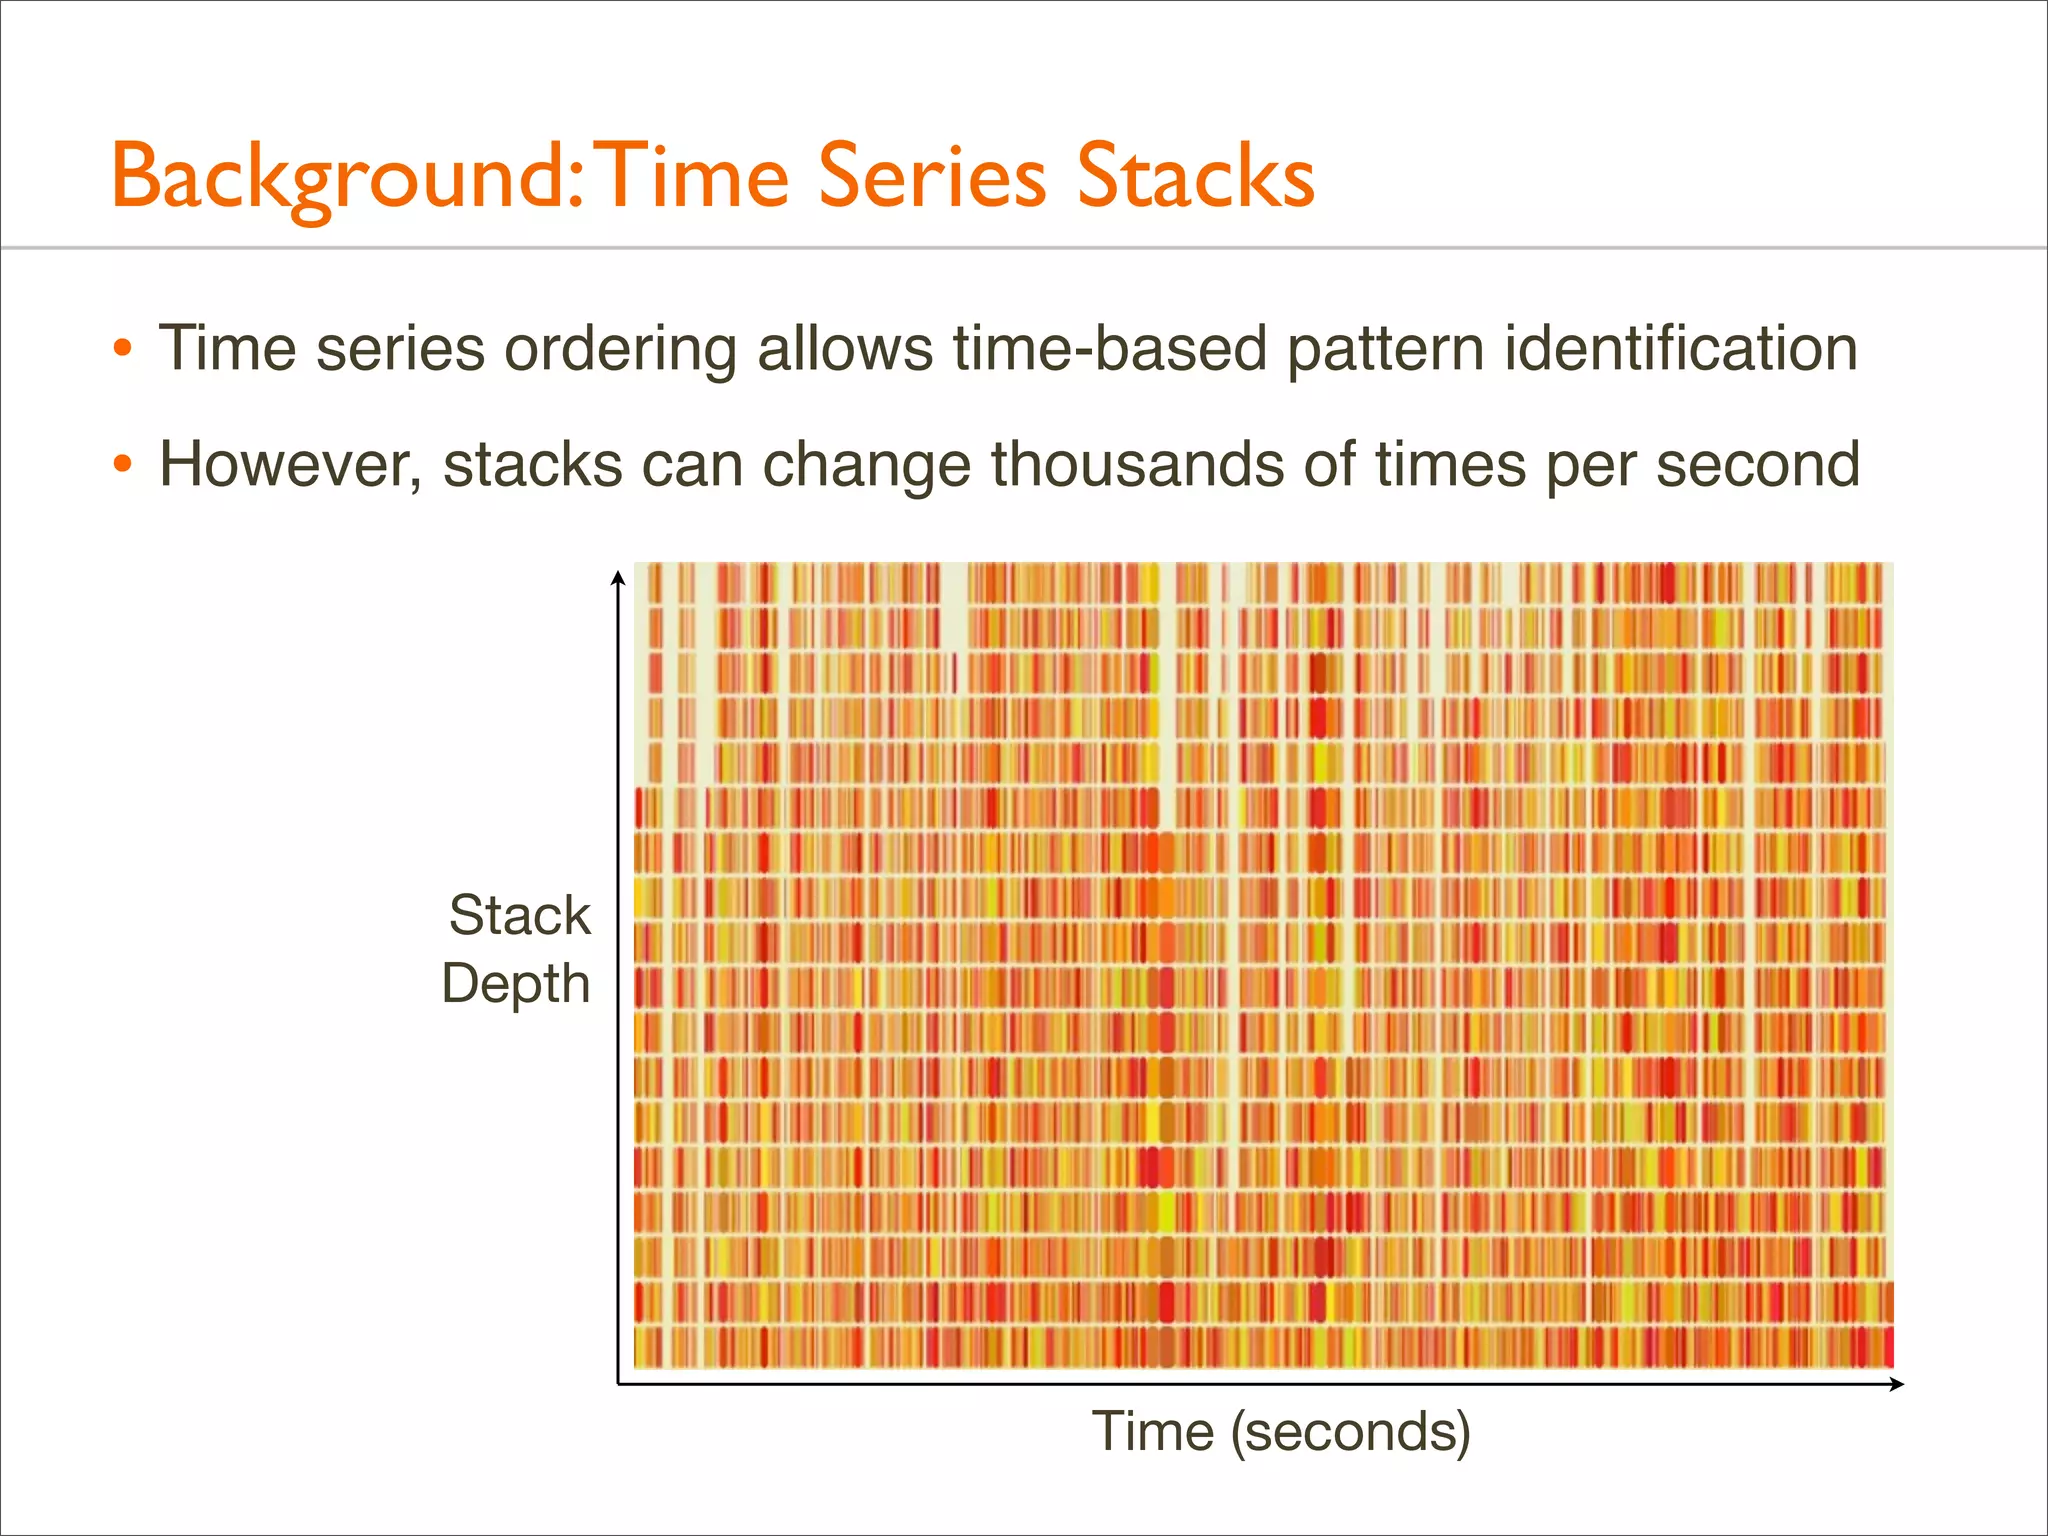
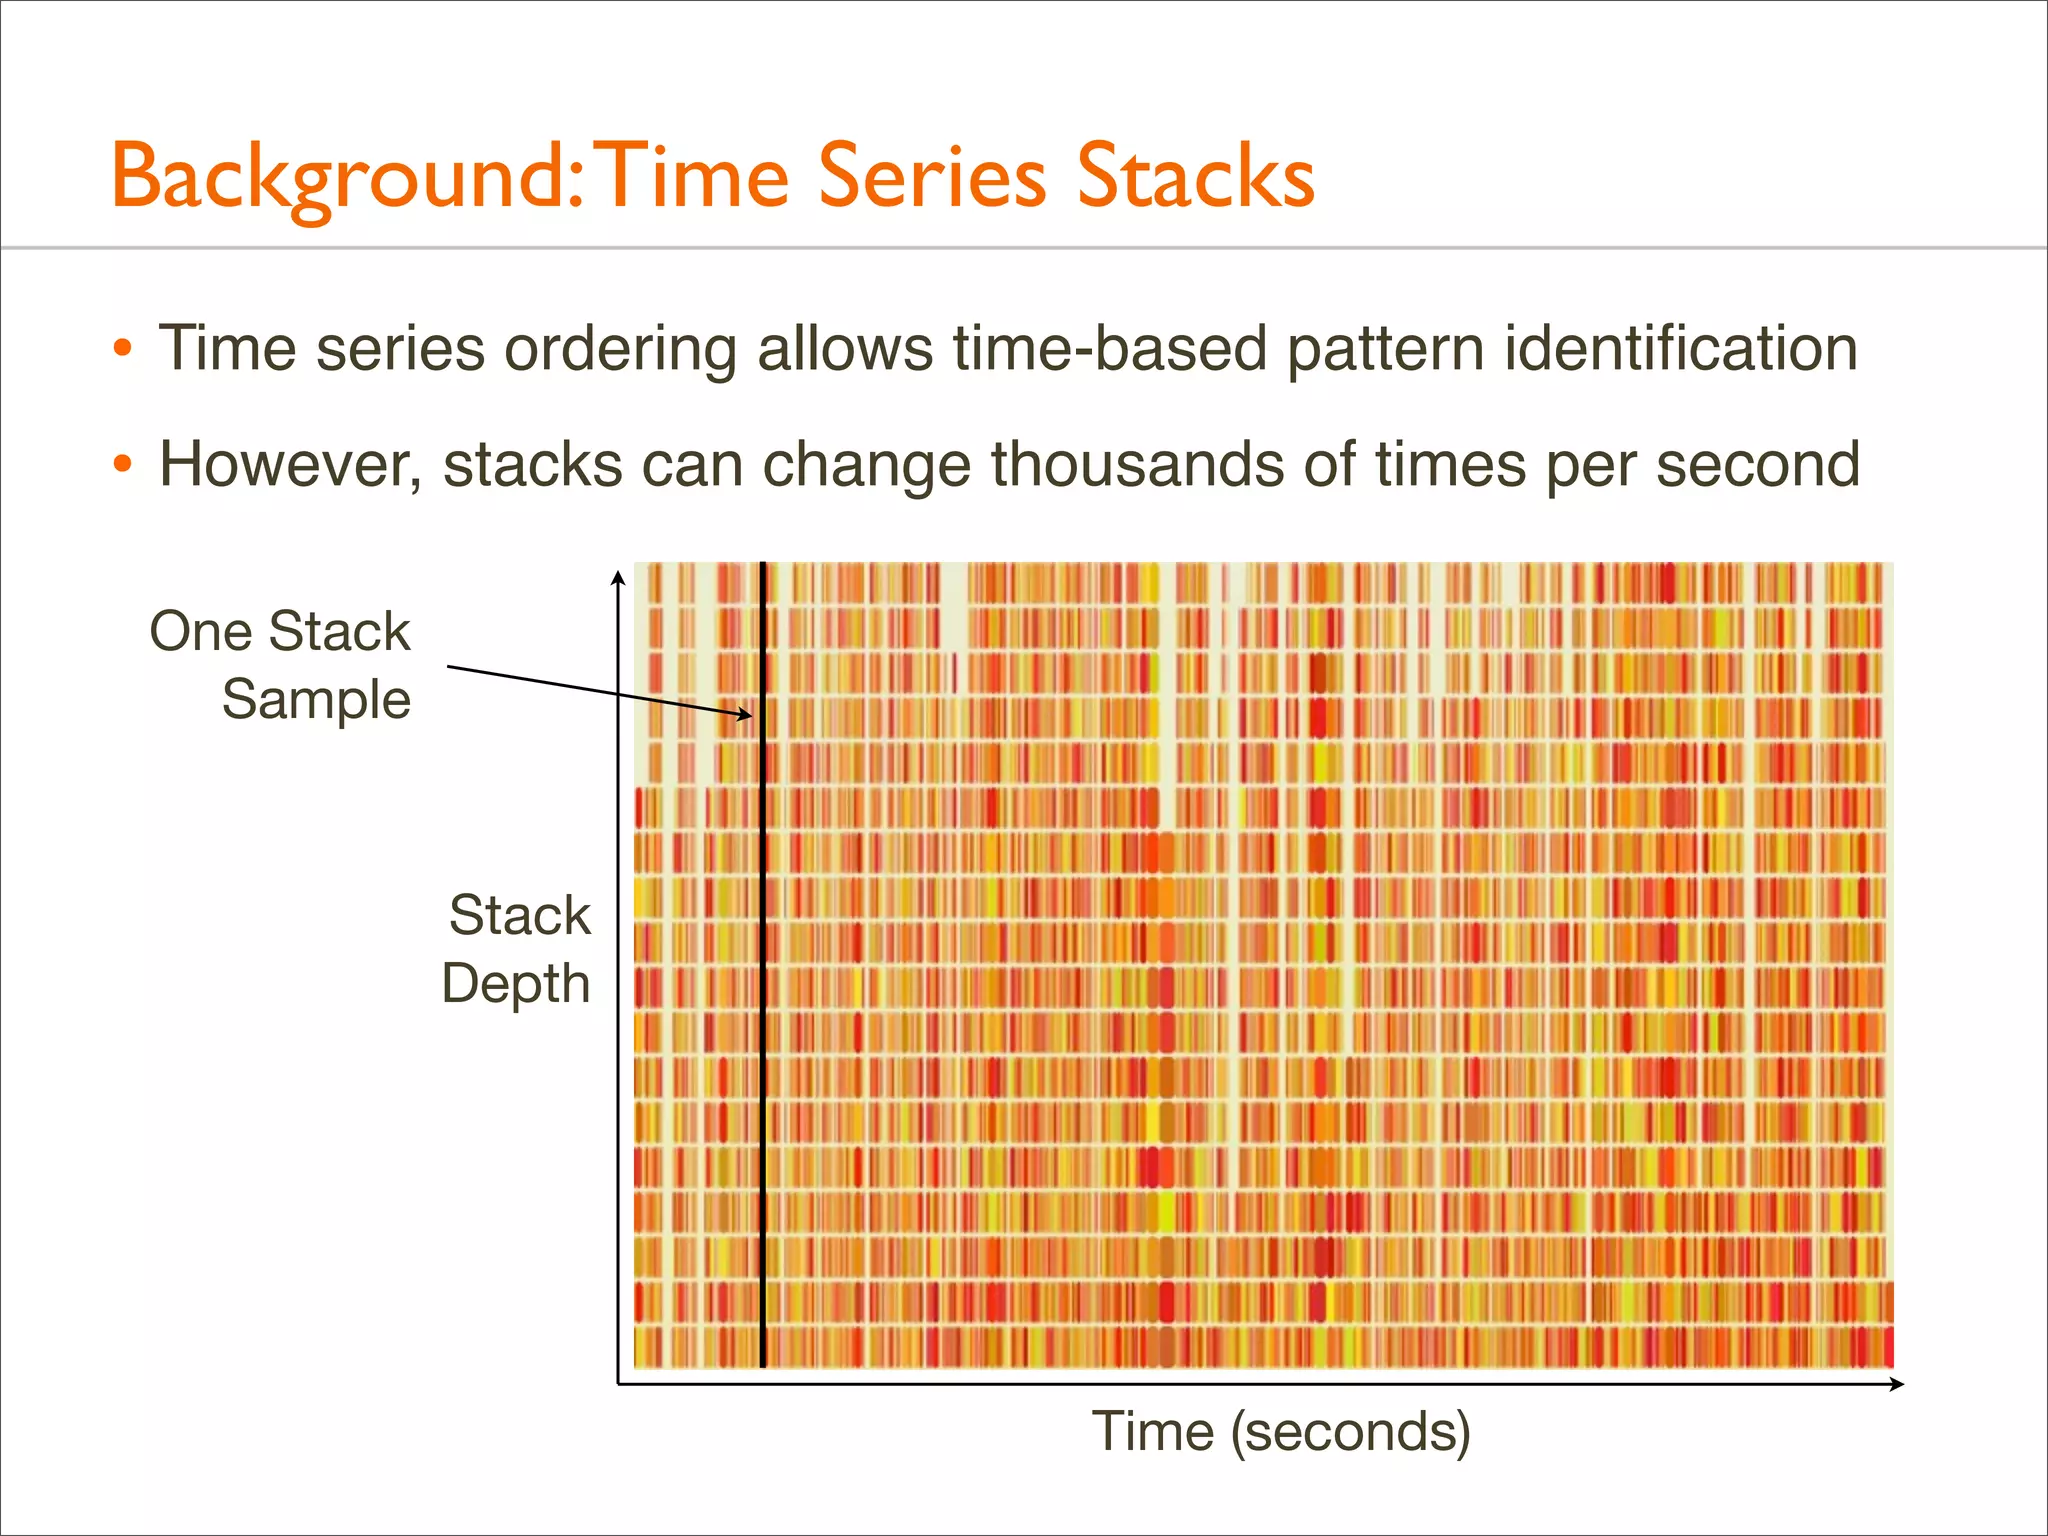
![Background: Stack Trace
• A stack trace is a list of frames. Their index is the stack depth:
current
libc.so.1`mutex_trylock_adaptive+0x112 24
parent
parent
libc.so.1`mutex_lock_impl+0x165
23
parent
grand
parent
libc.so.1`mutex_lock+0xc
22
Stack
Depth
[...]
libc.so.1`_lwp_start
0](https://image.slidesharecdn.com/lisa13flamegraphs-131107112122-phpapp01/75/Blazing-Performance-with-Flame-Graphs-24-2048.jpg)

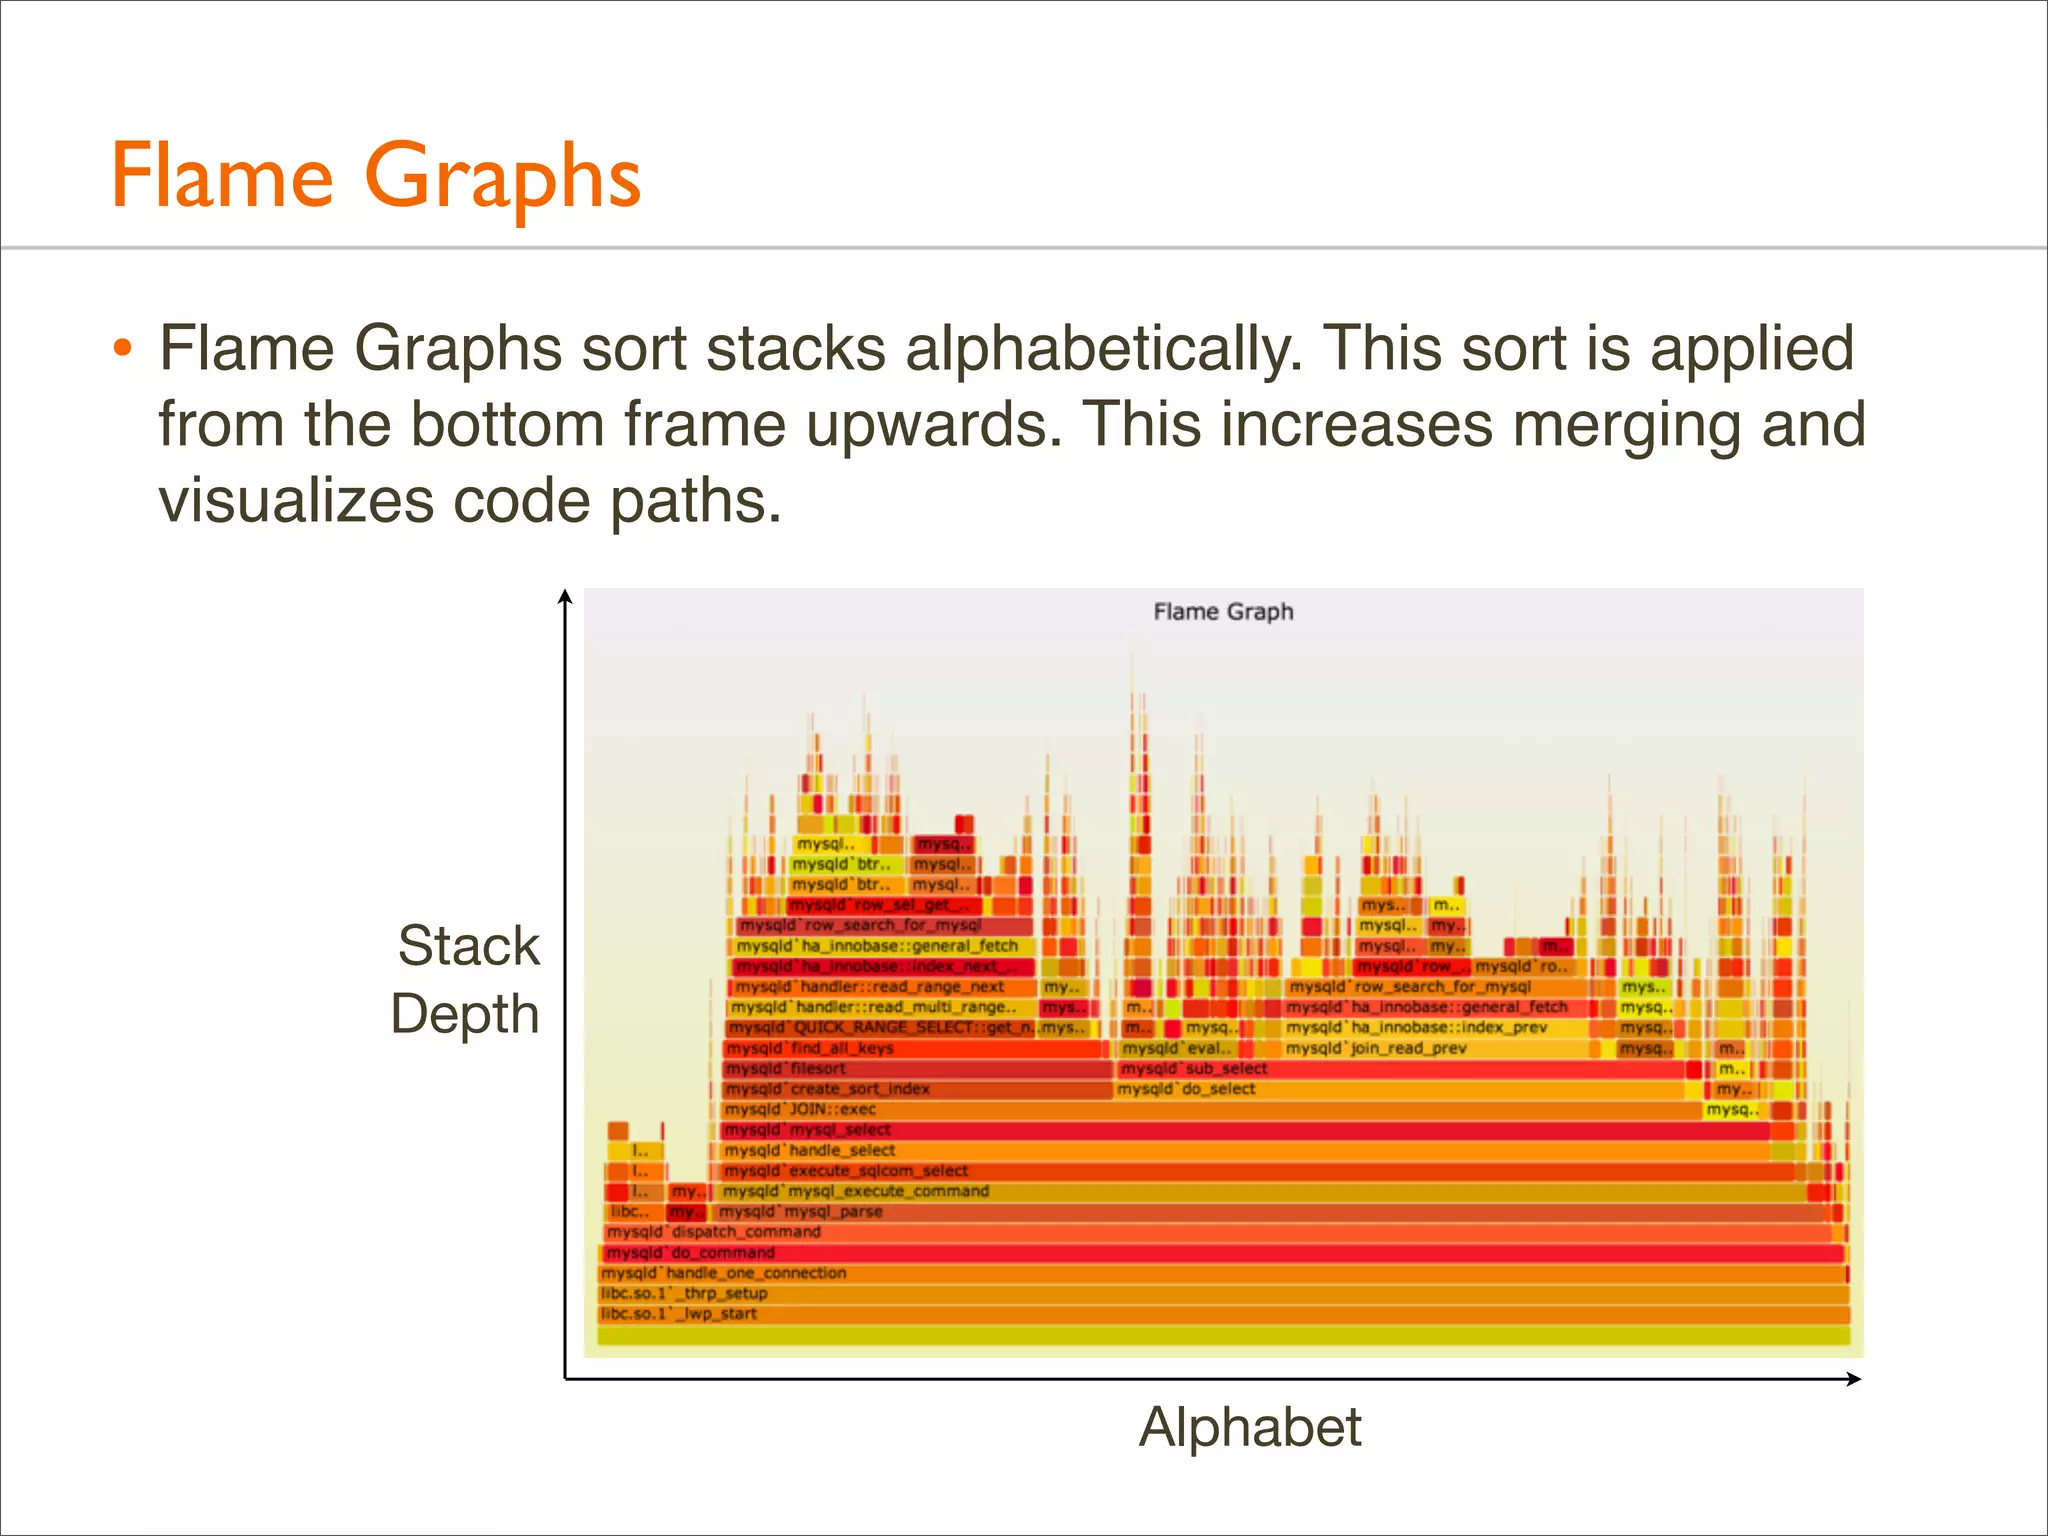
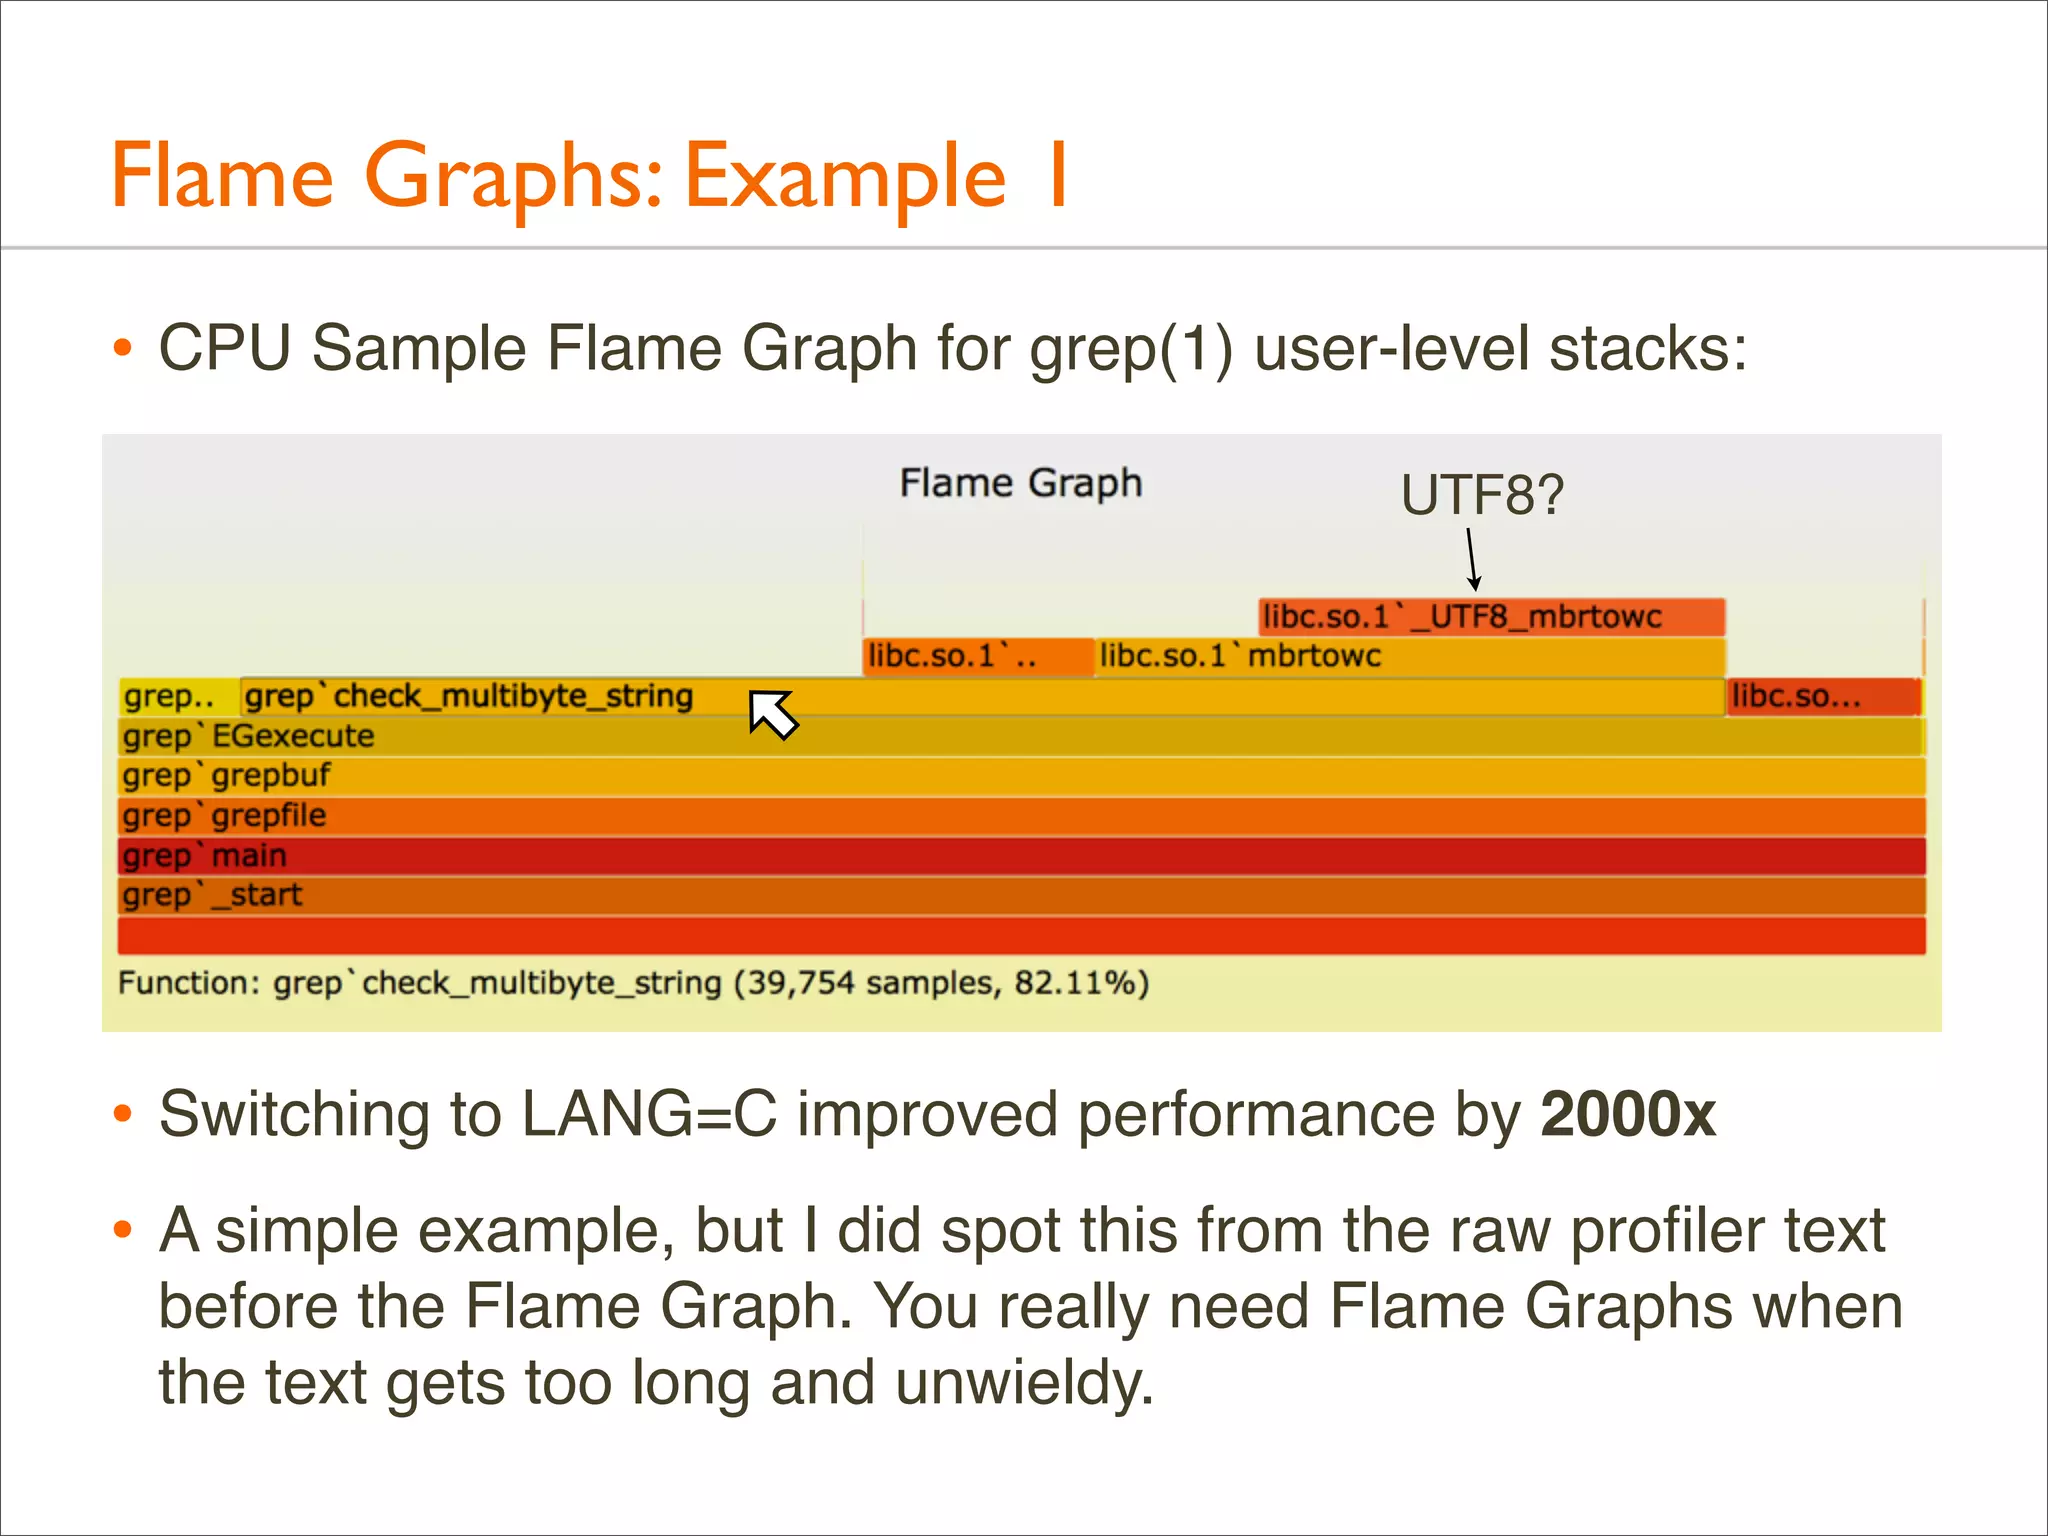
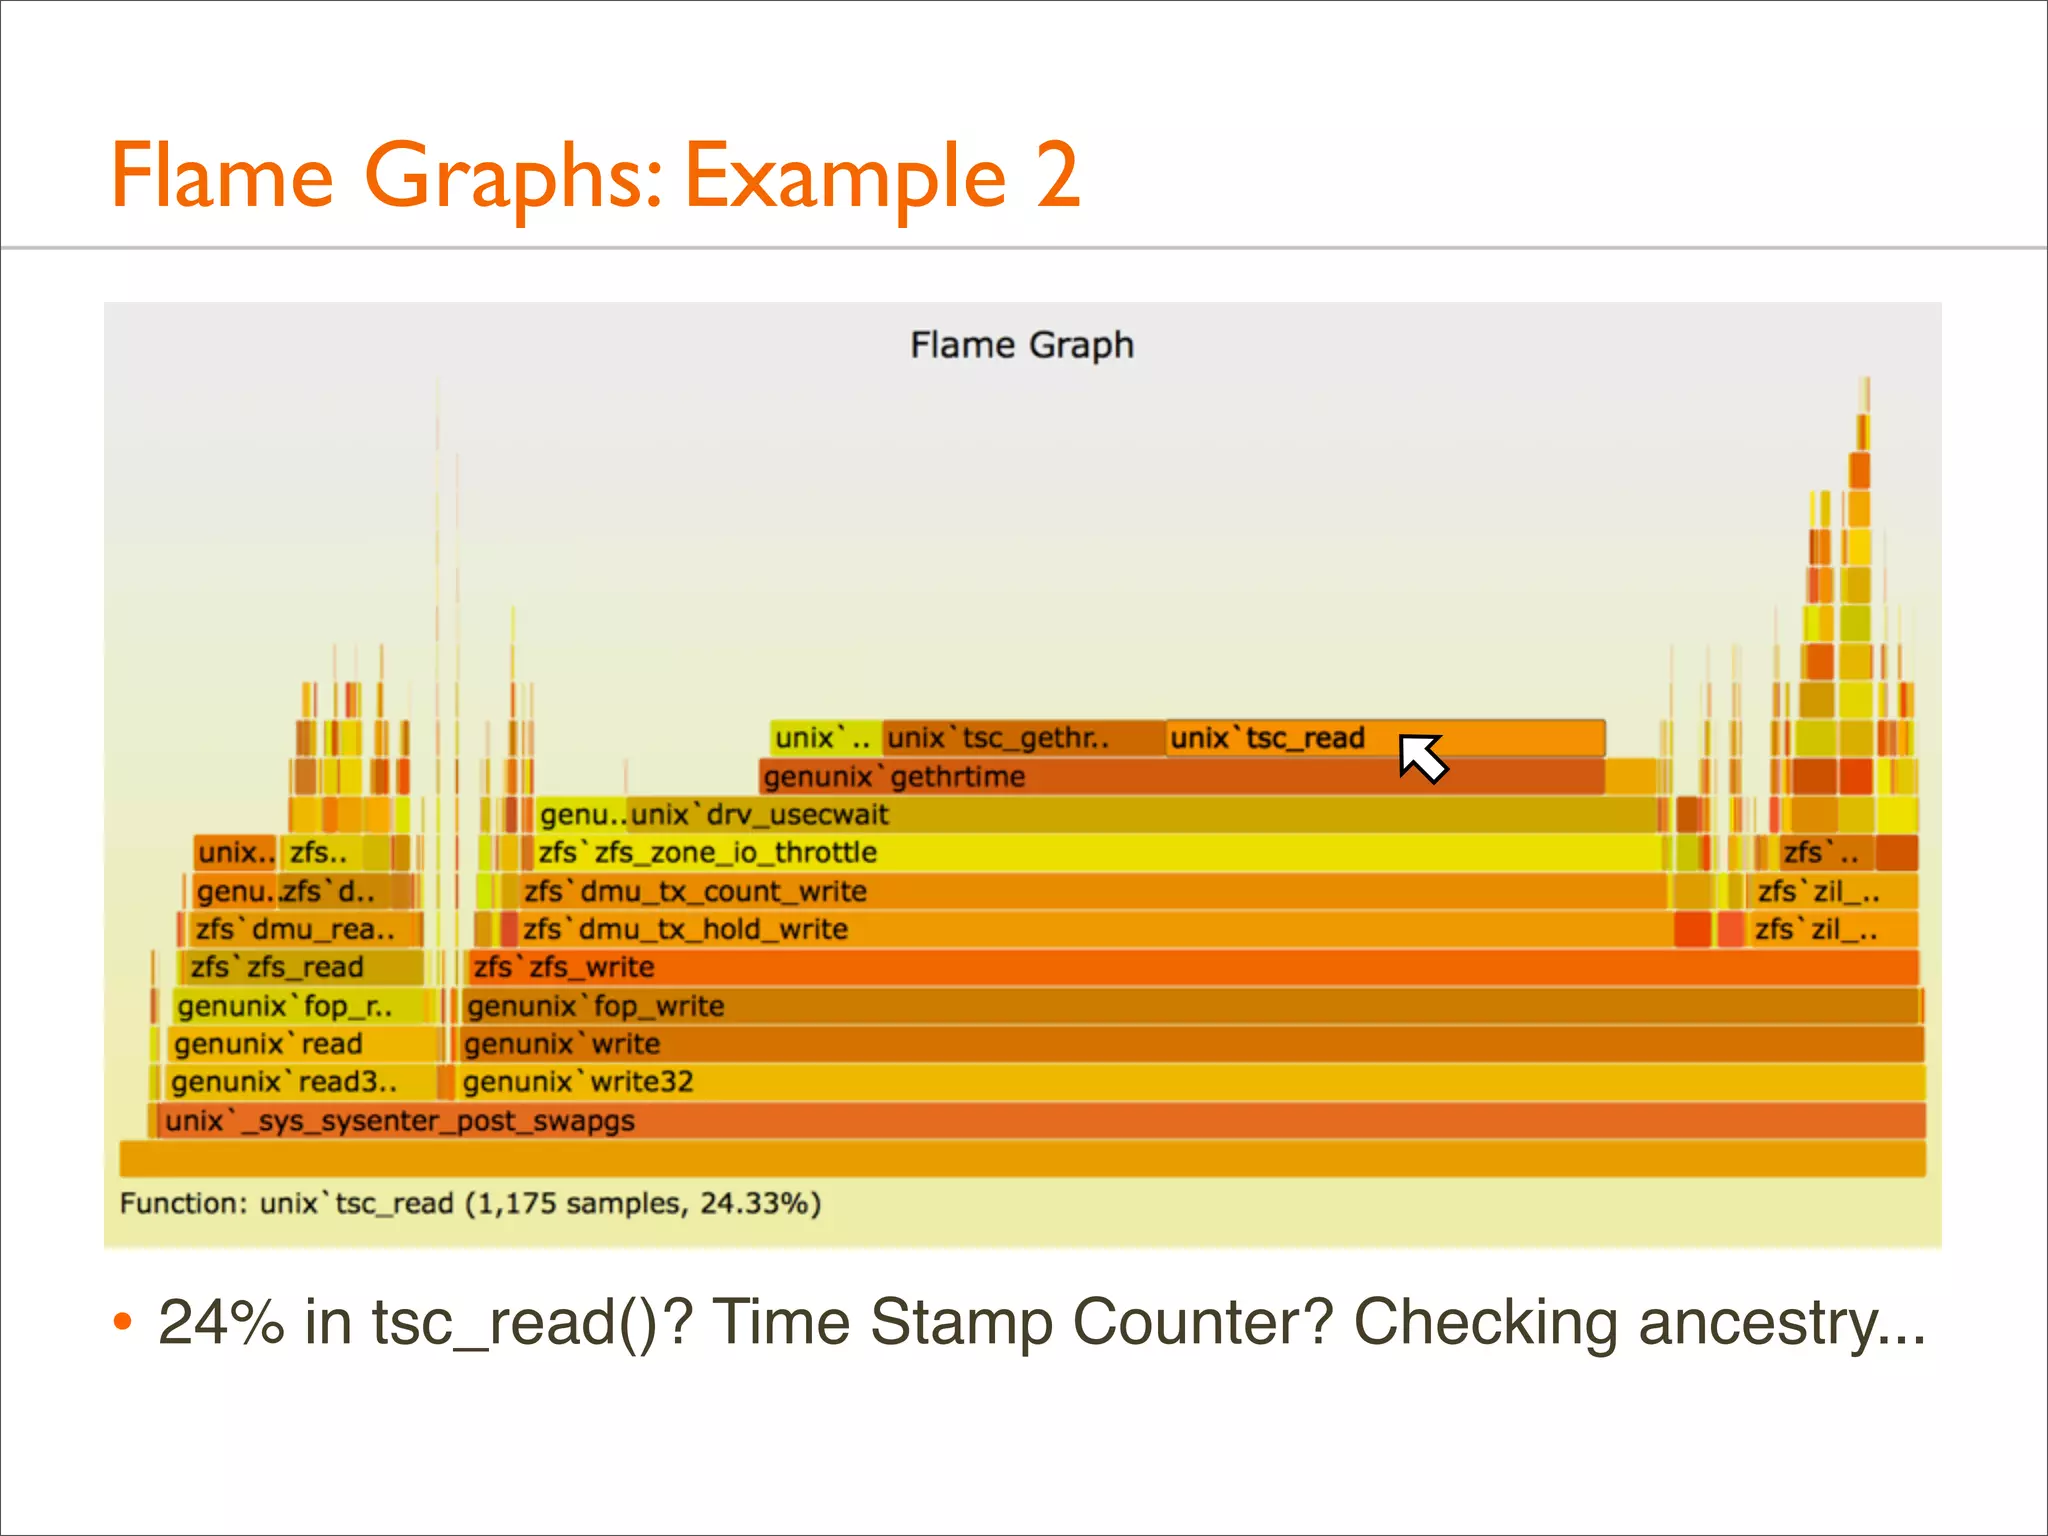
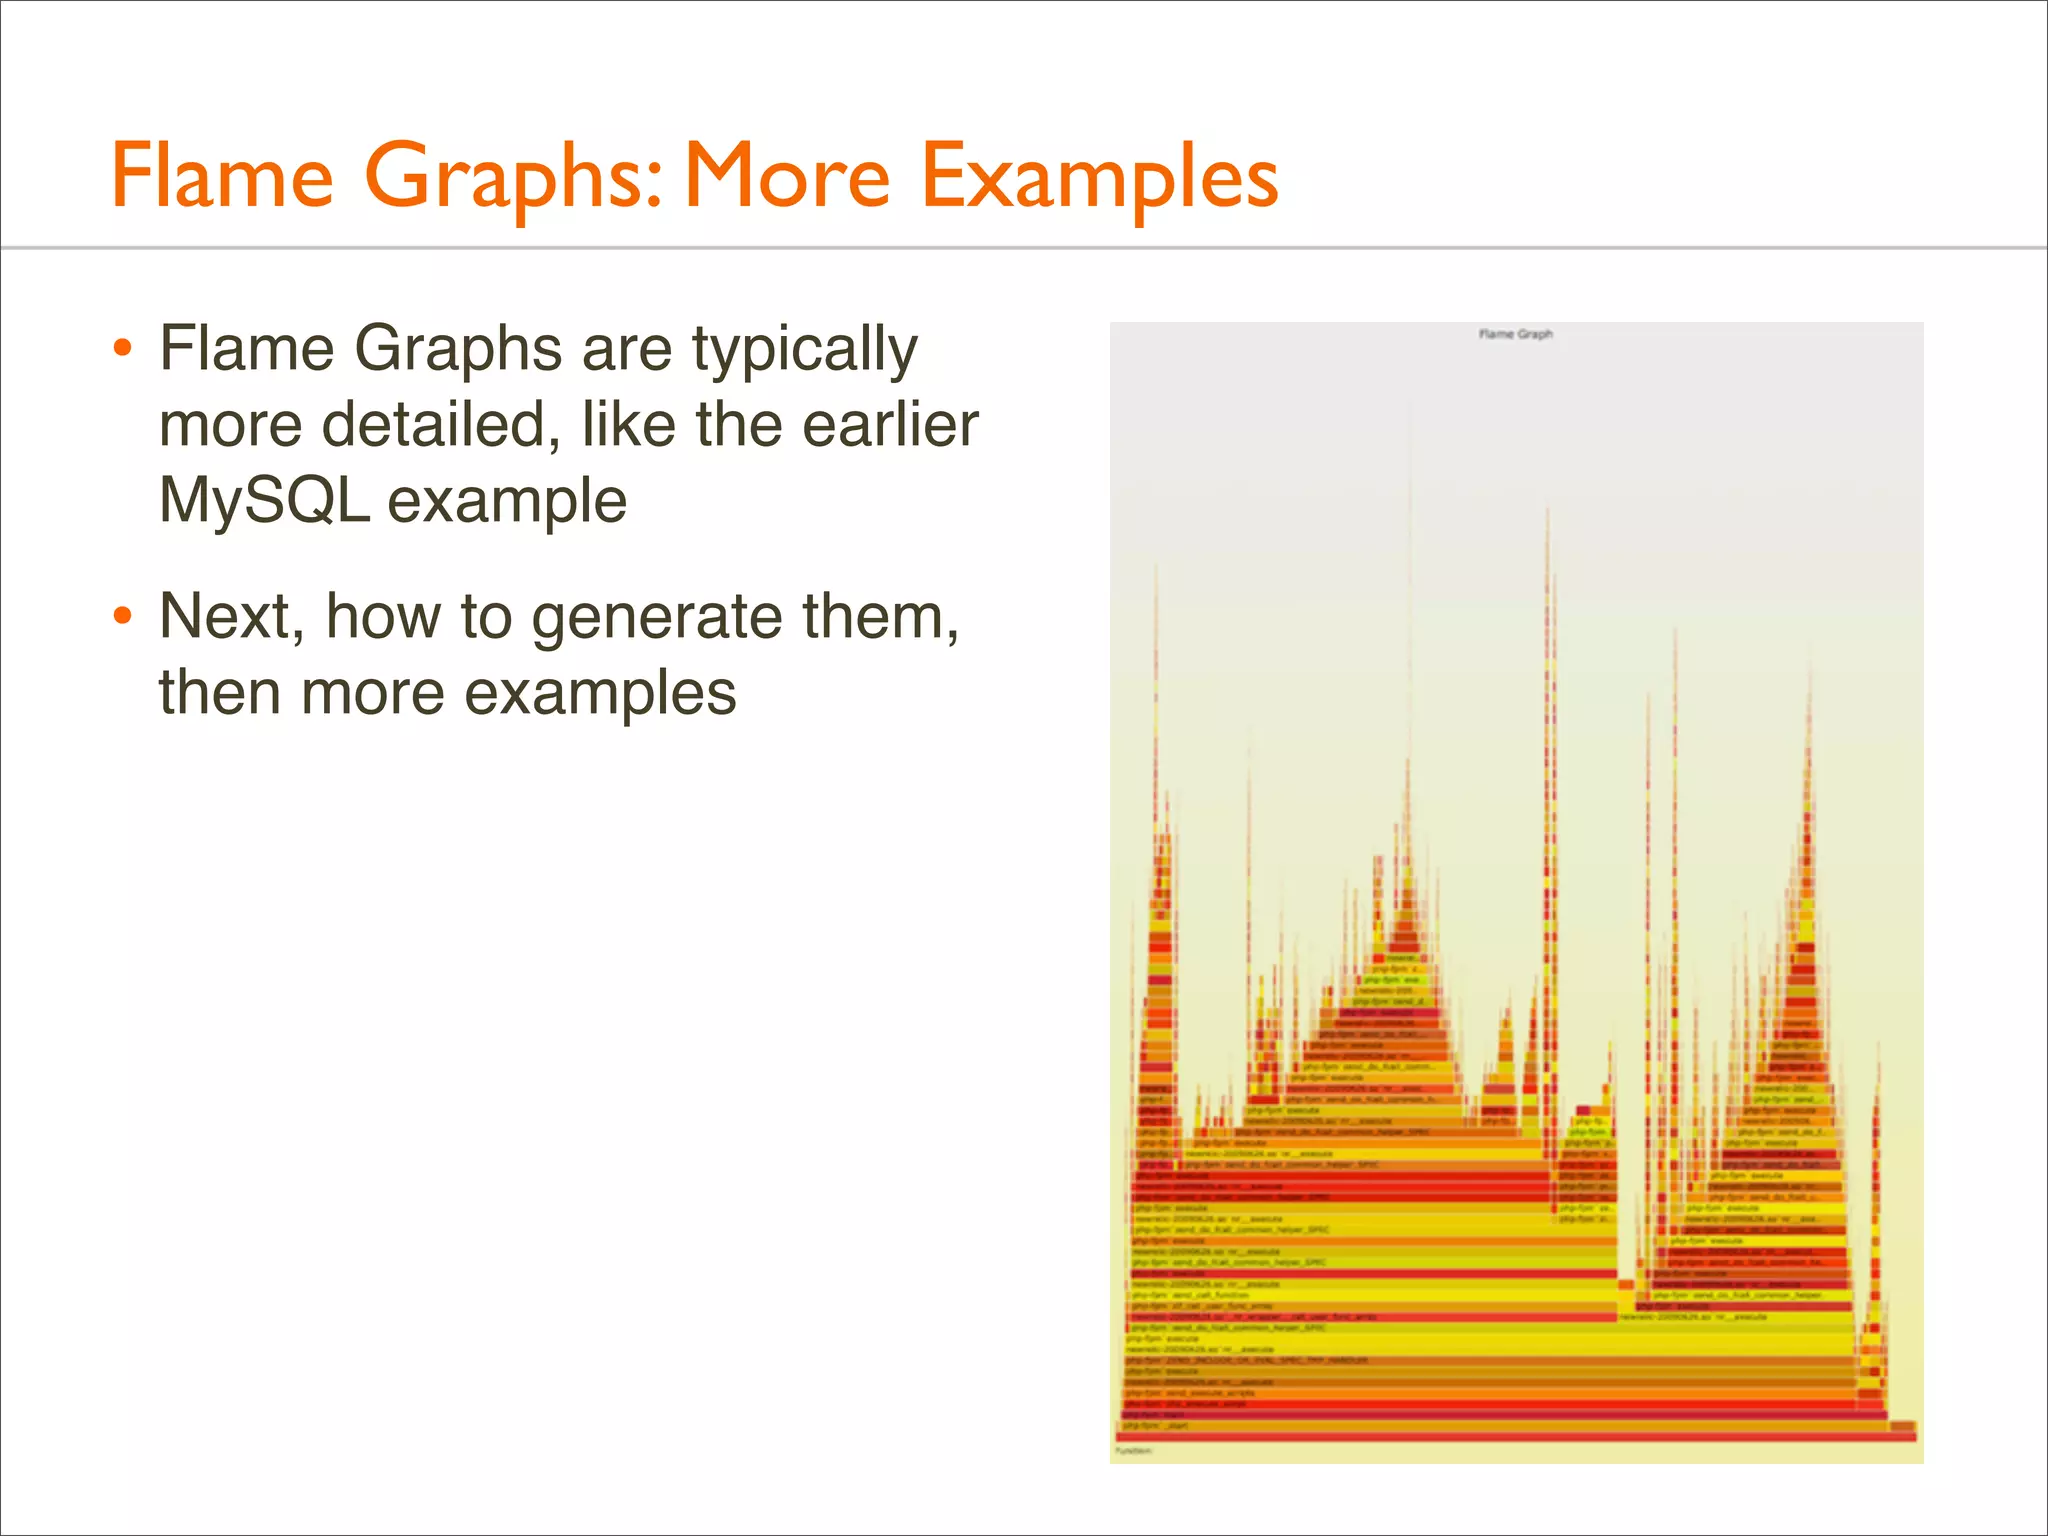
![Flame Graphs:Variations
• Profile data can be anything: CPU, I/O, memory, ...
• Naming suggestion: [event] [units] Flame Graph
• Eg: "FS Latency Flame Graph"
• By default, Flame Graphs == CPU Sample Flame Graphs
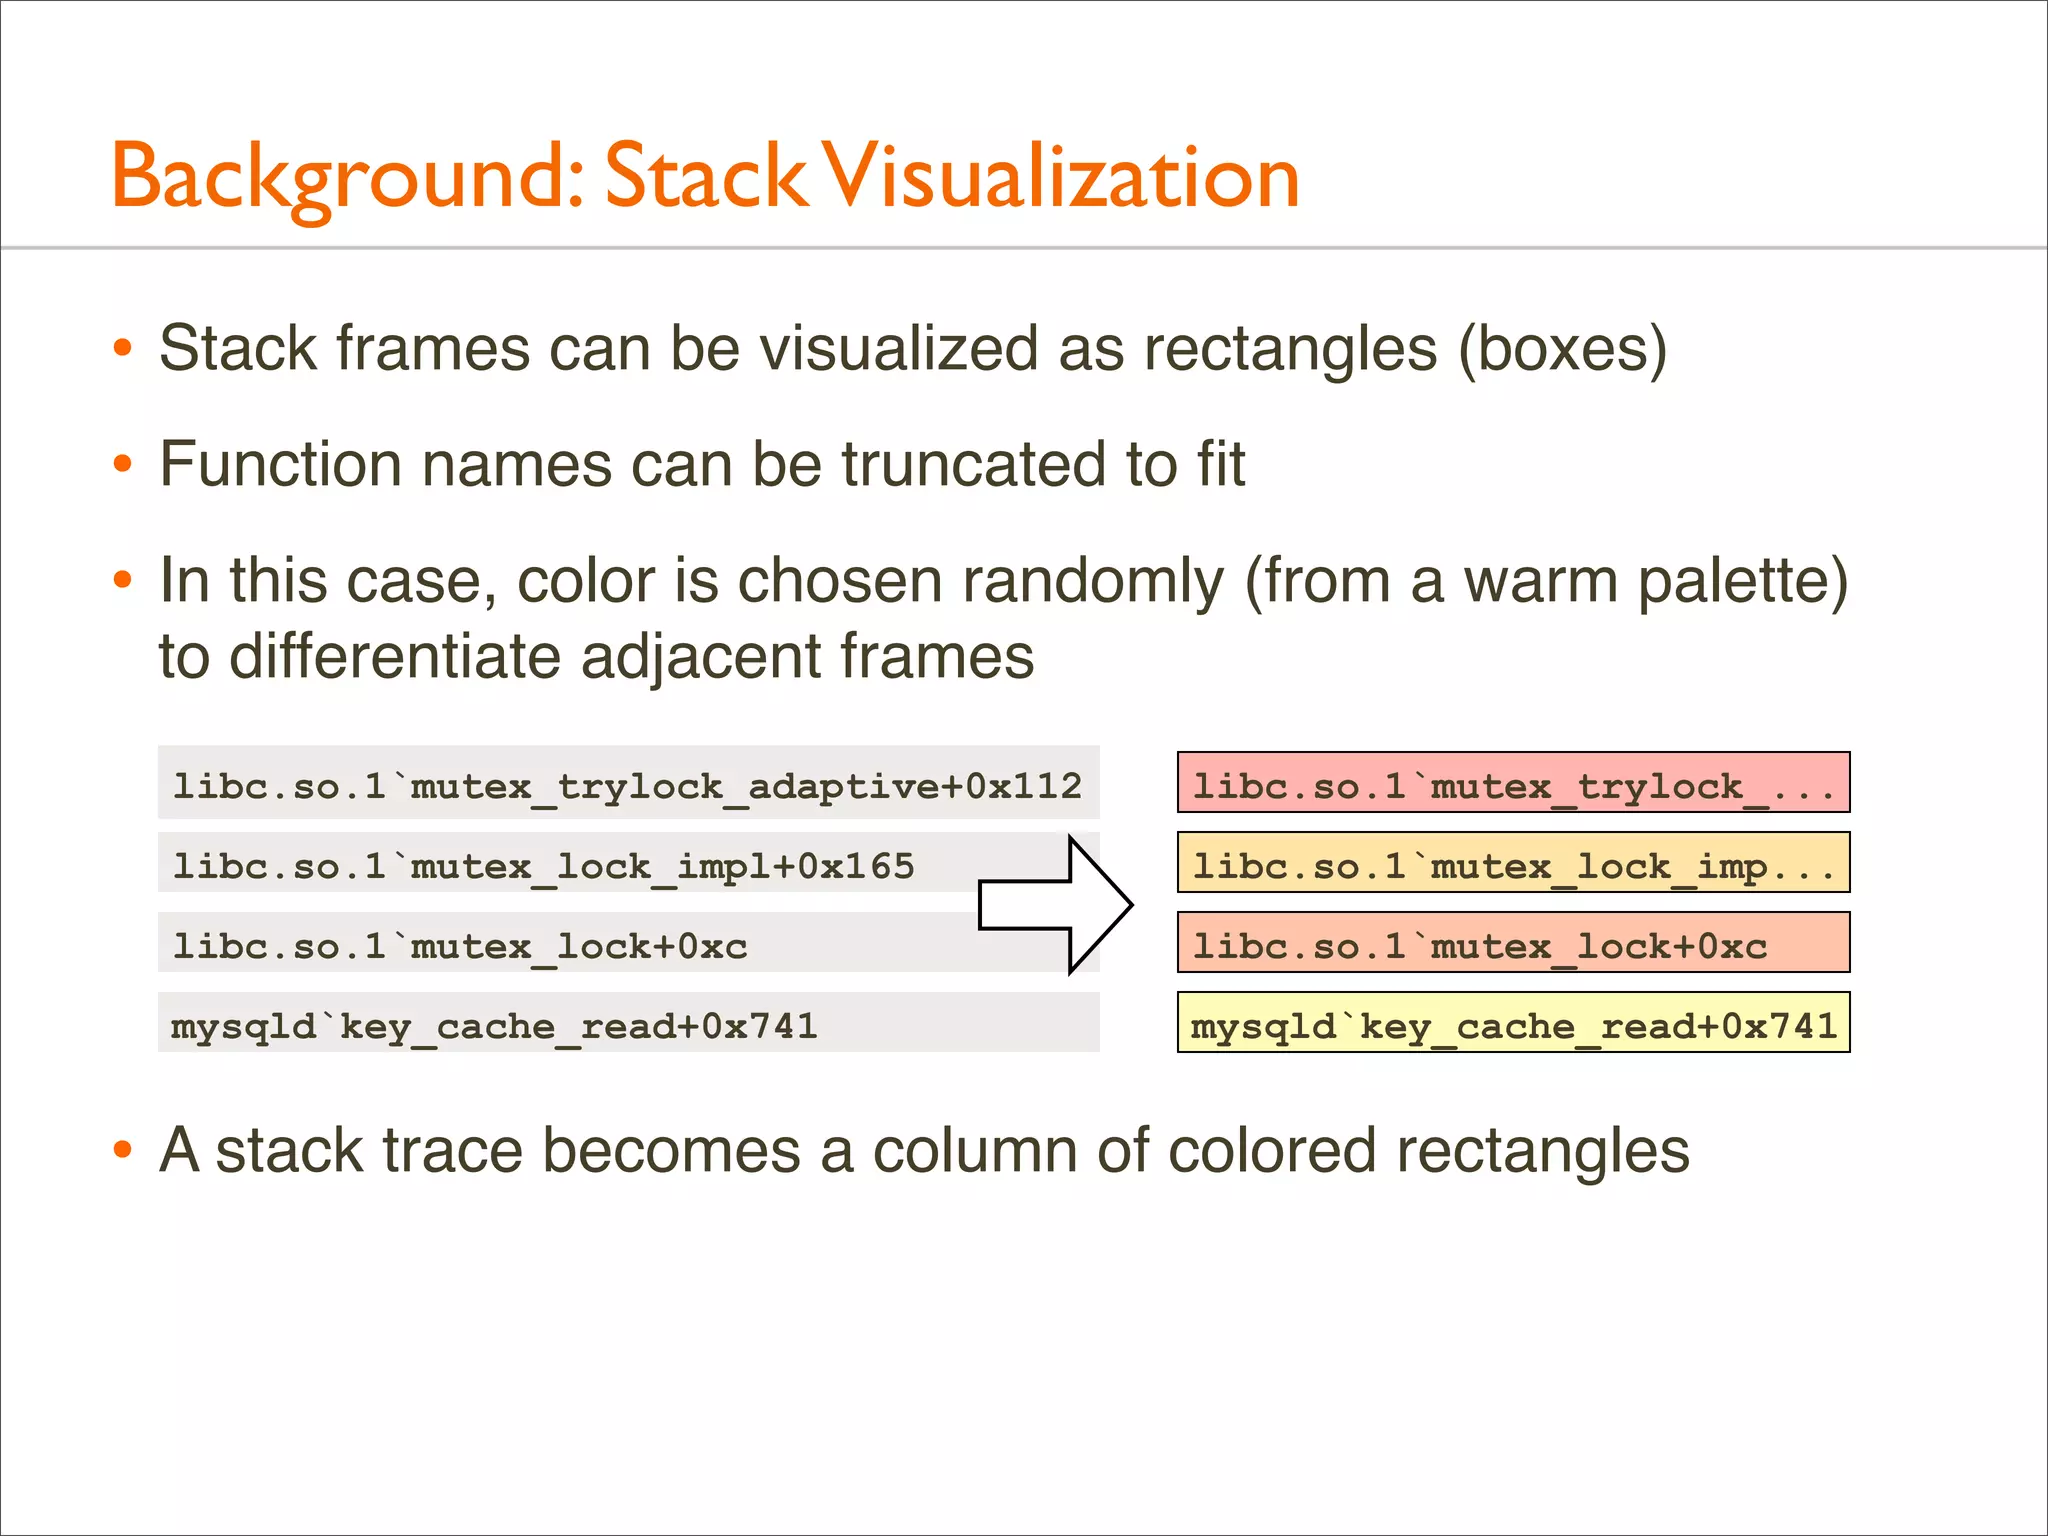
• Colors can be used for another dimension
• by default, random colors are used to differentiate boxes
• --hash for hash-based on function name
• Distribution applications can be shown in the same Flame
Graph (merge samples from multiple systems)](https://image.slidesharecdn.com/lisa13flamegraphs-131107112122-phpapp01/75/Blazing-Performance-with-Flame-Graphs-37-2048.jpg)

![Generation: Overview
• Full command line example. This uses DTrace for CPU
profiling of the kernel:
# dtrace -x stackframes=100 -n 'profile-997 /arg0/ {
@[stack()] = count(); } tick-60s { exit(0); }' -o out.stacks
# stackcollapse.pl < out.stacks > out.folded
# flamegraph.pl < out.folded > out.svg
• Then, open out.svg in a browser
• Intermediate files could be avoided (piping), but they can be
handy for some manual processing if needed (eg, using vi)](https://image.slidesharecdn.com/lisa13flamegraphs-131107112122-phpapp01/75/Blazing-Performance-with-Flame-Graphs-64-2048.jpg)
![Generation: Profiling Examples: DTrace
• CPU profile kernel stacks at 997 Hertz, for 60 secs:
# dtrace -x stackframes=100 -n 'profile-997 /arg0/ {
@[stack()] = count(); } tick-60s { exit(0); }' -o out.kern_stacks
• CPU profile user-level stacks for PID 12345 at 99 Hertz, 60s:
# dtrace -x ustackframes=100 -n 'profile-97 /PID == 12345 && arg1/ {
@[ustack()] = count(); } tick-60s { exit(0); }' -o out.user_stacks
• Should also work on Mac OS X, but is pending some fixes
preventing stack walking (use Instruments instead)
• Should work for Linux one day with the DTrace ports](https://image.slidesharecdn.com/lisa13flamegraphs-131107112122-phpapp01/75/Blazing-Performance-with-Flame-Graphs-67-2048.jpg)
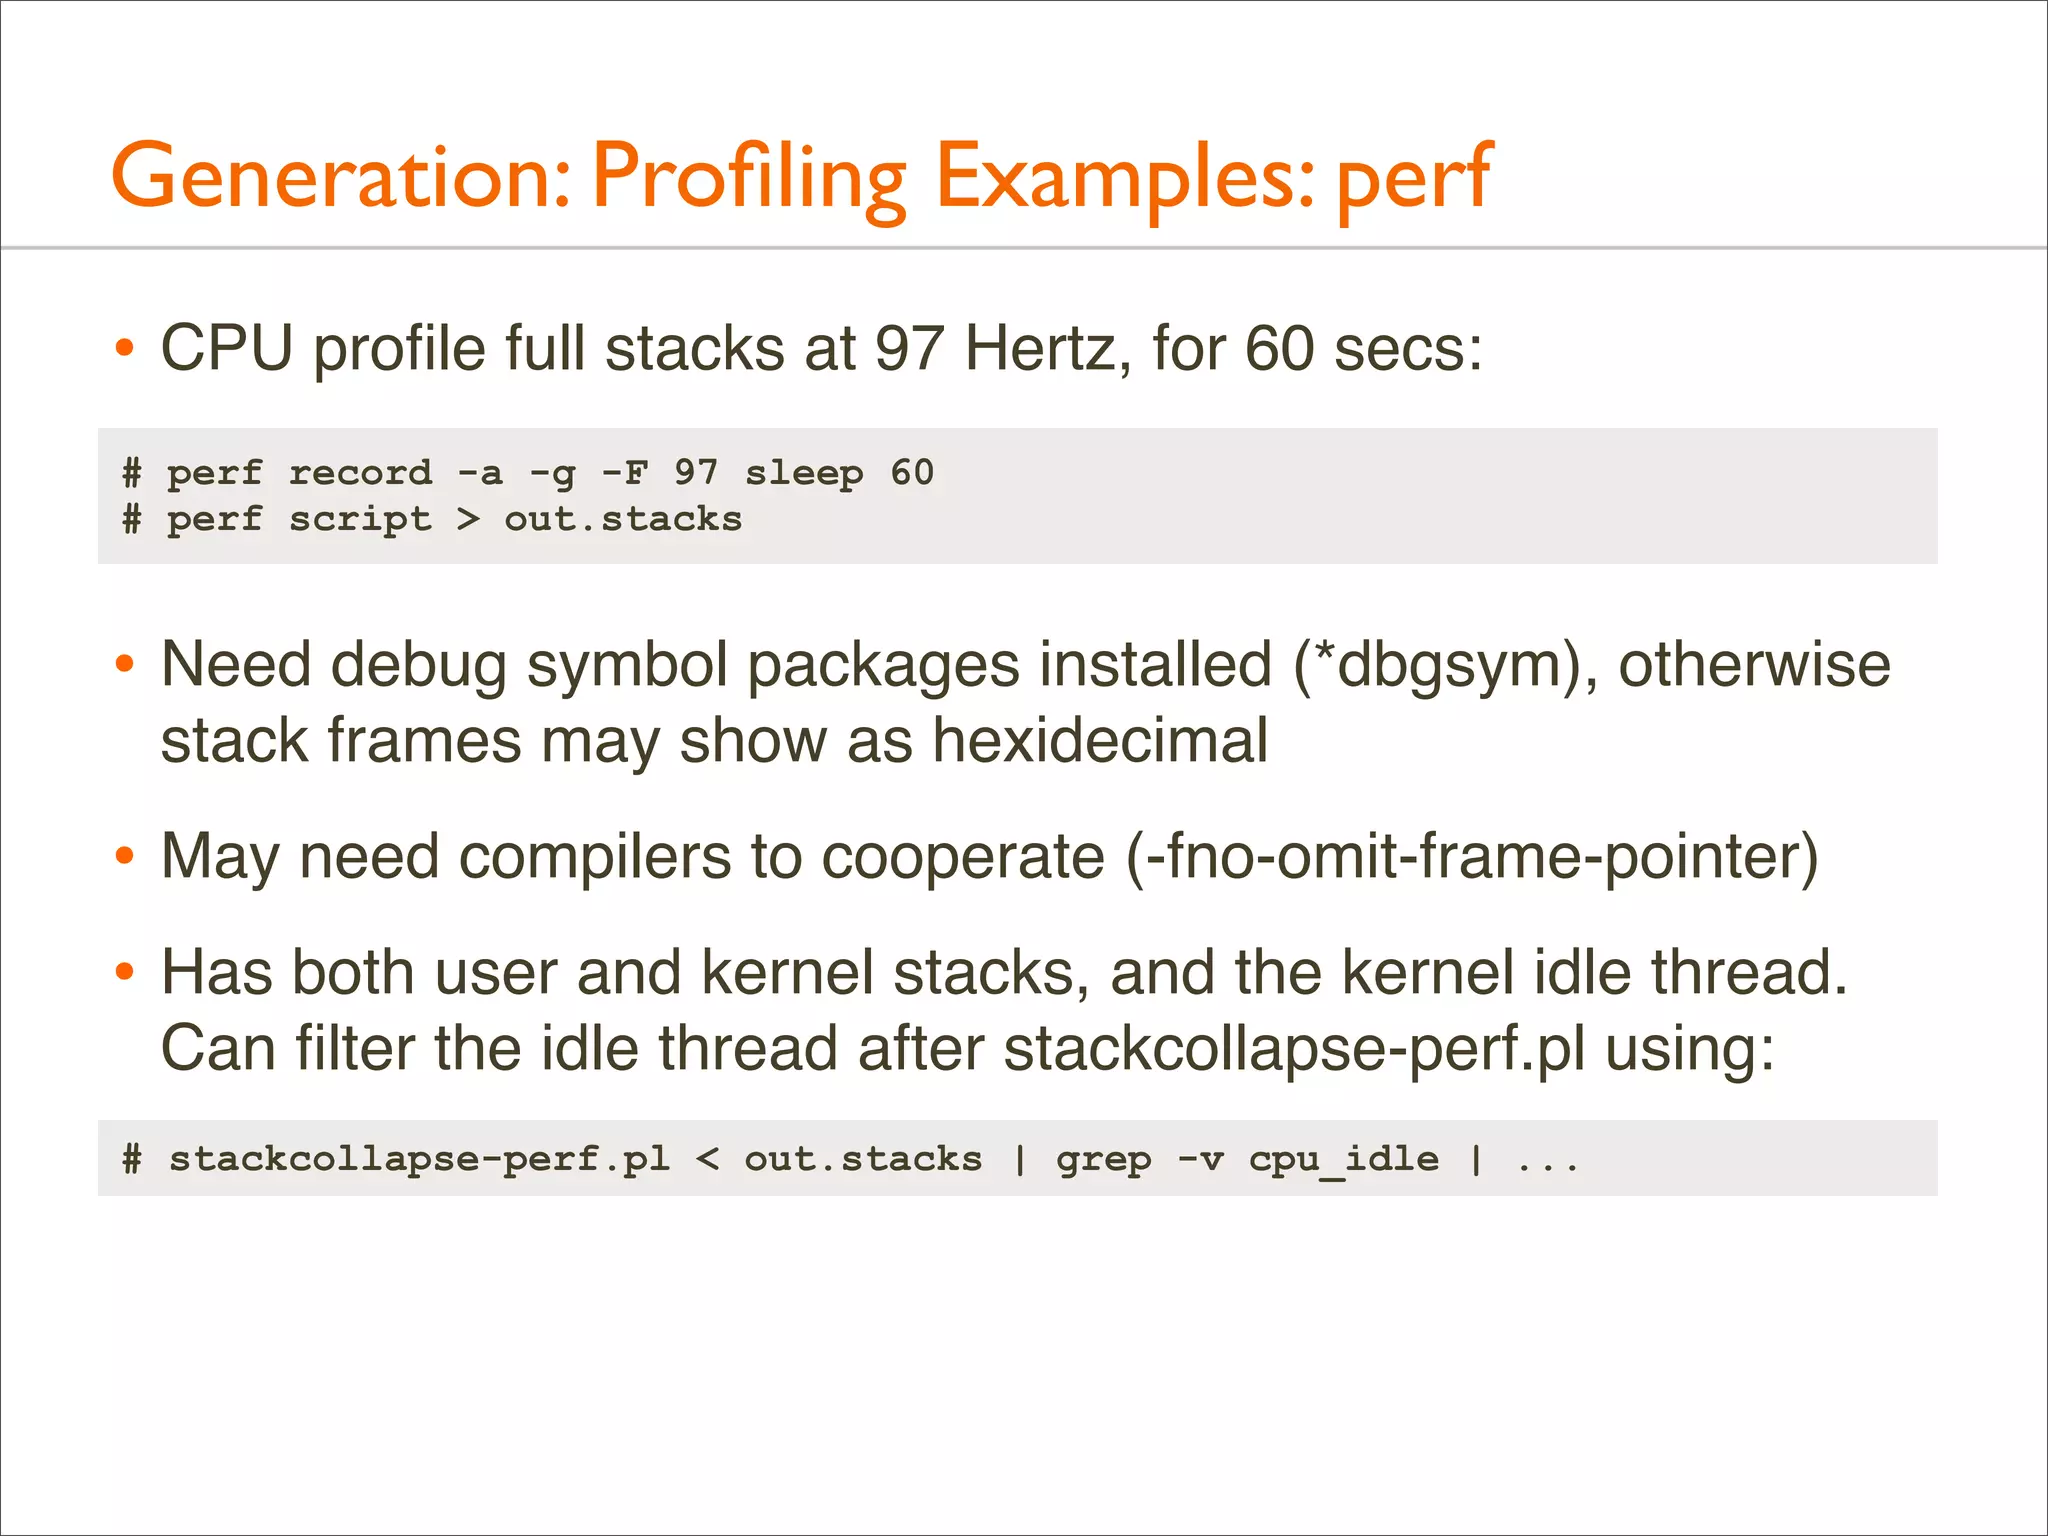
![Generation: Profiling Examples: SystemTap
• CPU profile kernel stacks at 100 Hertz, for 60 secs:
# stap -s 32 -D MAXTRACE=100 -D MAXSTRINGLEN=4096 -D MAXMAPENTRIES=10240
-D MAXACTION=10000 -D STP_OVERLOAD_THRESHOLD=5000000000 --all-modules
-ve 'global s; probe timer.profile { s[backtrace()] <<< 1; }
probe end { foreach (i in s+) { print_stack(i);
printf("t%dn", @count(s[i])); } } probe timer.s(60) { exit(); }'
> out.kern_stacks
• Need debug symbol packages installed (*dbgsym), otherwise
stack frames may show as hexidecimal
• May need compilers to cooperate (-fno-omit-frame-pointer)](https://image.slidesharecdn.com/lisa13flamegraphs-131107112122-phpapp01/75/Blazing-Performance-with-Flame-Graphs-69-2048.jpg)
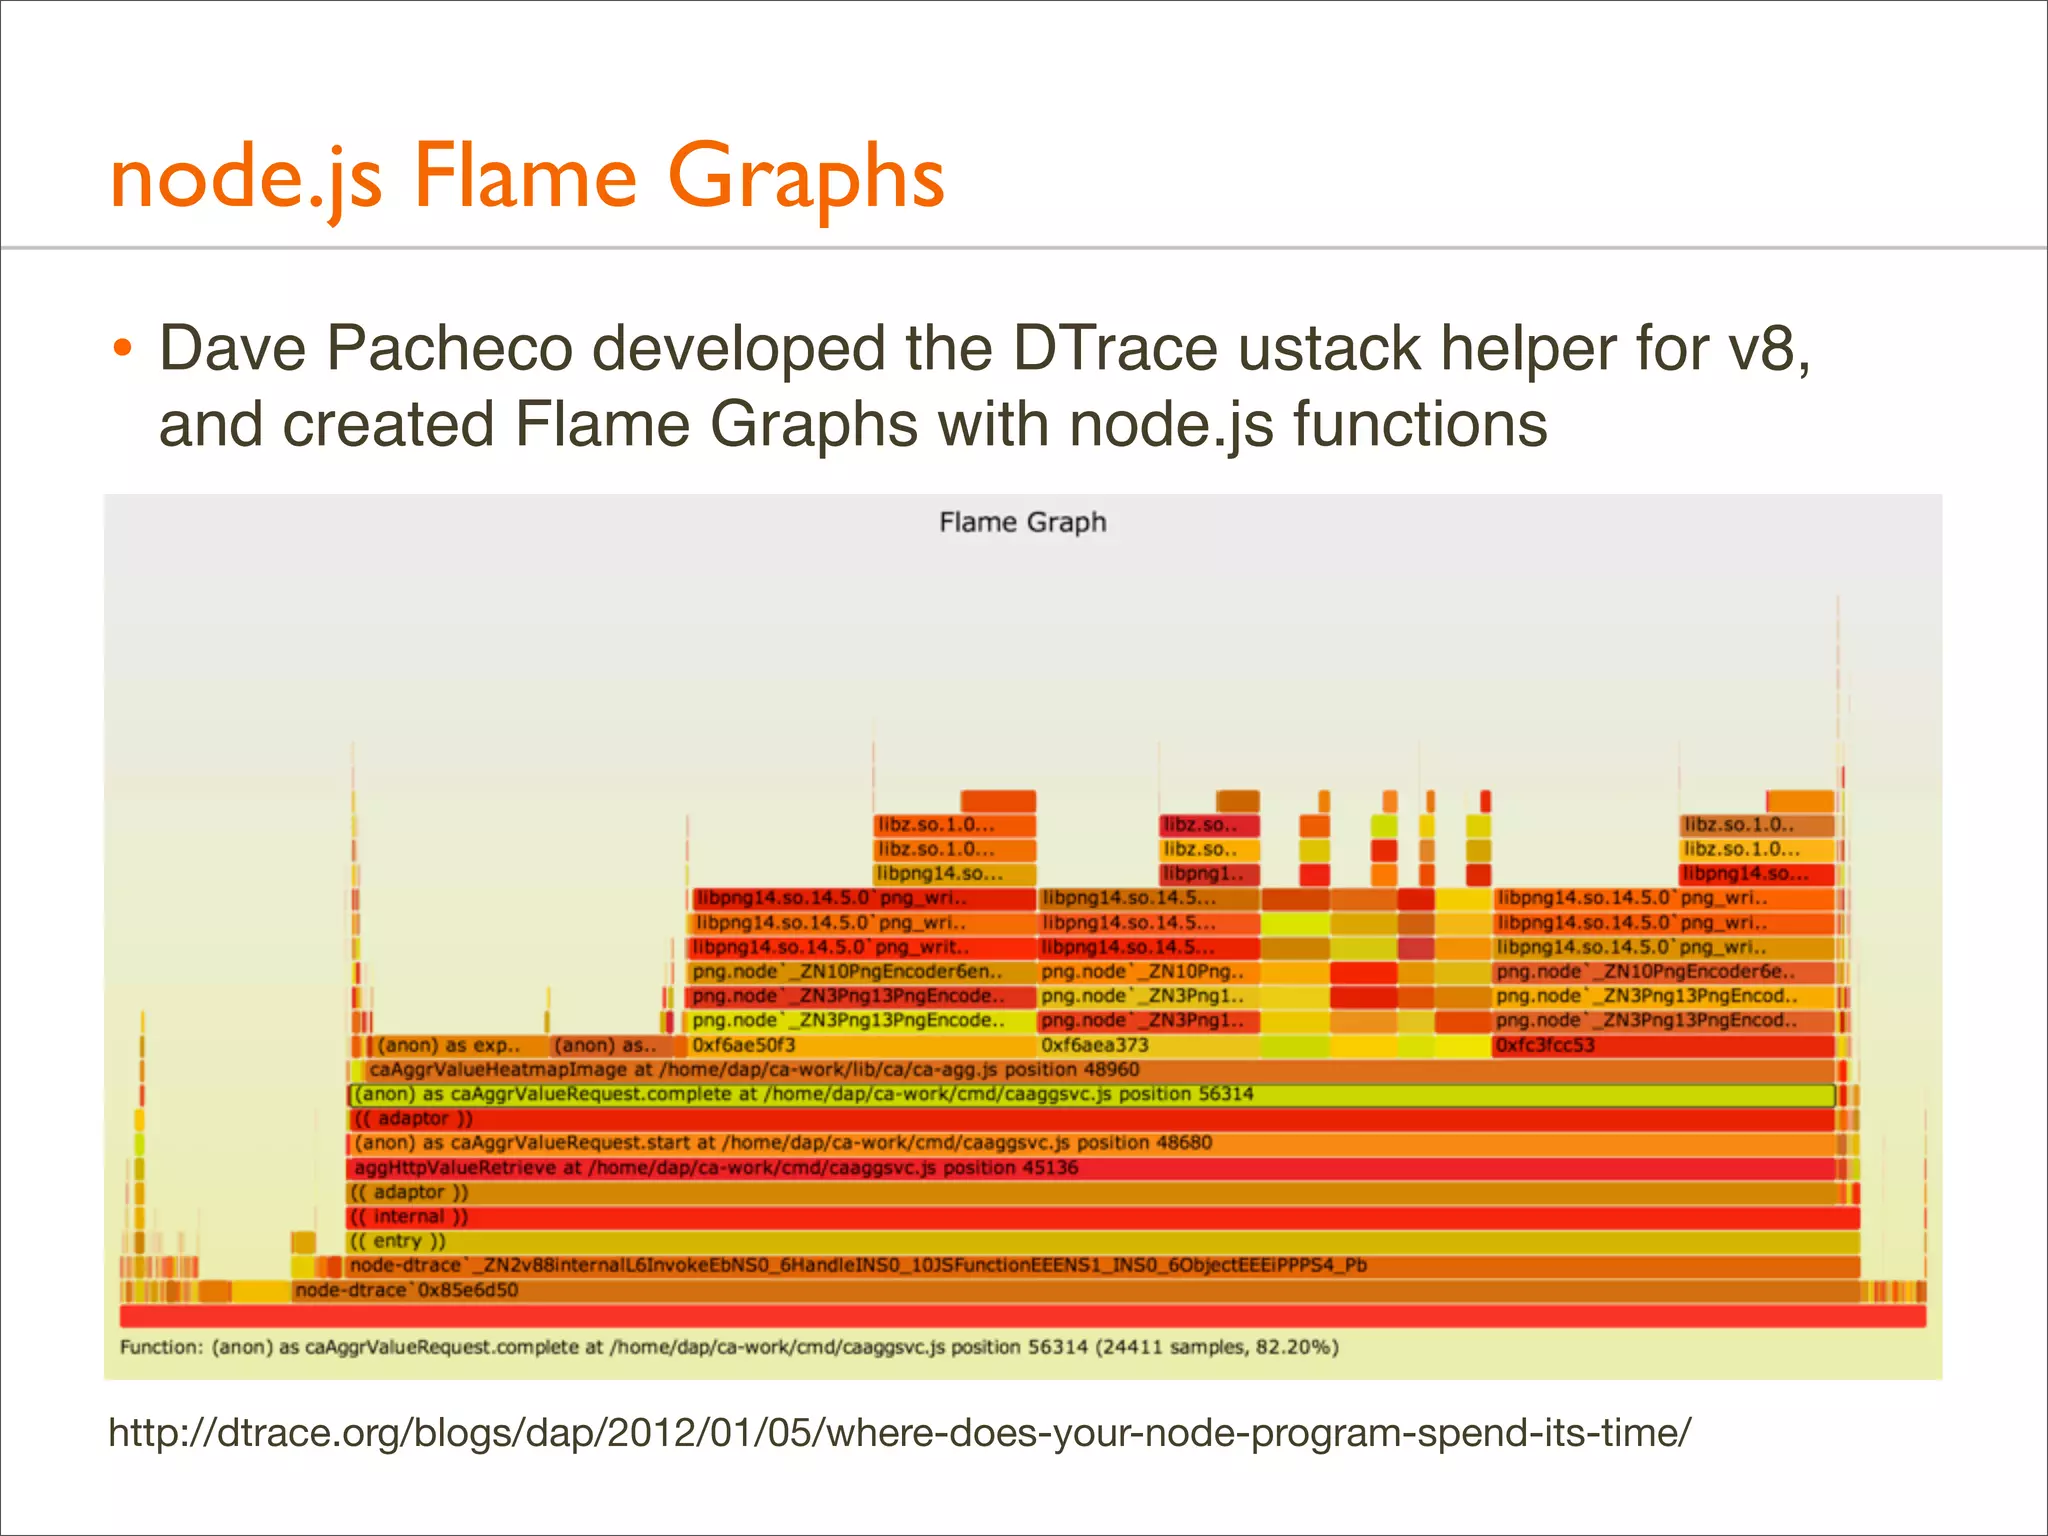
![Generation: Dynamic Languages
• C or C++ are usually easy to profile, runtime environments
(JVM, node.js, ...) are usually not, typically a way to show
program stacks and not just runtime internals.
• Eg, DTrace’s ustack helper for node.js:
0xfc618bc0
0xfc61bd62
0xfe870841
0xfc61c1f3
0xfc617685
0xfe870841
0xfc6154d7
0xfe870e1a
[...]
libc.so.1`gettimeofday+0x7
Date at position
<< adaptor >>
<< constructor >>
(anon) as exports.active at timers.js position 7590
(anon) as Socket._write at net.js position 21336
(anon) as Socket.write at net.js position 19714
<< adaptor >>
(anon) as OutgoingMessage._writeRaw at http.js p...
(anon) as OutgoingMessage._send at http.js posit...
<< adaptor >>
(anon) as OutgoingMessage.end at http.js pos...
[...]
http://dtrace.org/blogs/dap/2012/01/05/where-does-your-node-program-spend-its-time/](https://image.slidesharecdn.com/lisa13flamegraphs-131107112122-phpapp01/75/Blazing-Performance-with-Flame-Graphs-70-2048.jpg)
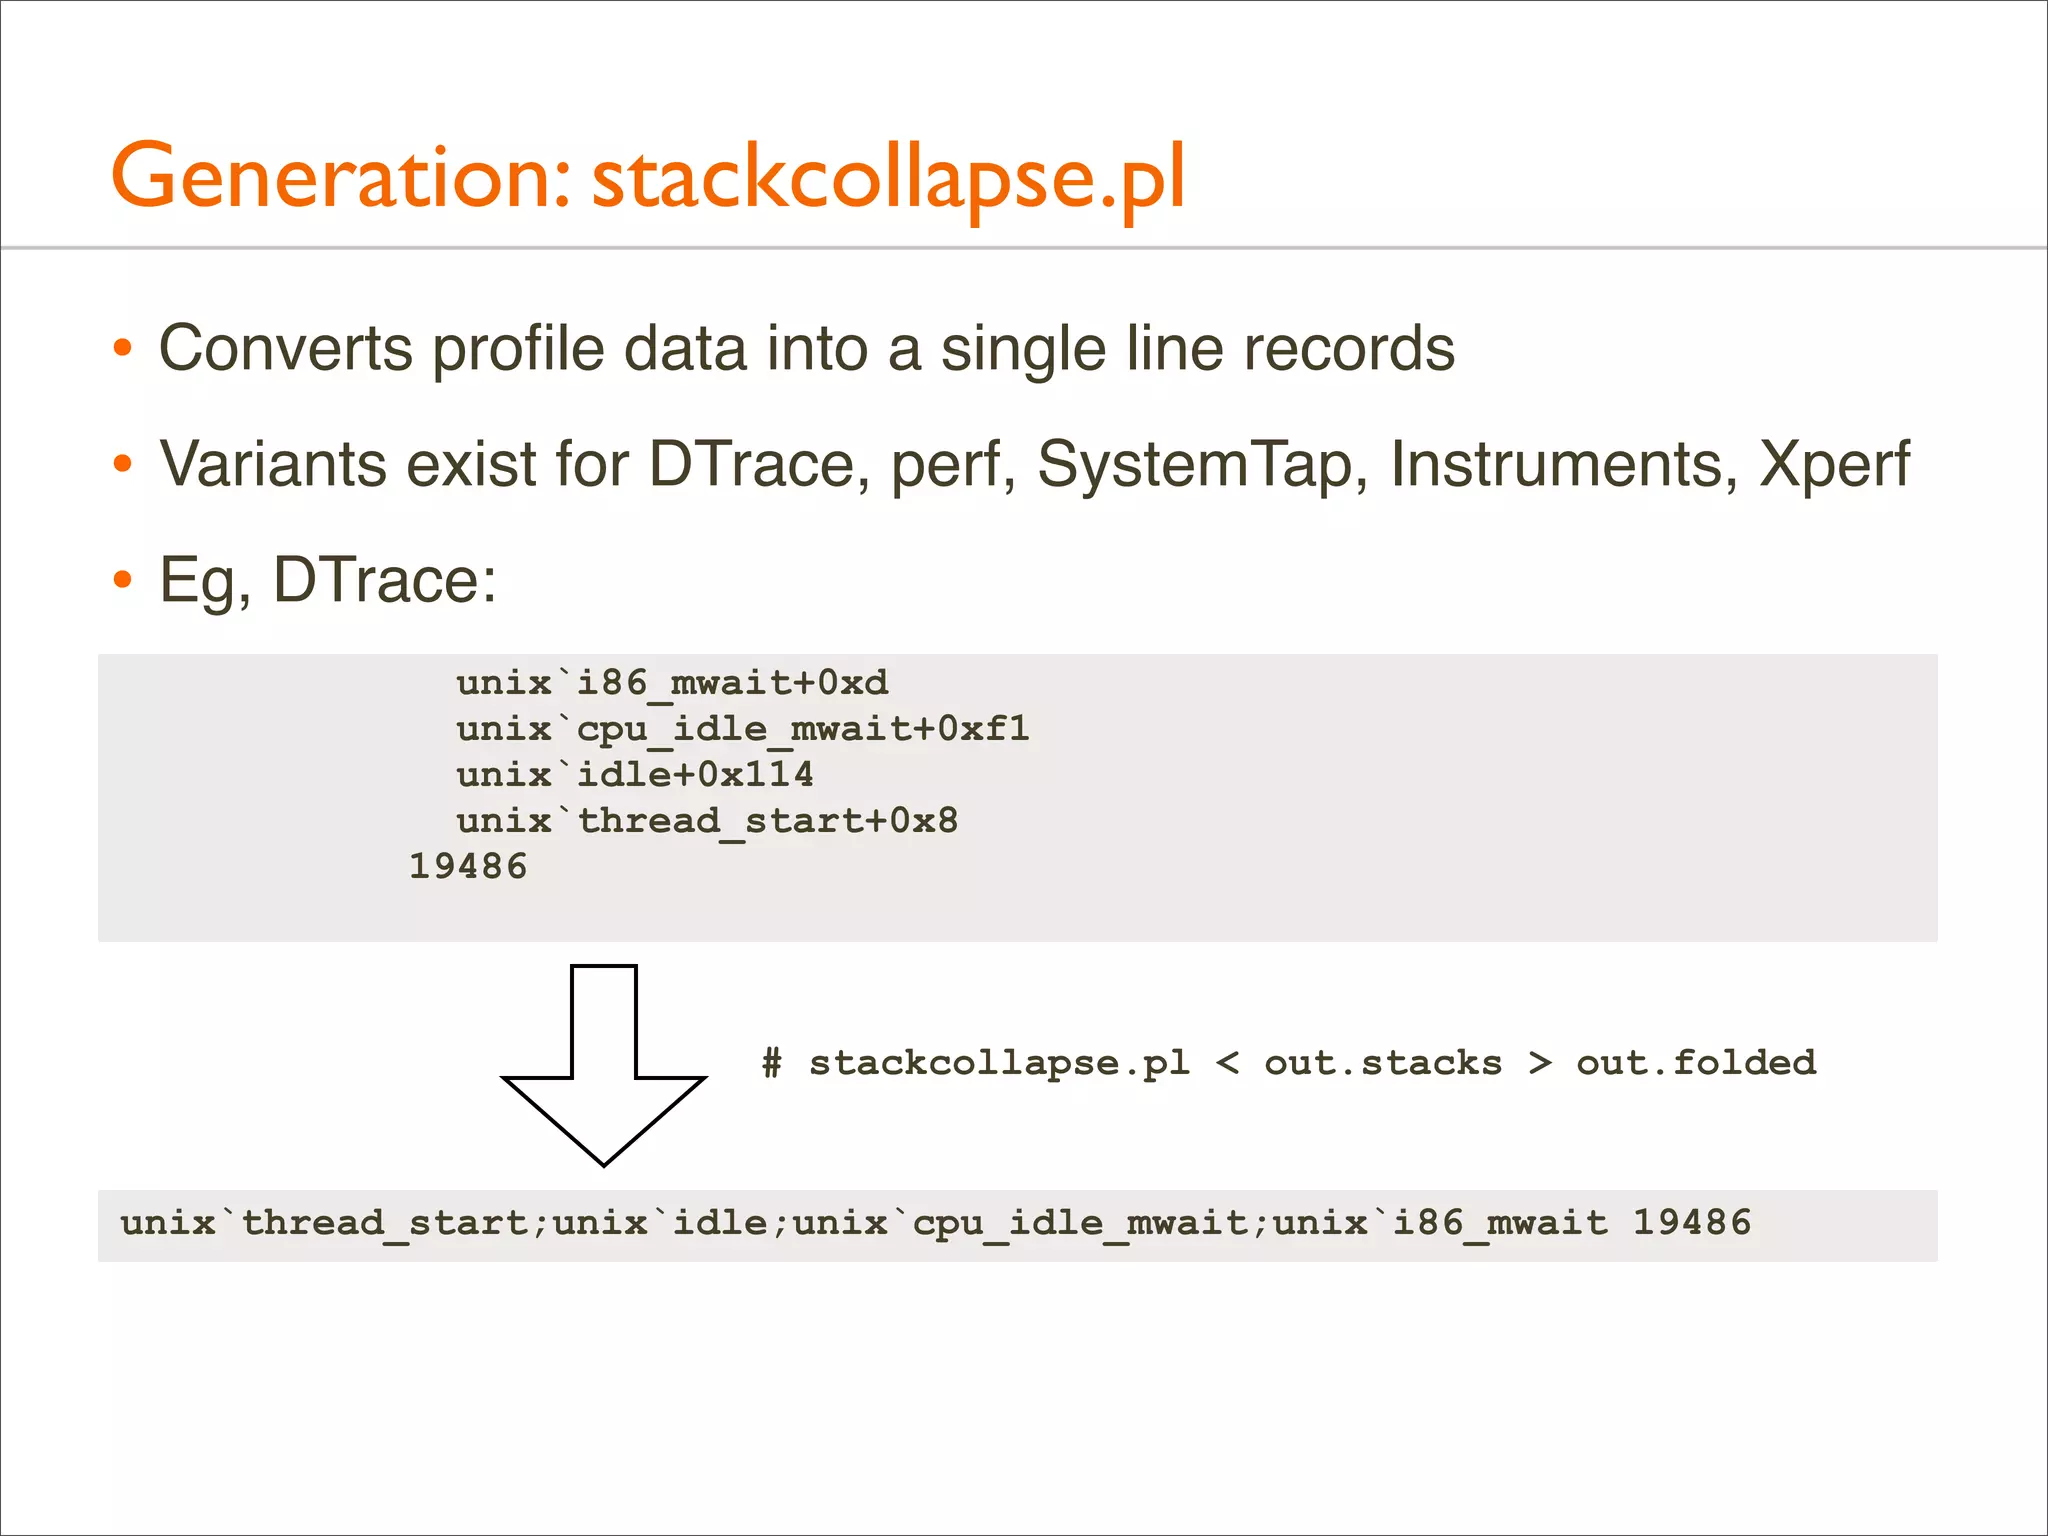
![Generation: stackcollapse.pl
• Full output is many lines, one line per stack
• Bonus: can be grepped
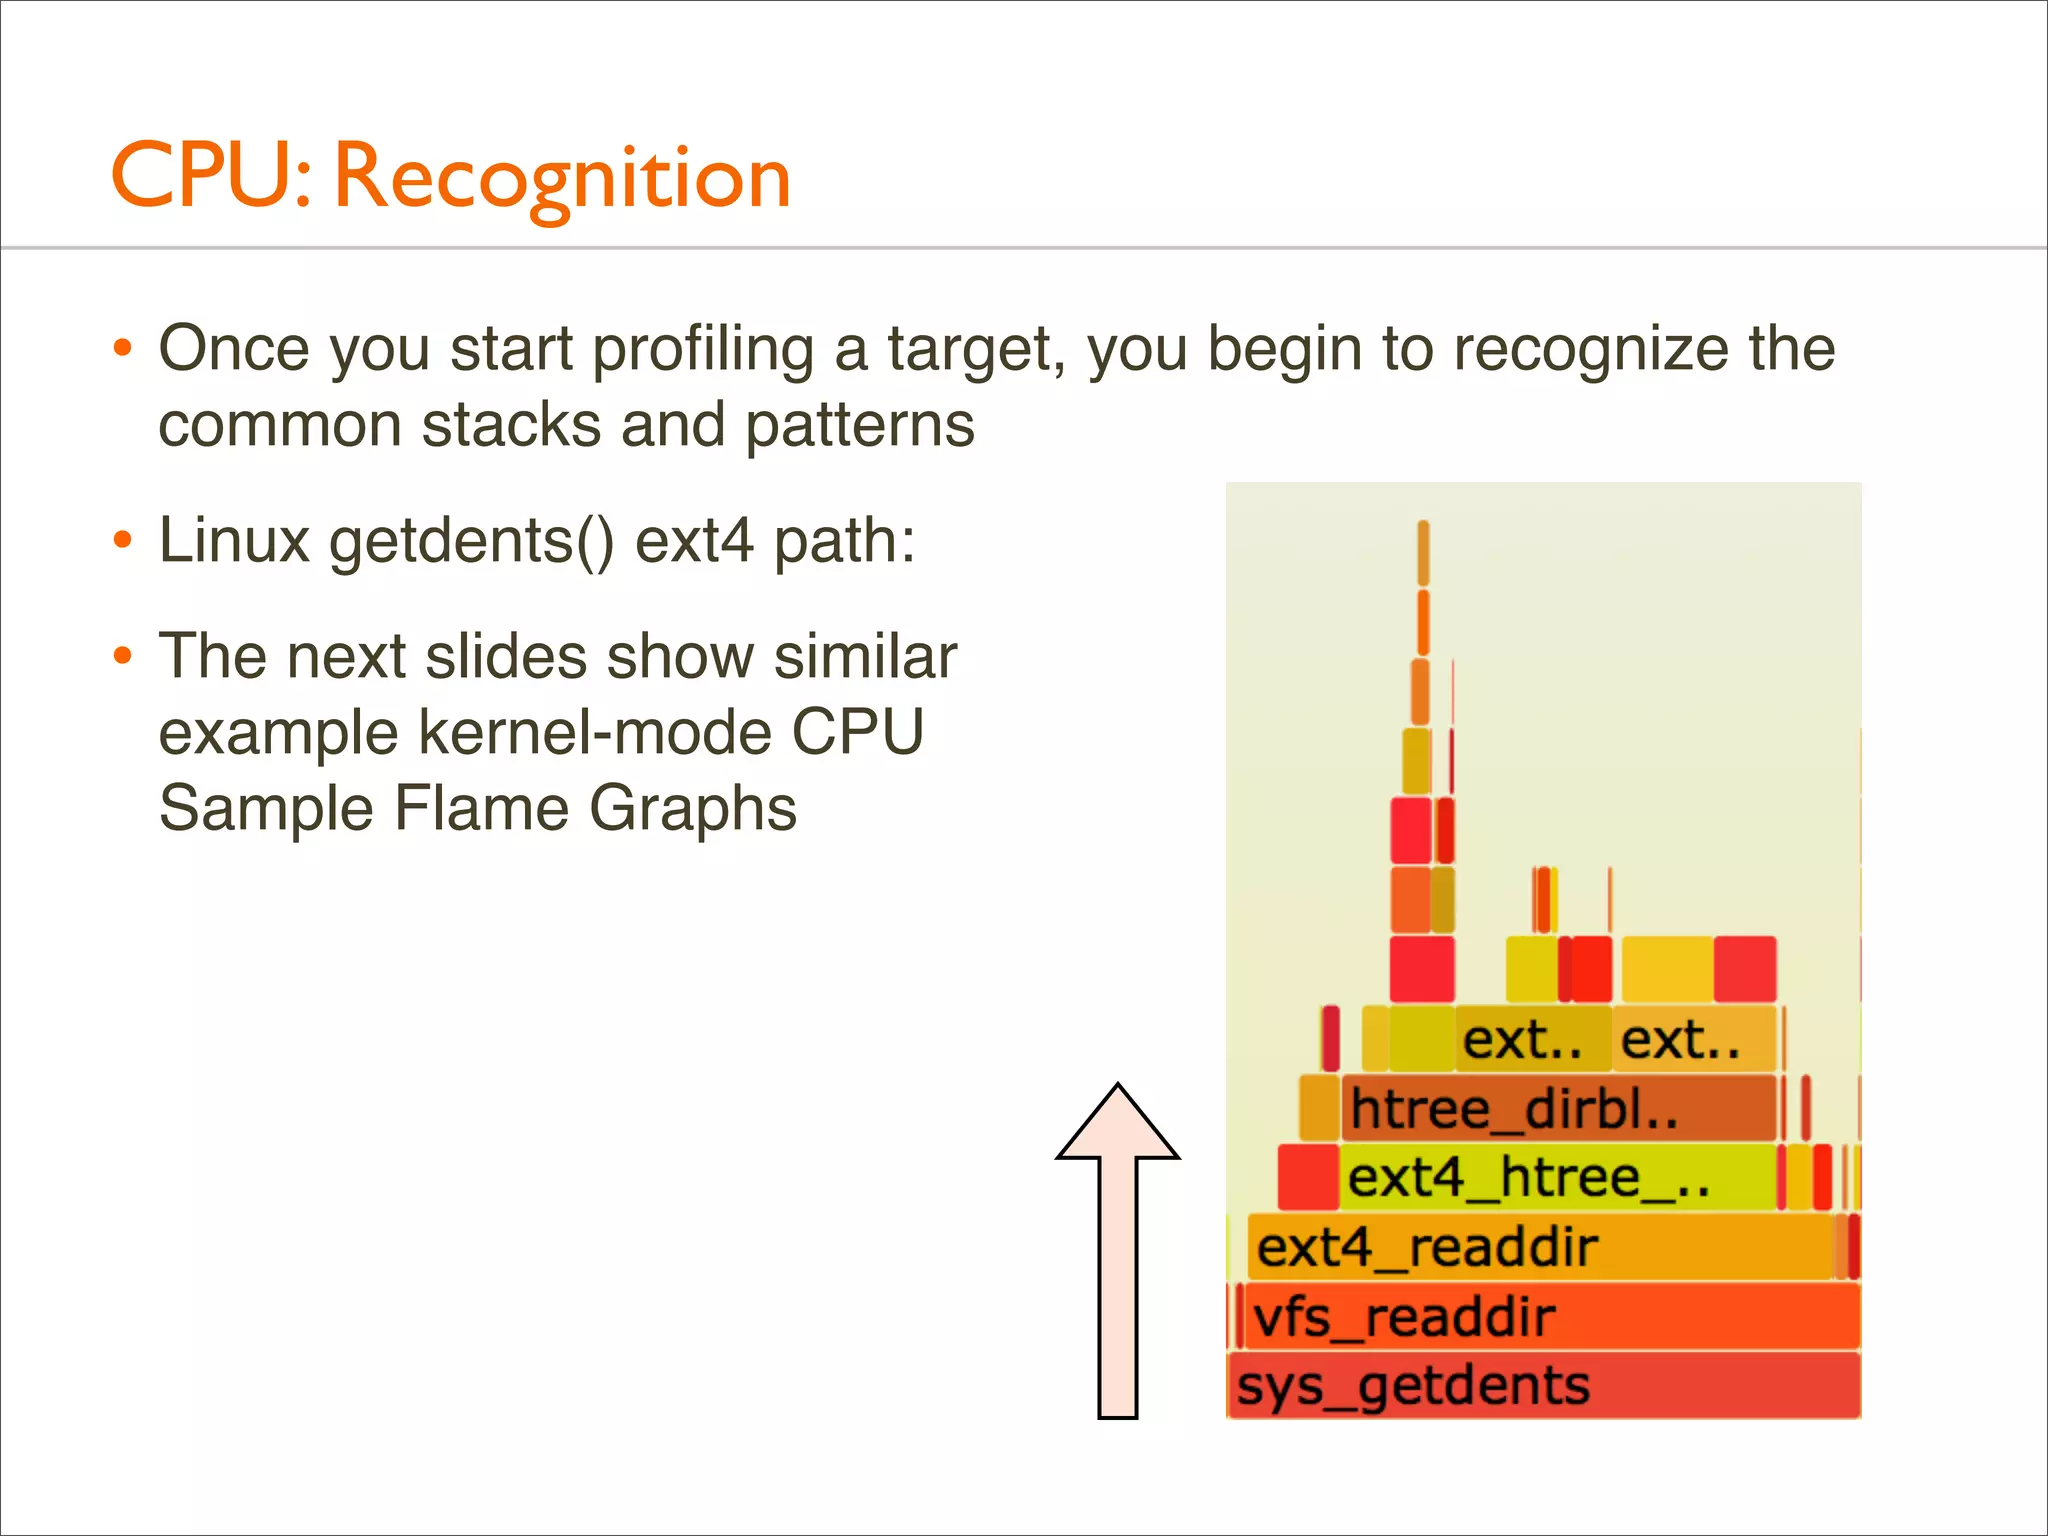
# ./stackcollapse-stap.pl out.stacks | grep ext4fs_dirhash
system_call_fastpath;sys_getdents;vfs_readdir;ext4_readdir;ext4_htree_fill_
tree;htree_dirblock_to_tree;ext4fs_dirhash 100
system_call_fastpath;sys_getdents;vfs_readdir;ext4_readdir;ext4_htree_fill_
tree;htree_dirblock_to_tree;ext4fs_dirhash;half_md4_transform 505
system_call_fastpath;sys_getdents;vfs_readdir;ext4_readdir;ext4_htree_fill_
tree;htree_dirblock_to_tree;ext4fs_dirhash;str2hashbuf_signed 353
[...]
• That shows all stacks containing ext4fs_dirhash(); useful
debug aid by itself
• grep can also be used to filter stacks before Flame Graphs
• eg: grep -v cpu_idle](https://image.slidesharecdn.com/lisa13flamegraphs-131107112122-phpapp01/75/Blazing-Performance-with-Flame-Graphs-73-2048.jpg)


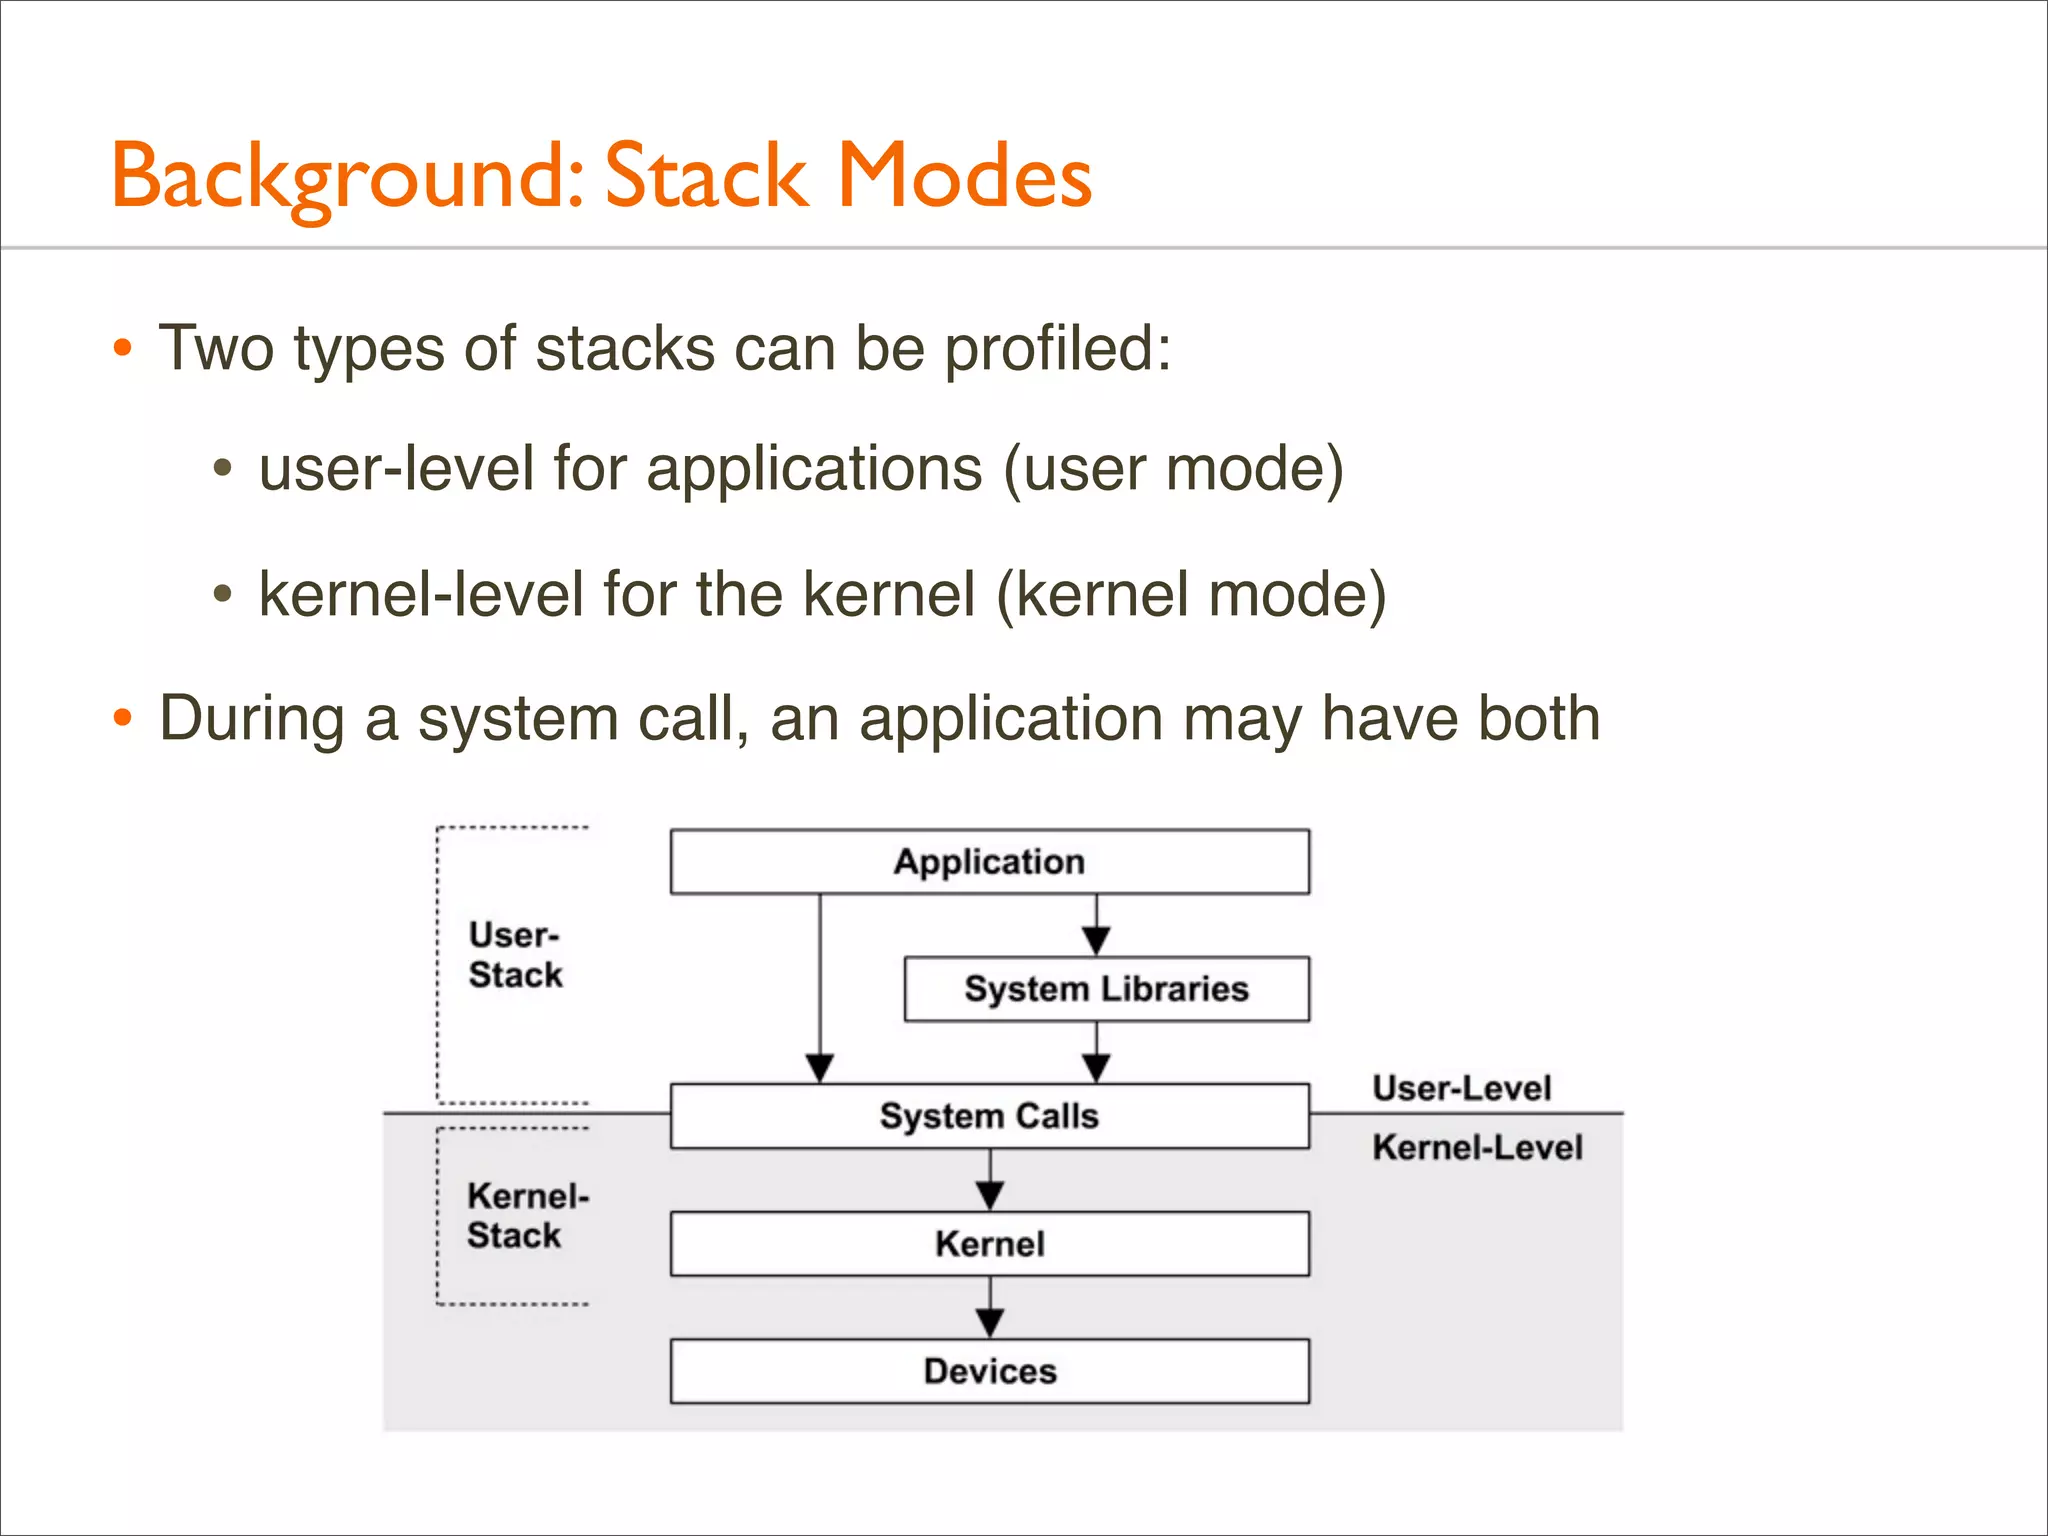
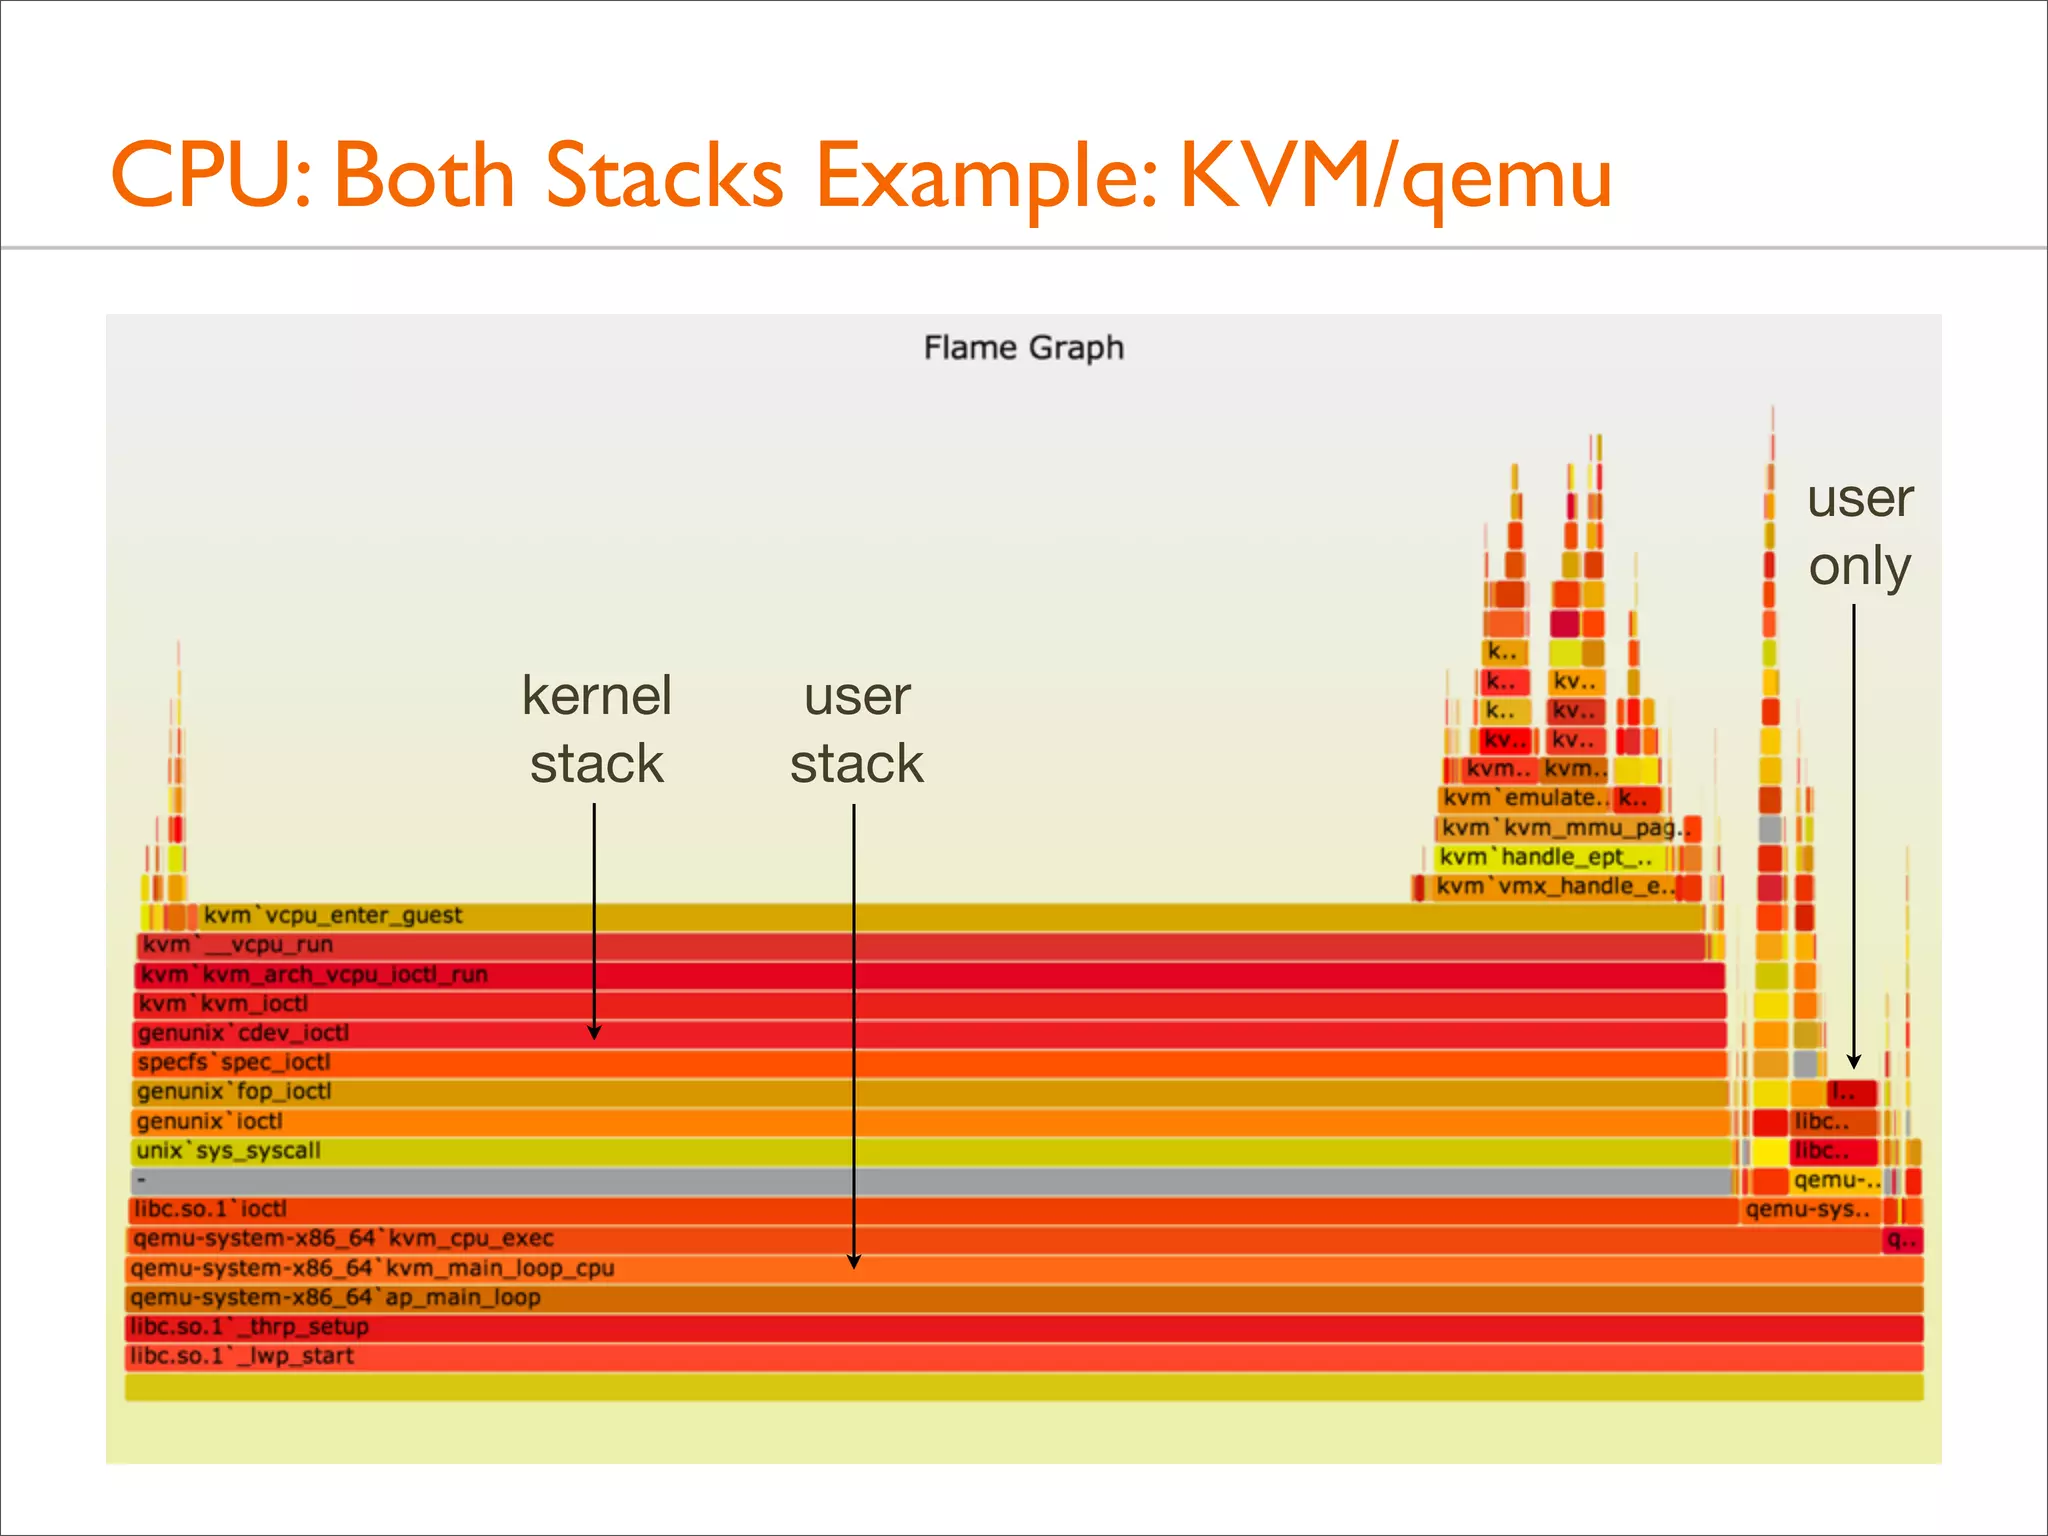
![CPU: Both Stacks
• Apart from showing either user- or kernel-level stacks, both
can be included by stacking kernel on top of user
• Linux perf does this by default
• DTrace can by aggregating @[stack(), ustack()]
• The different stacks can be highlighted in different ways:
• different colors or hues
• separator: flamegraph.pl will color gray any functions
called "-", which can be inserted as stack separators
• Kernel stacks are only present during syscalls or interrupts](https://image.slidesharecdn.com/lisa13flamegraphs-131107112122-phpapp01/75/Blazing-Performance-with-Flame-Graphs-97-2048.jpg)


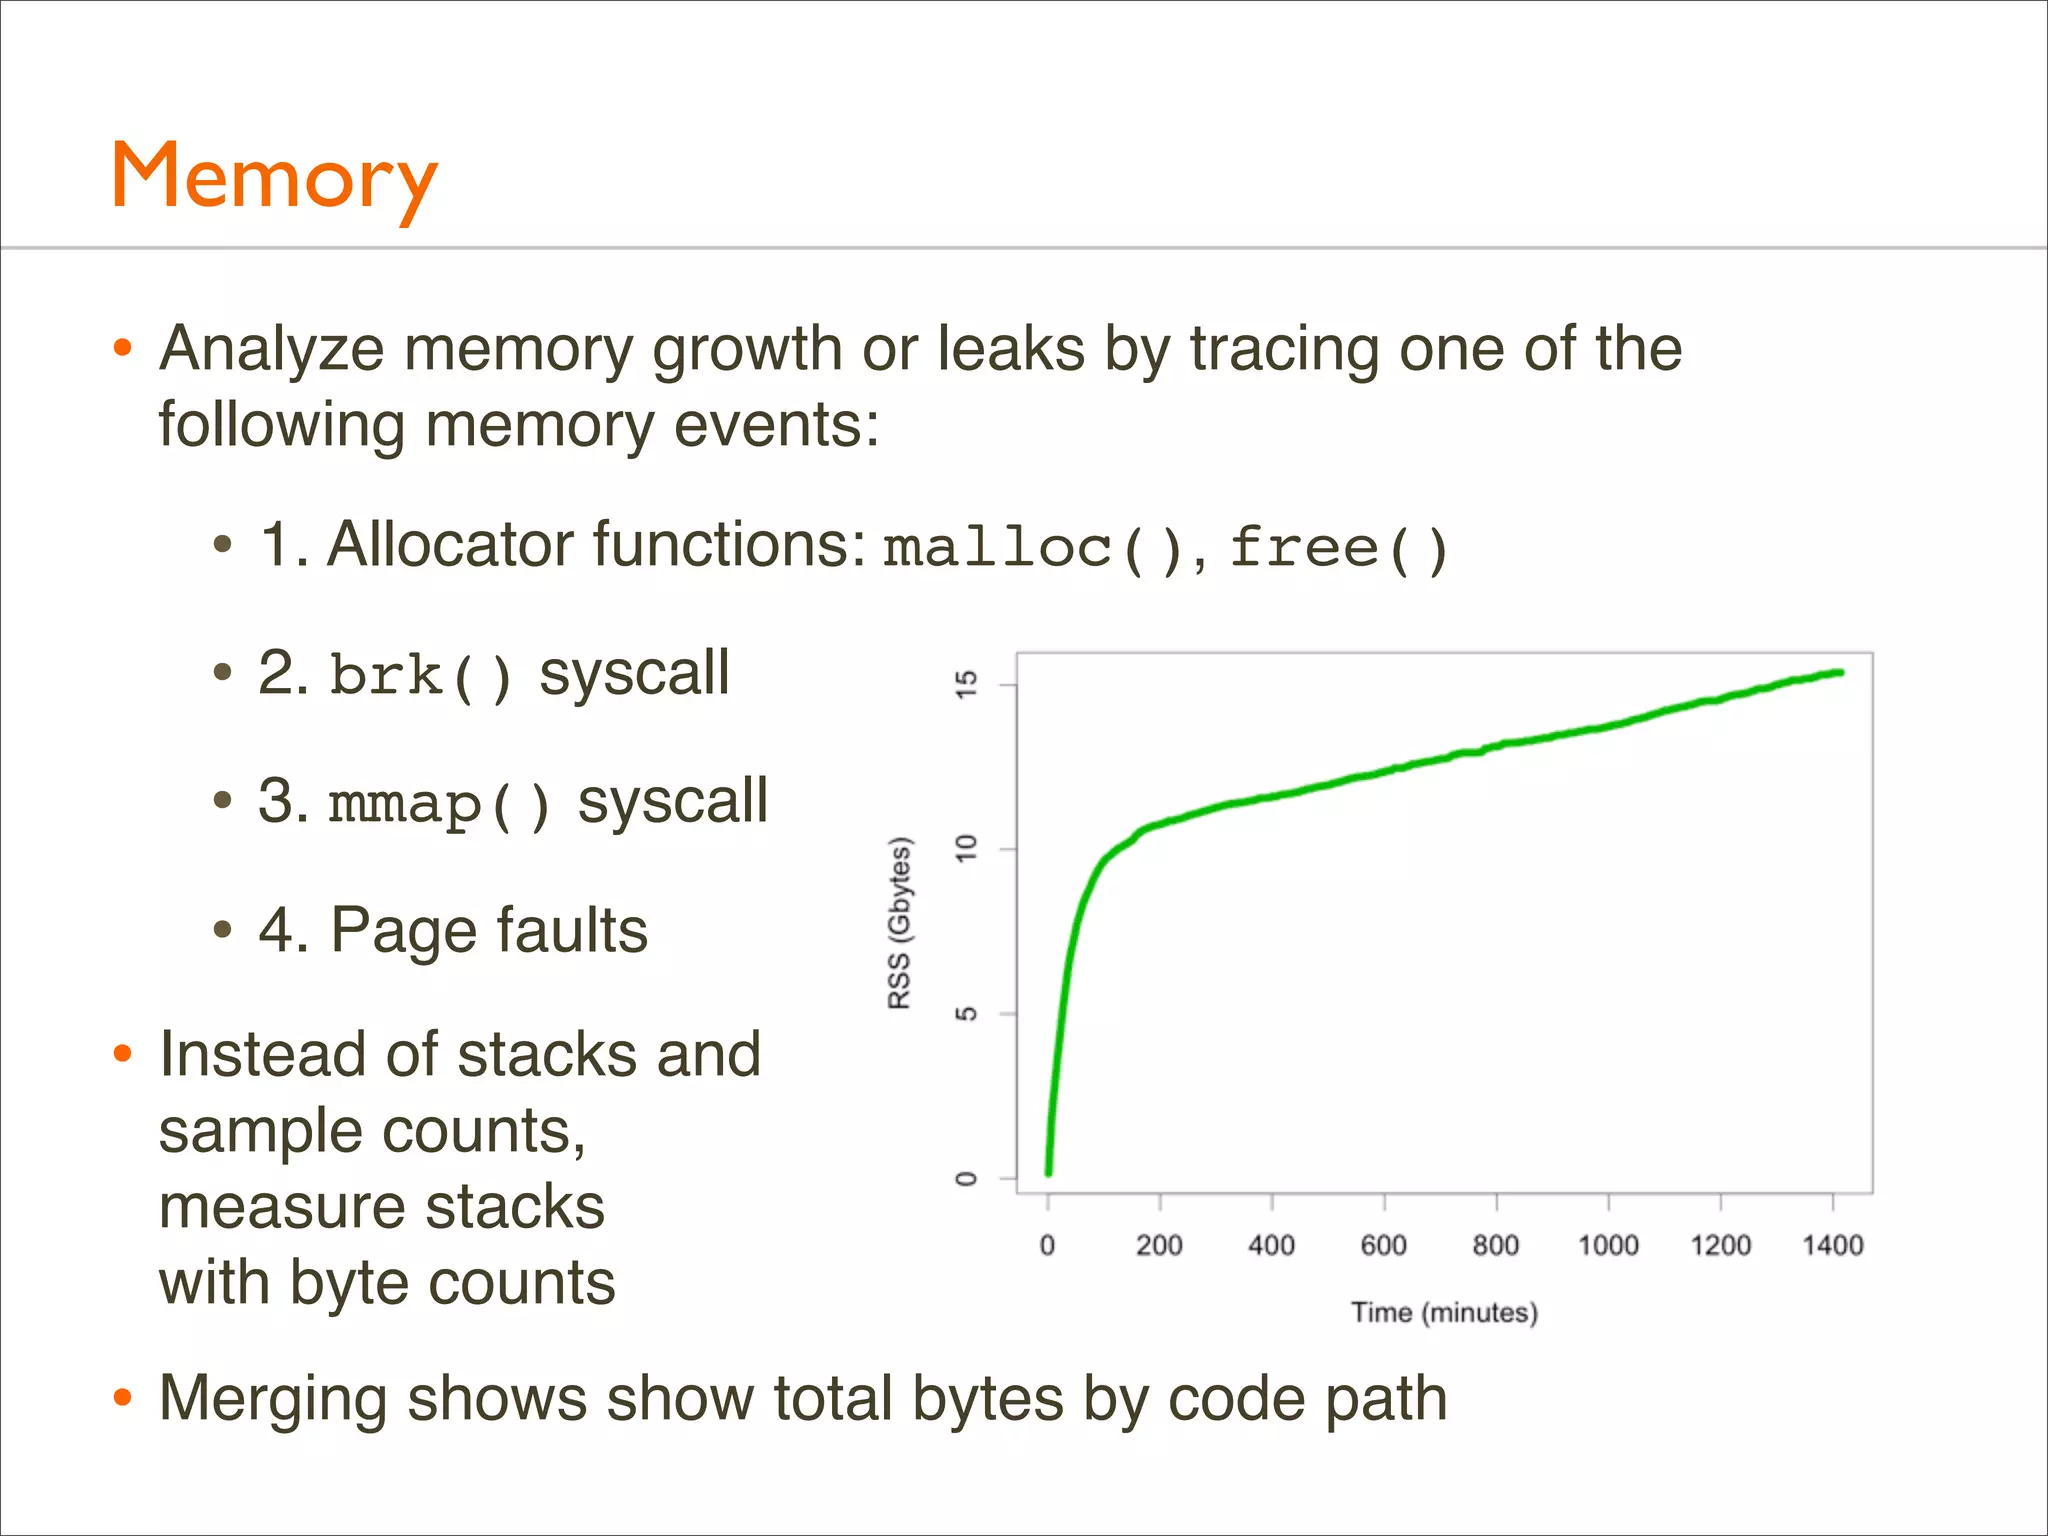
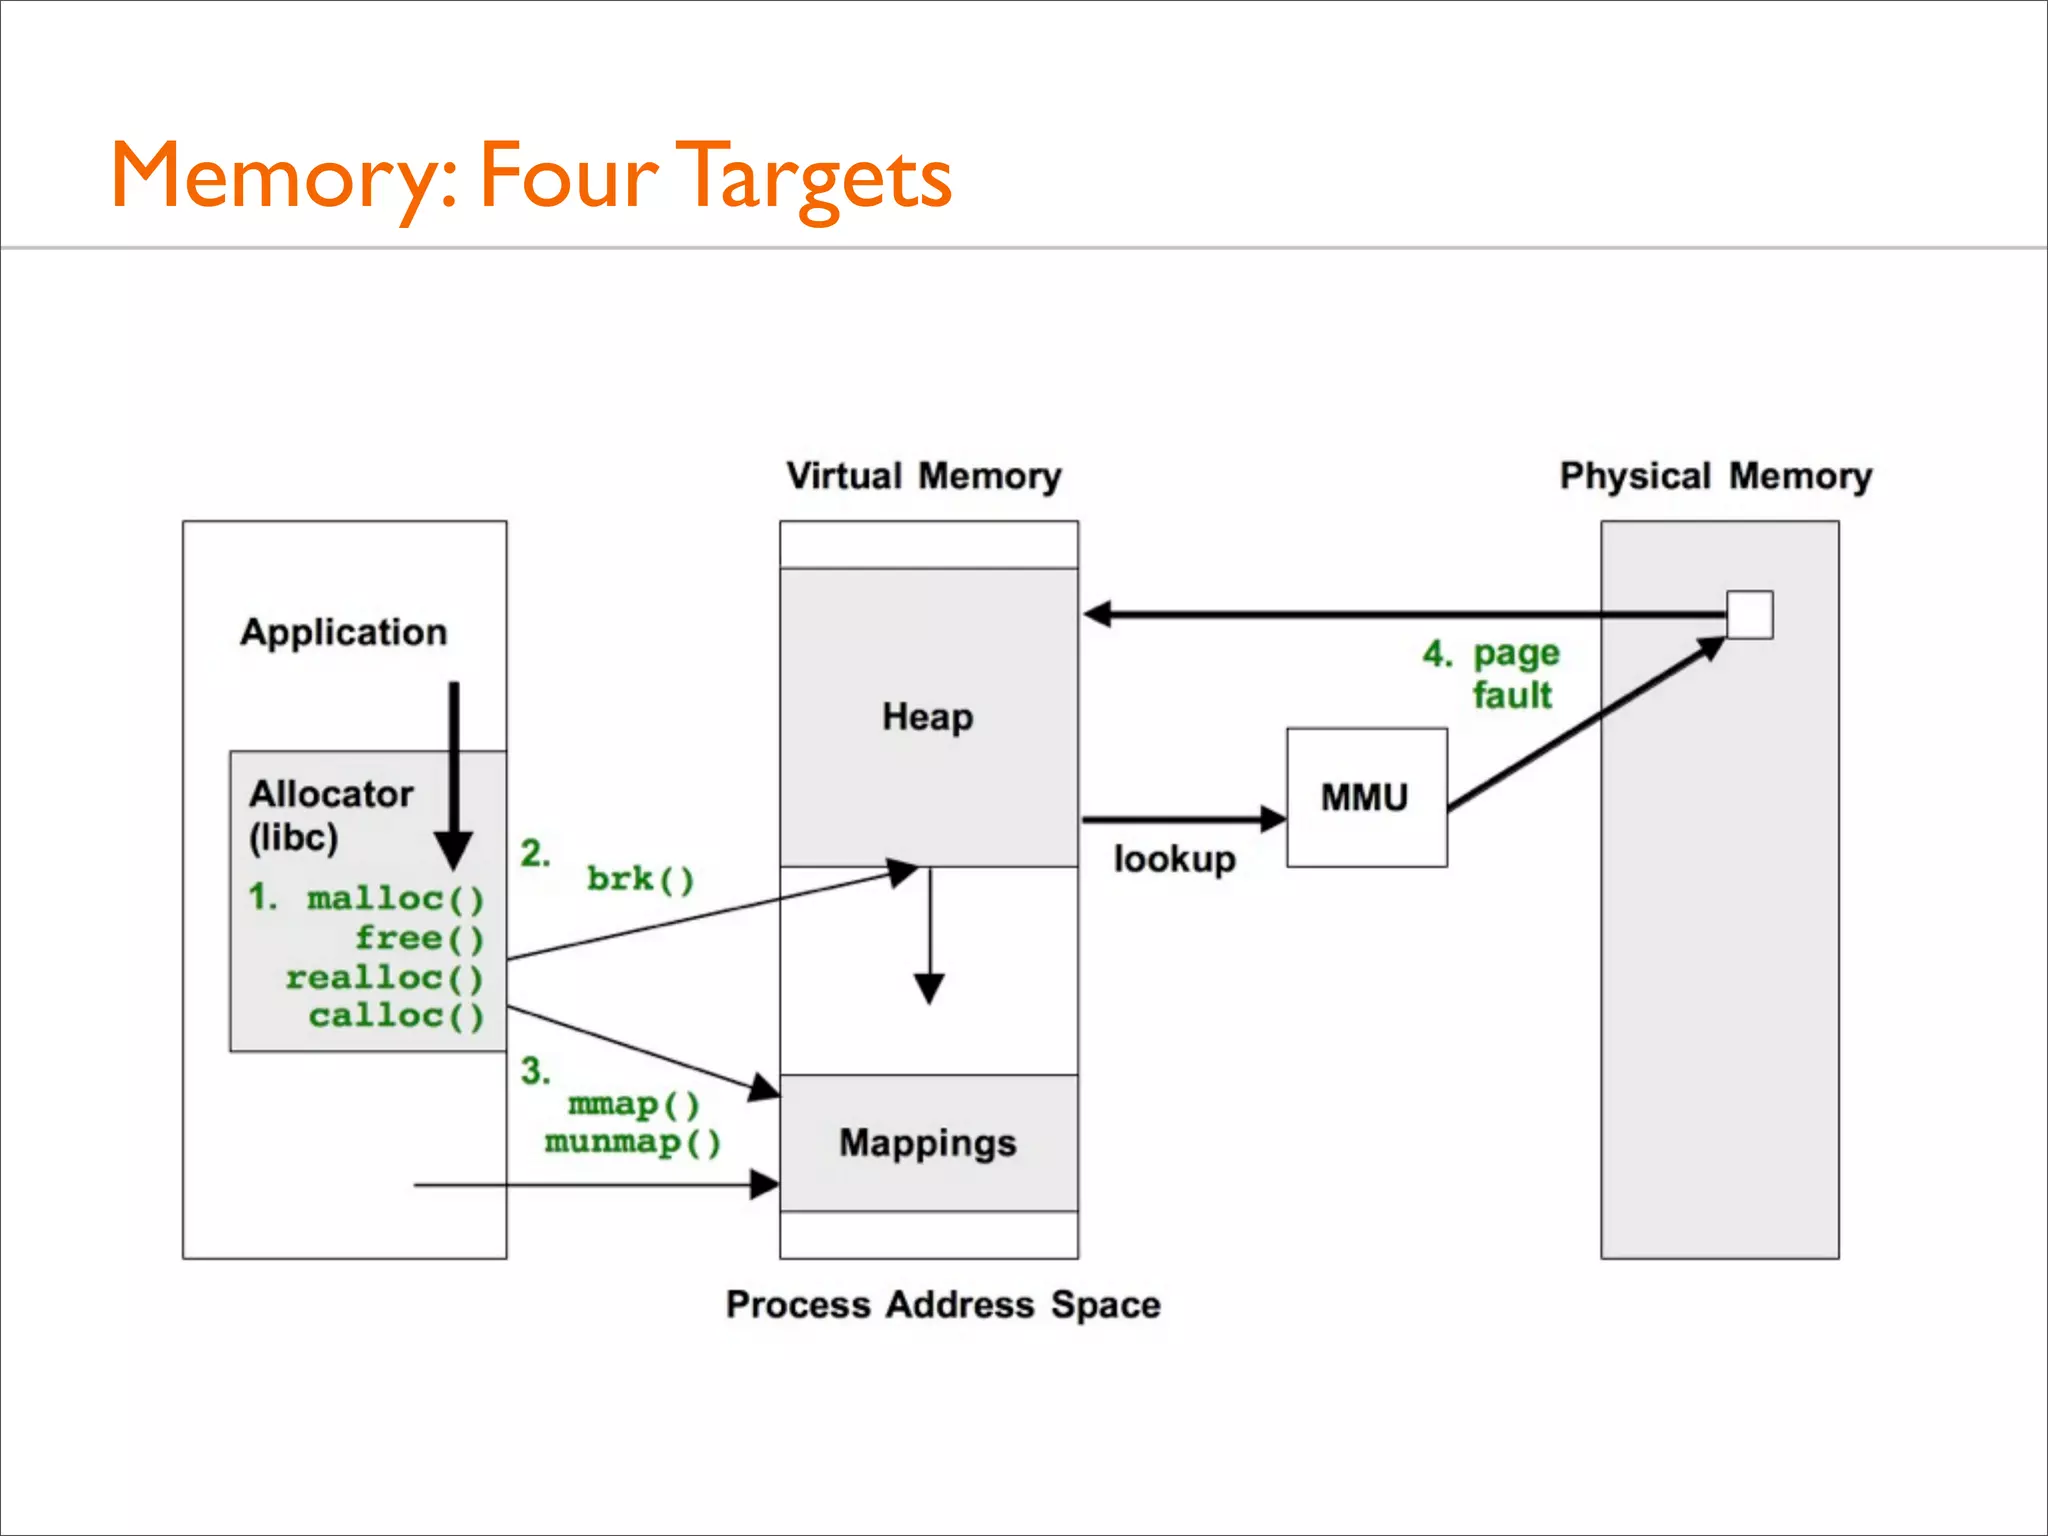
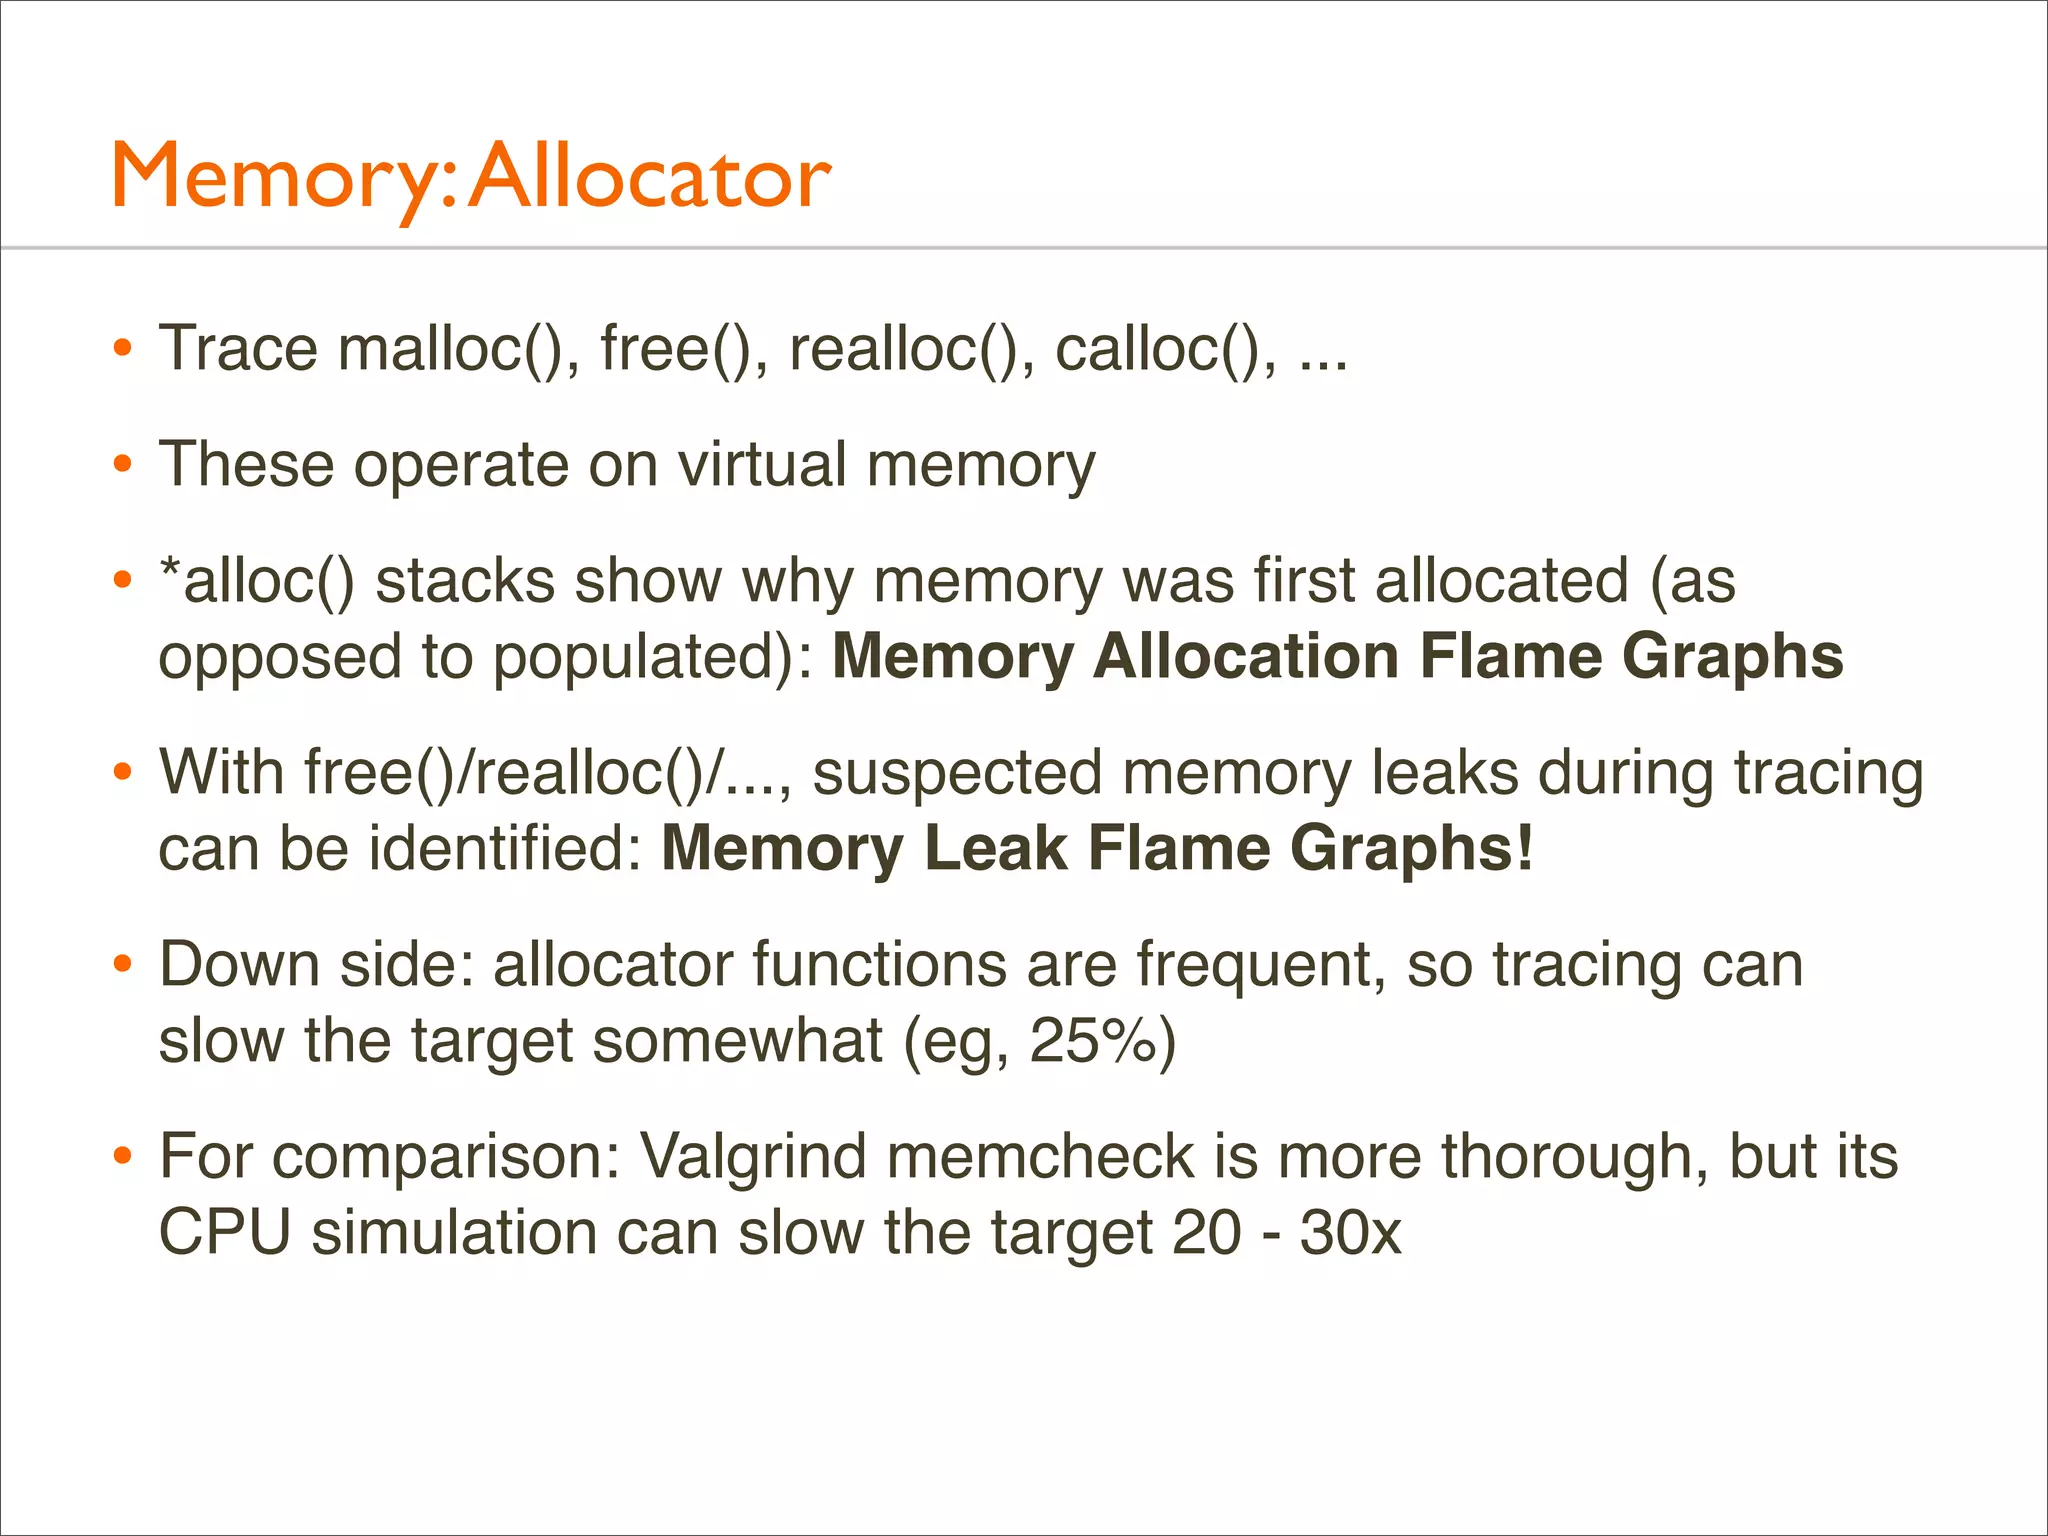
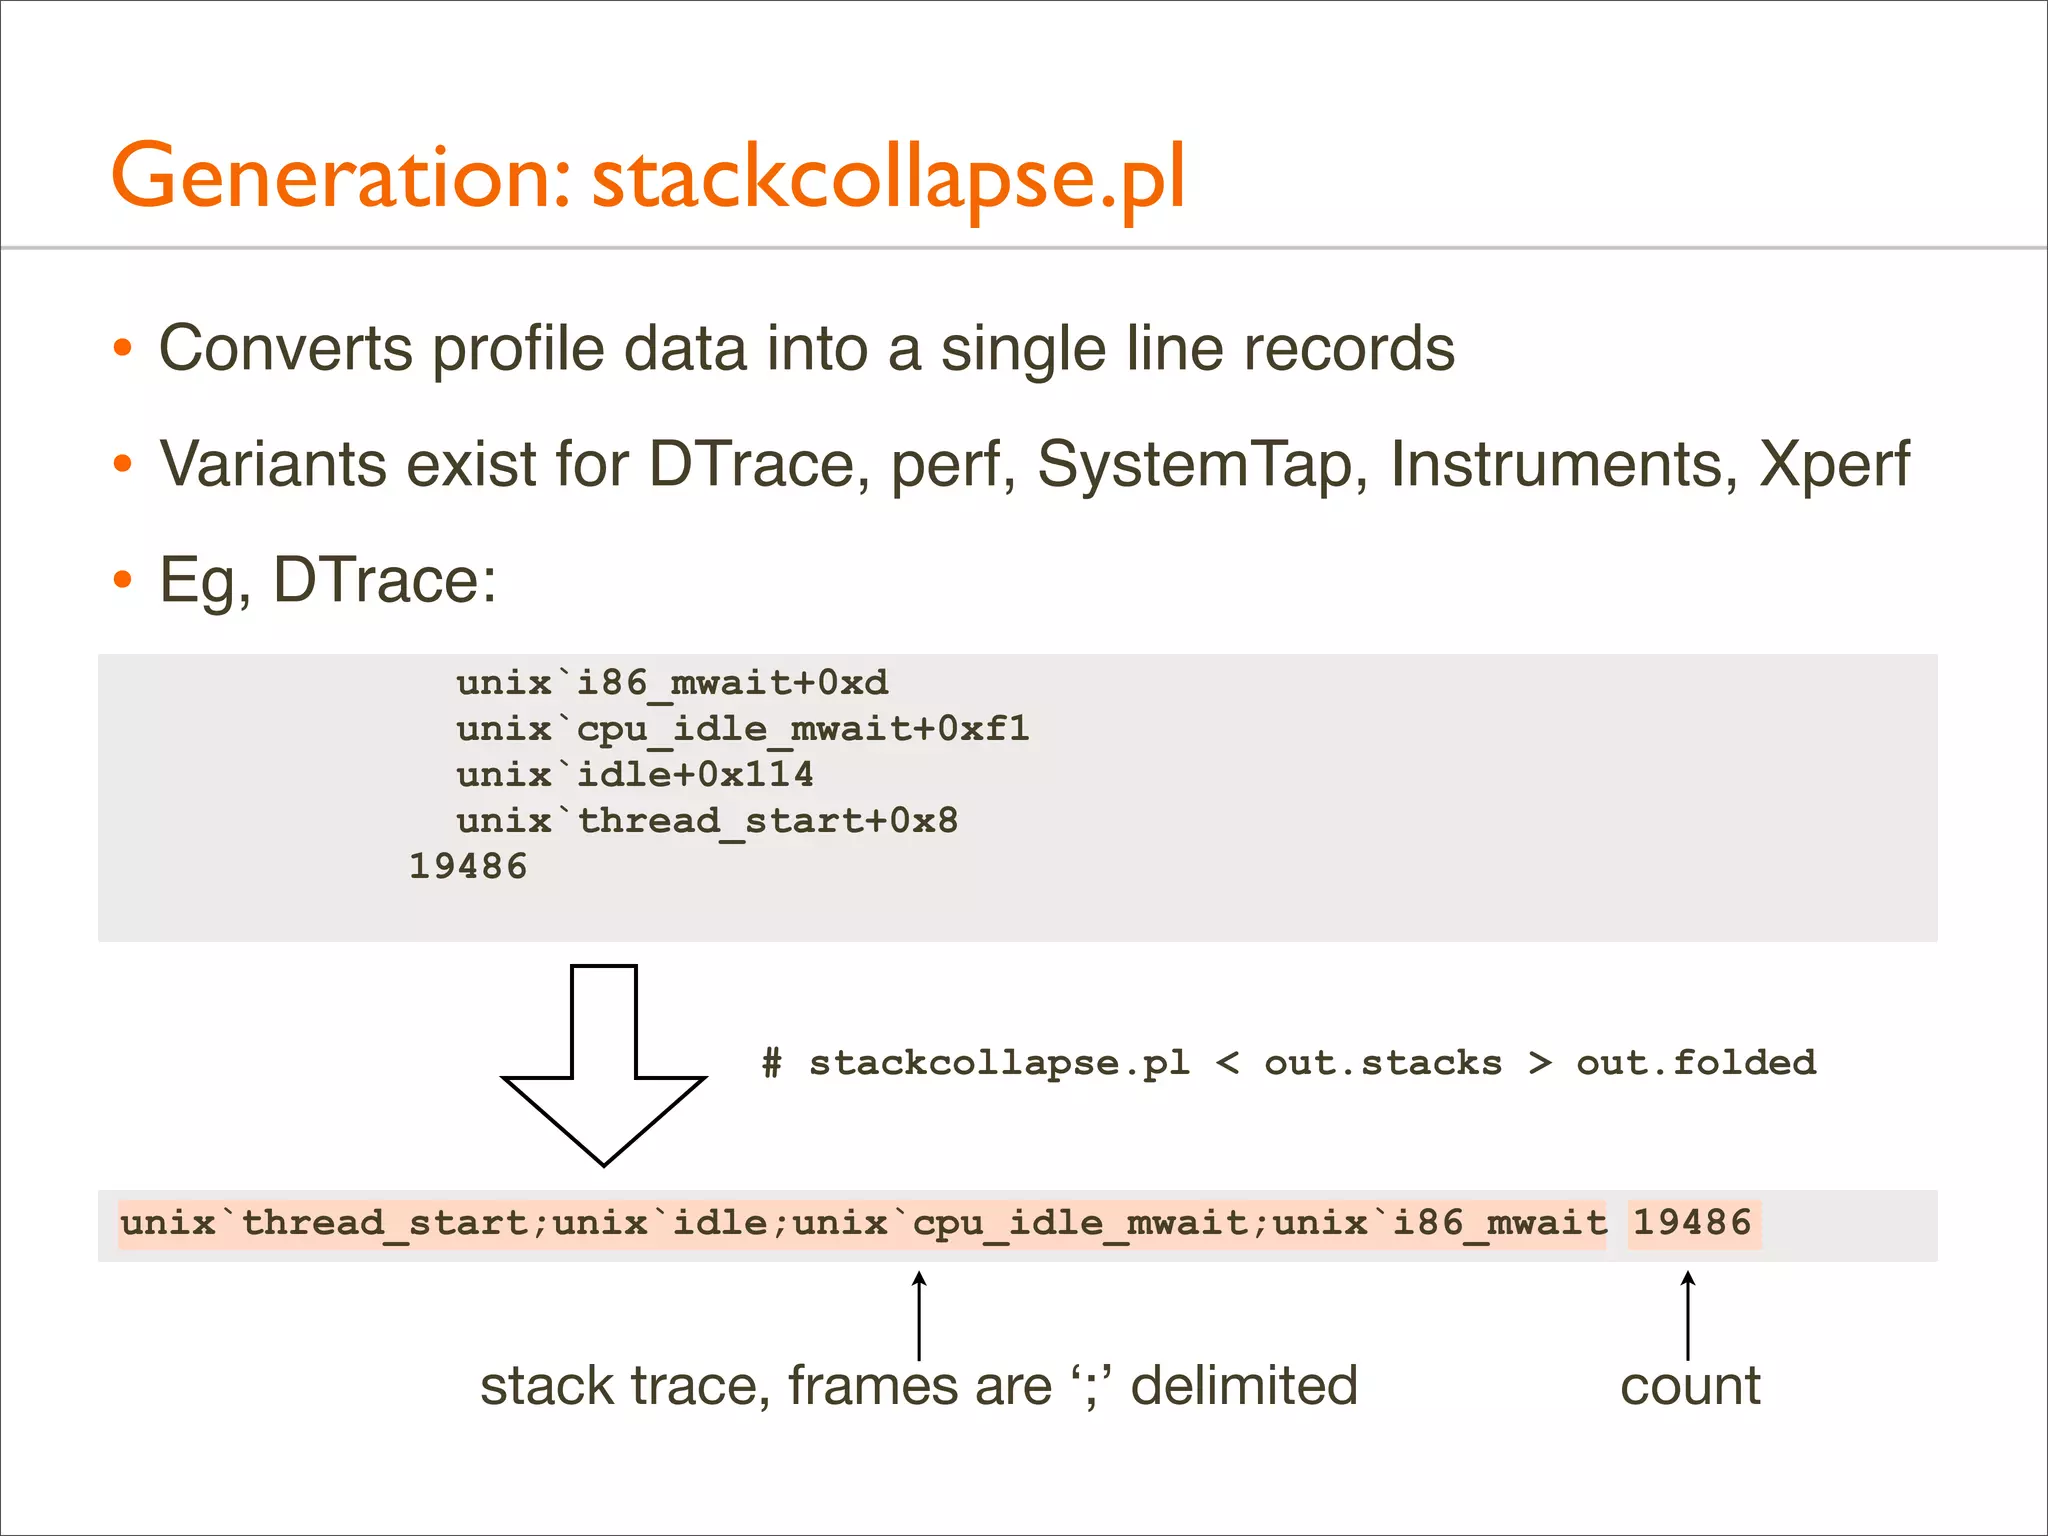
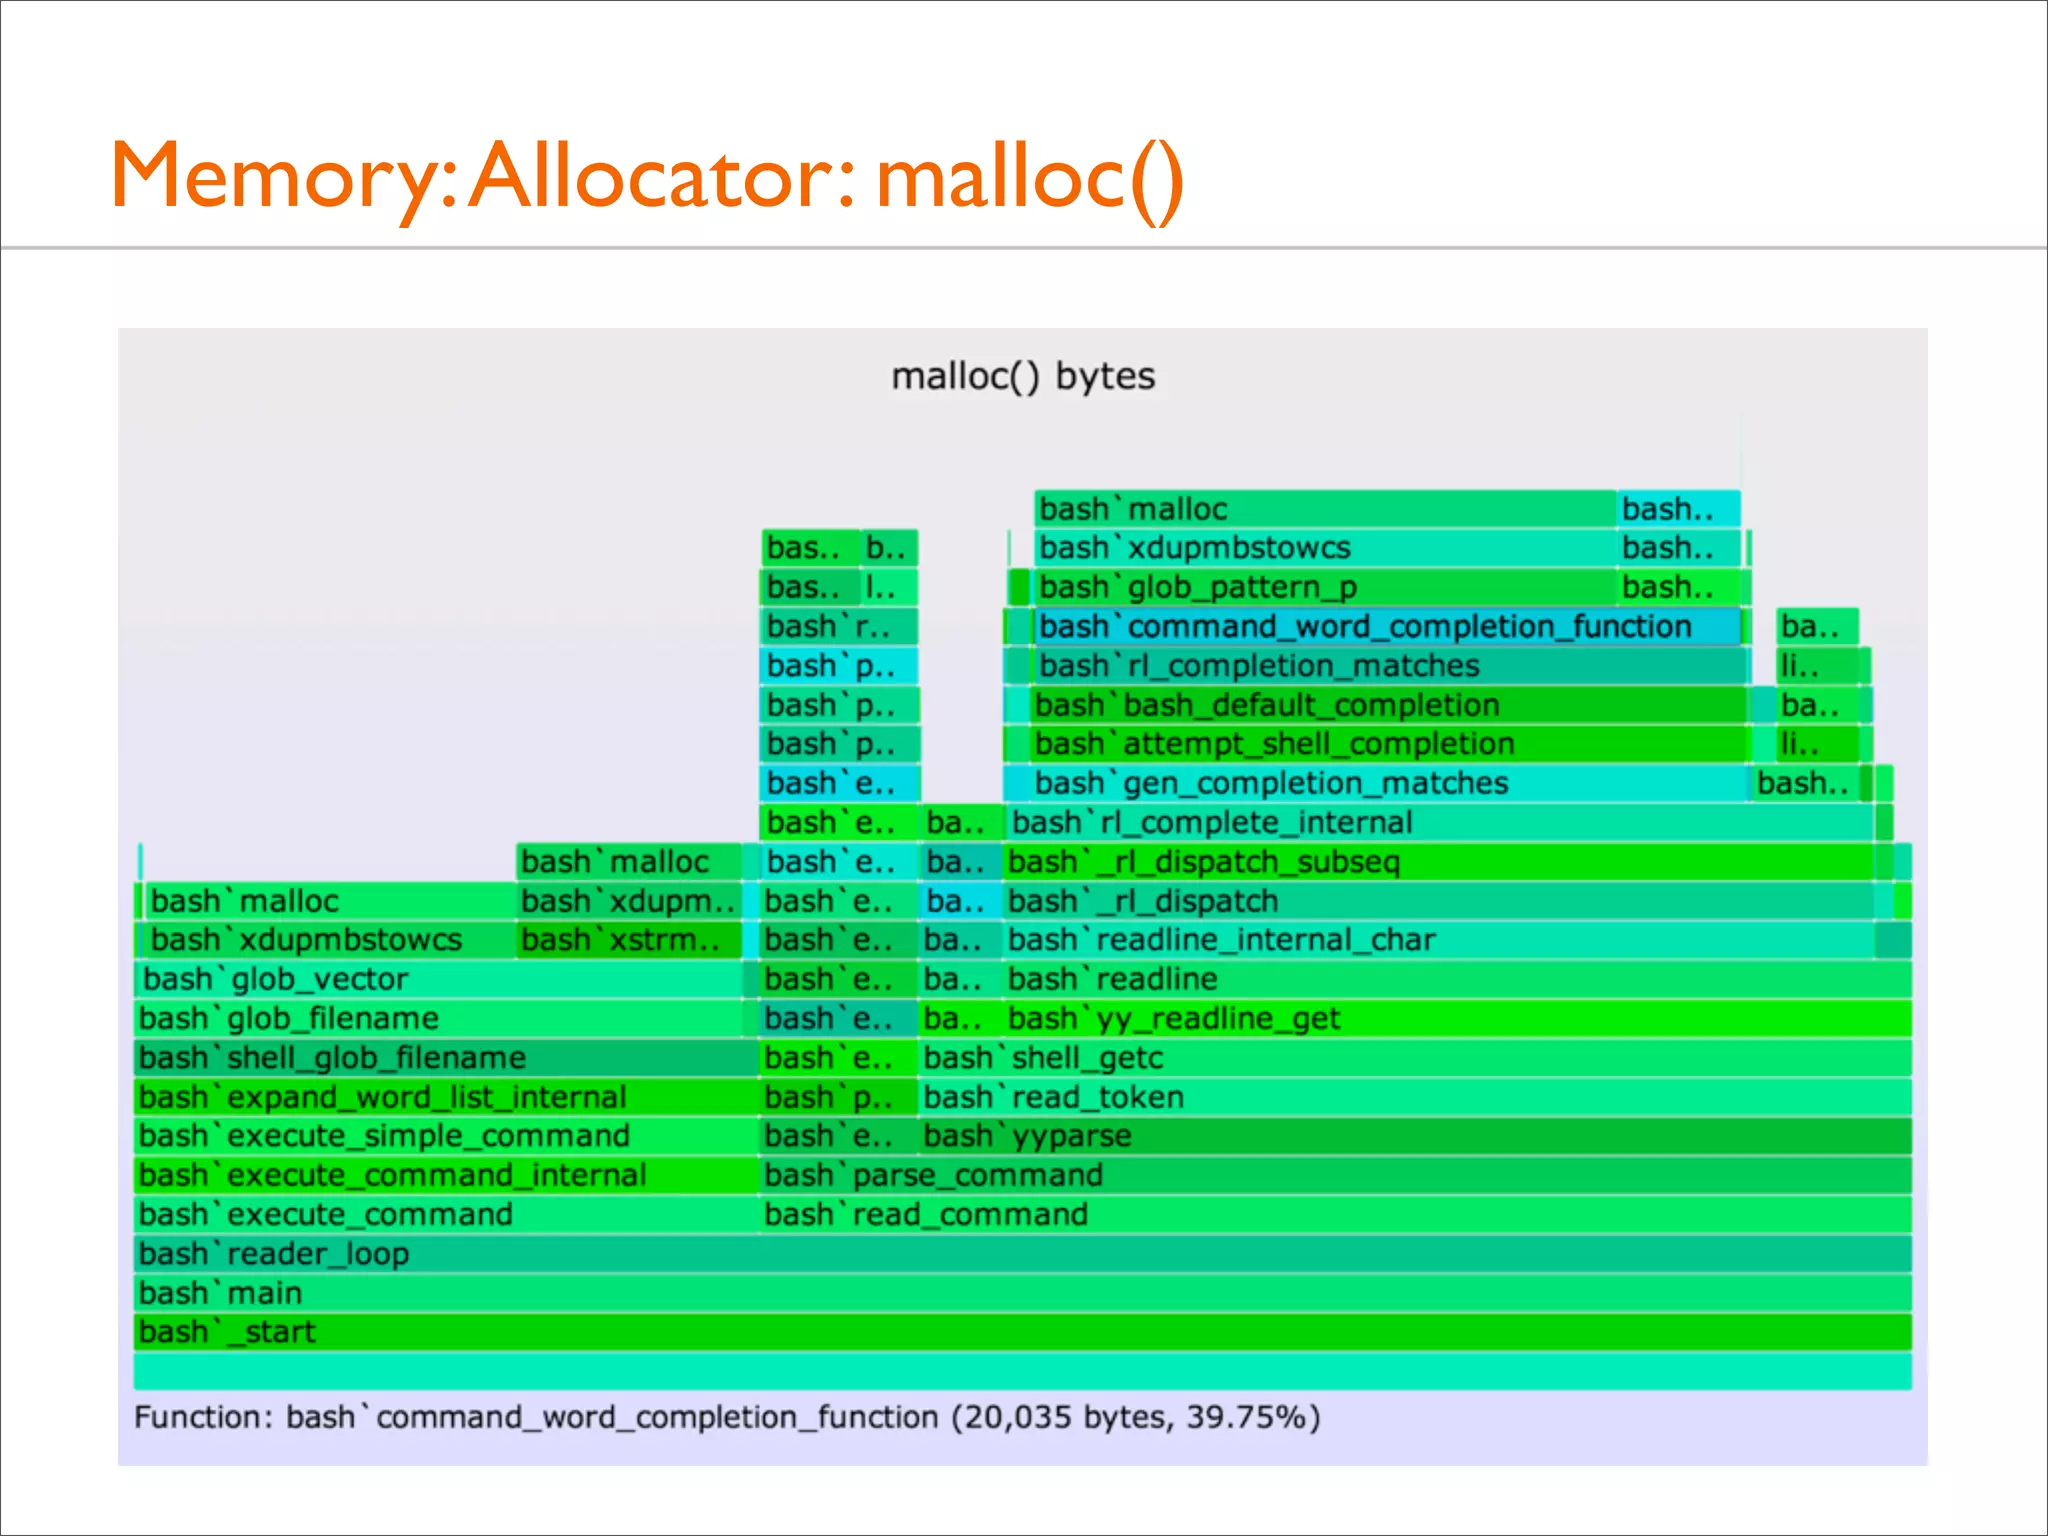
![Memory: Allocator: malloc()
• As a simple example, just tracing malloc() calls with user-level
stacks and bytes requested, using DTrace:
# dtrace -x ustackframes=100 -n 'pid$target::malloc:entry {
@[ustack()] = sum(arg0); } tick-60s { exit(0); }' -p 529 -o out.malloc
• malloc() Bytes Flame Graph:
# stackcollapse.pl out.malloc | flamegraph.pl --title="malloc() bytes"
--countname="bytes" --colors=mem > out.malloc.svg
• The options customize the title, countname, and color palette](https://image.slidesharecdn.com/lisa13flamegraphs-131107112122-phpapp01/75/Blazing-Performance-with-Flame-Graphs-105-2048.jpg)
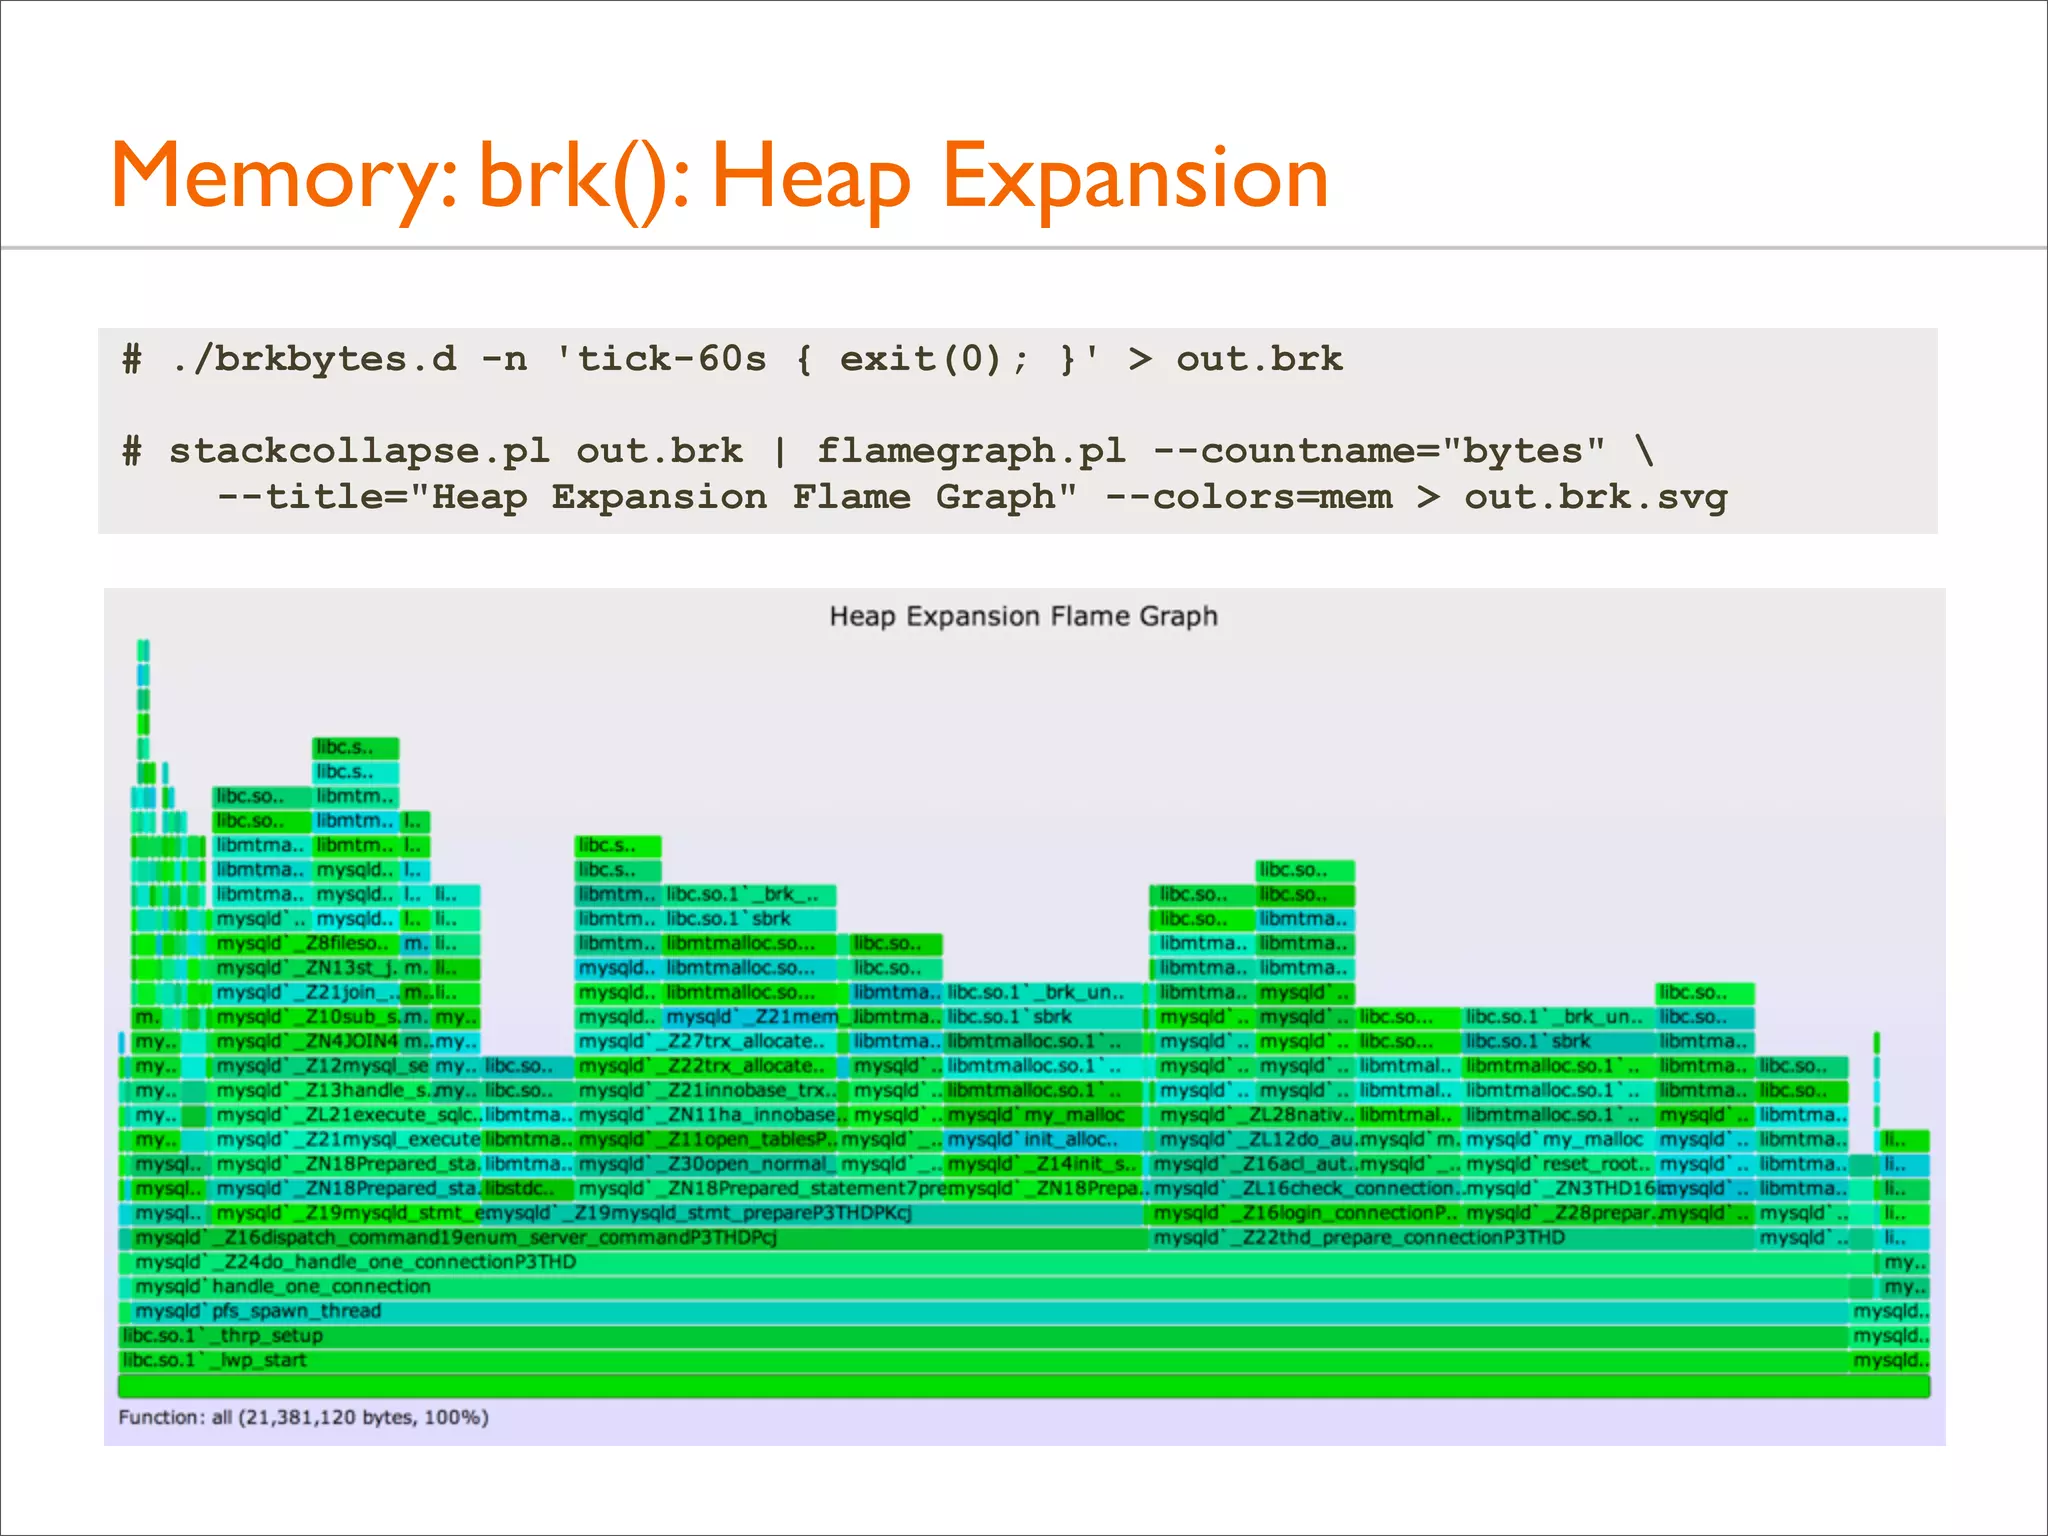
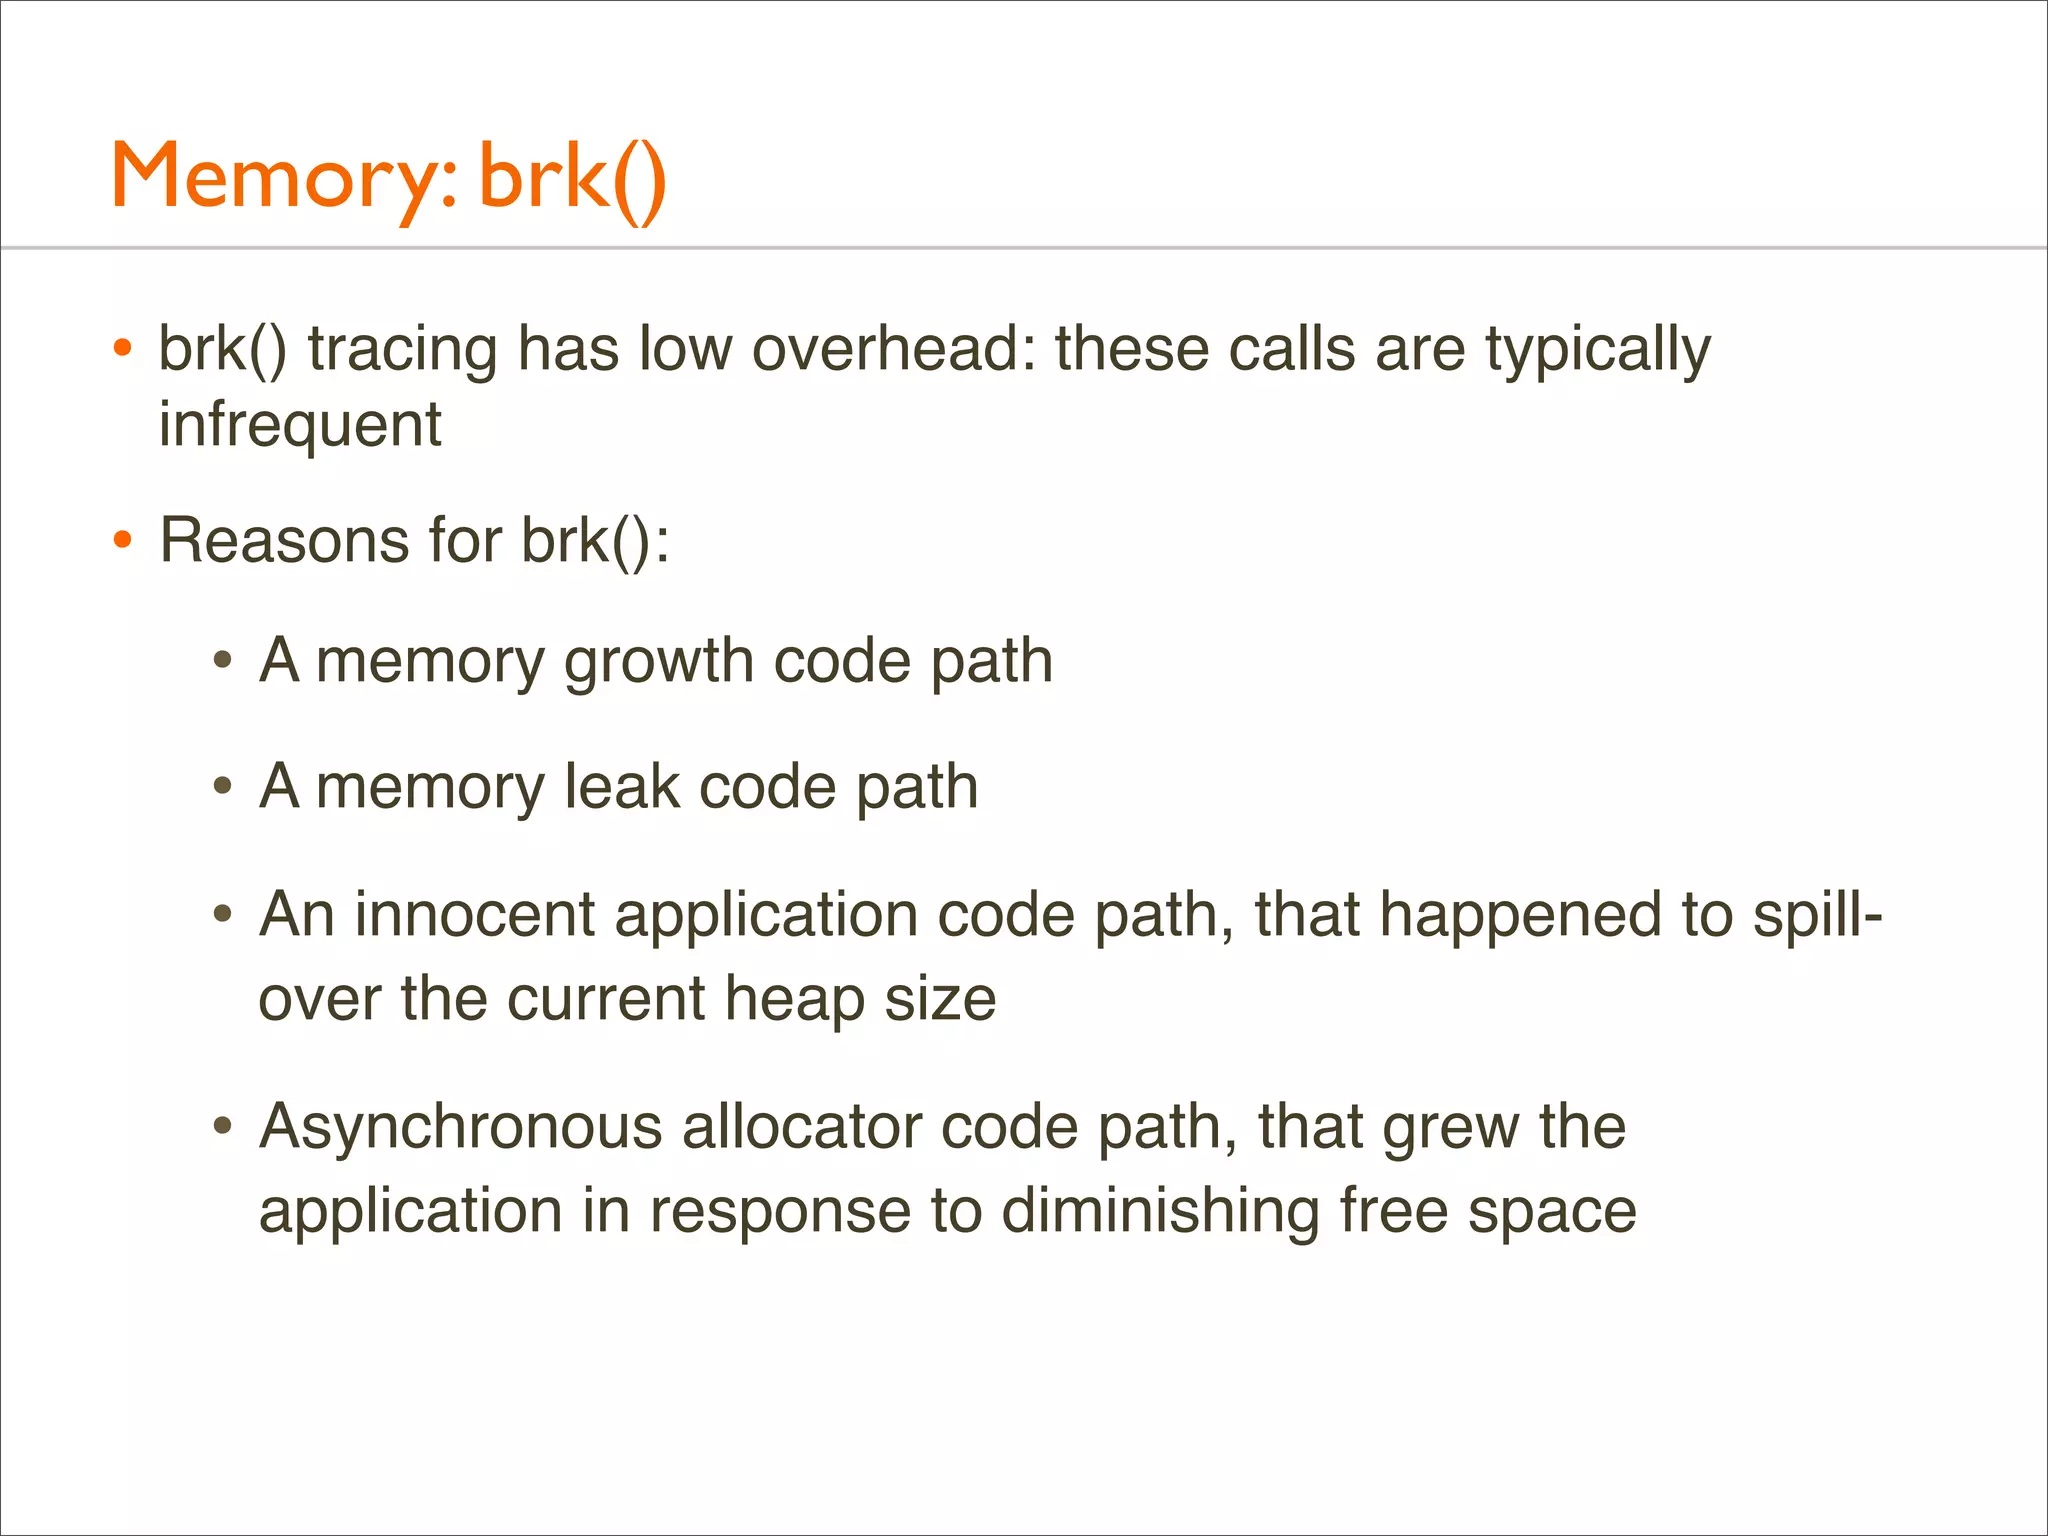
![Memory: brk()
• Many apps grow their virtual memory size using brk(), which
sets the heap pointer
• A stack trace on brk() shows what triggered growth
• Eg, this script (brkbytes.d) traces brk() growth for “mysqld”:
#!/usr/sbin/dtrace -s
inline string target = "mysqld";
uint brk[int];
syscall::brk:entry /execname == target/ { self->p = arg0; }
syscall::brk:return /arg0 == 0 && self->p && brk[pid]/ {
@[ustack()] = sum(self->p - brk[pid]);
}
syscall::brk:return /arg0 == 0 && self->p/ { brk[pid] = self->p; }
syscall::brk:return /self->p/ { self->p = 0; }](https://image.slidesharecdn.com/lisa13flamegraphs-131107112122-phpapp01/75/Blazing-Performance-with-Flame-Graphs-108-2048.jpg)
![Memory: mmap()
• mmap() may be used by the application or it’s user-level
allocator to map in large regions of virtual memory
• It may be followed by munmap() to free the area, which can
also be traced
• Eg, mmap() tracing, similar to brk tracing, to show bytes and
the stacks responsible:
# dtrace -n 'syscall::mmap:entry /execname == "mysqld"/ {
@[ustack()] = sum(arg1); }' -o out.mmap
# stackcollapse.pl out.mmap | flamegraph.pl --countname="bytes"
--title="mmap() bytes Flame Graph" --colors=mem > out.mmap.svg
• This should be low overhead – depends on the frequency](https://image.slidesharecdn.com/lisa13flamegraphs-131107112122-phpapp01/75/Blazing-Performance-with-Flame-Graphs-111-2048.jpg)
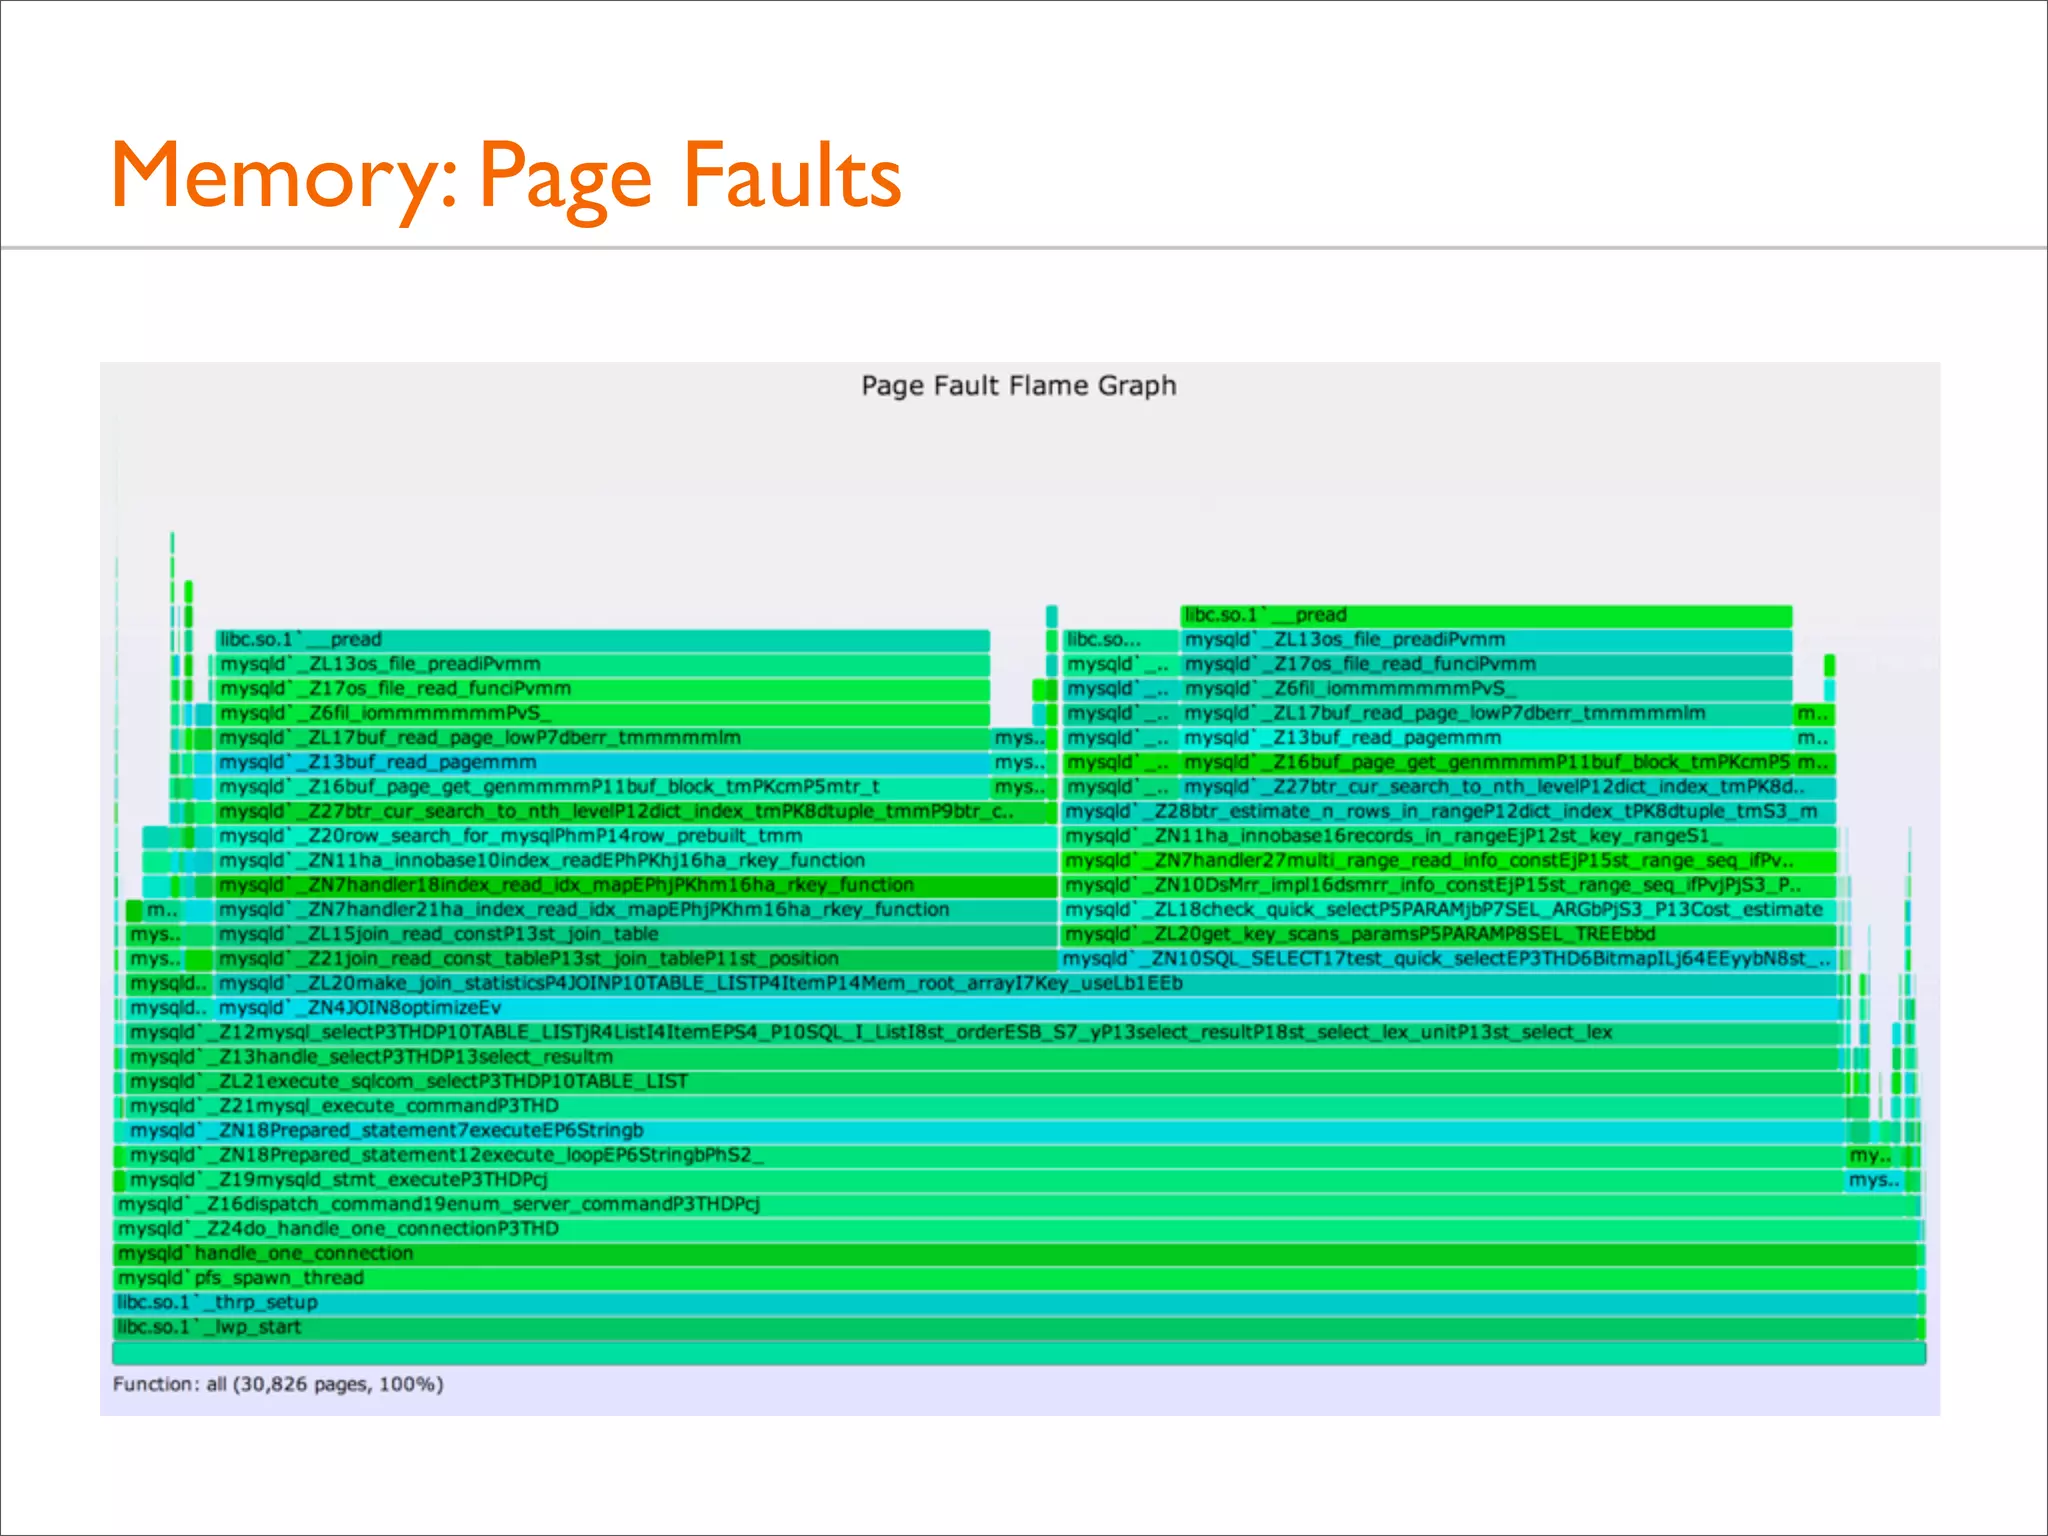
![Memory: Page Faults
• brk() and mmap() expand virtual memory
• Page faults expand physical memory (RSS). This is demandbased allocation, deferring mapping to the actual write
• Tracing page faults show the stack responsible for consuming
(writing to) memory:
# dtrace -x ustackframes=100 -n 'vminfo:::as_fault /execname == "mysqld"/ {
@[ustack()] = count(); } tick-60s { exit(0); }' > out.fault
# stackcollapse.pl out.mysqld_fault01 | flamegraph.pl --countname=pages
--title="Page Fault Flame Graph" --colors=mem > mysqld_fault.svg](https://image.slidesharecdn.com/lisa13flamegraphs-131107112122-phpapp01/75/Blazing-Performance-with-Flame-Graphs-112-2048.jpg)

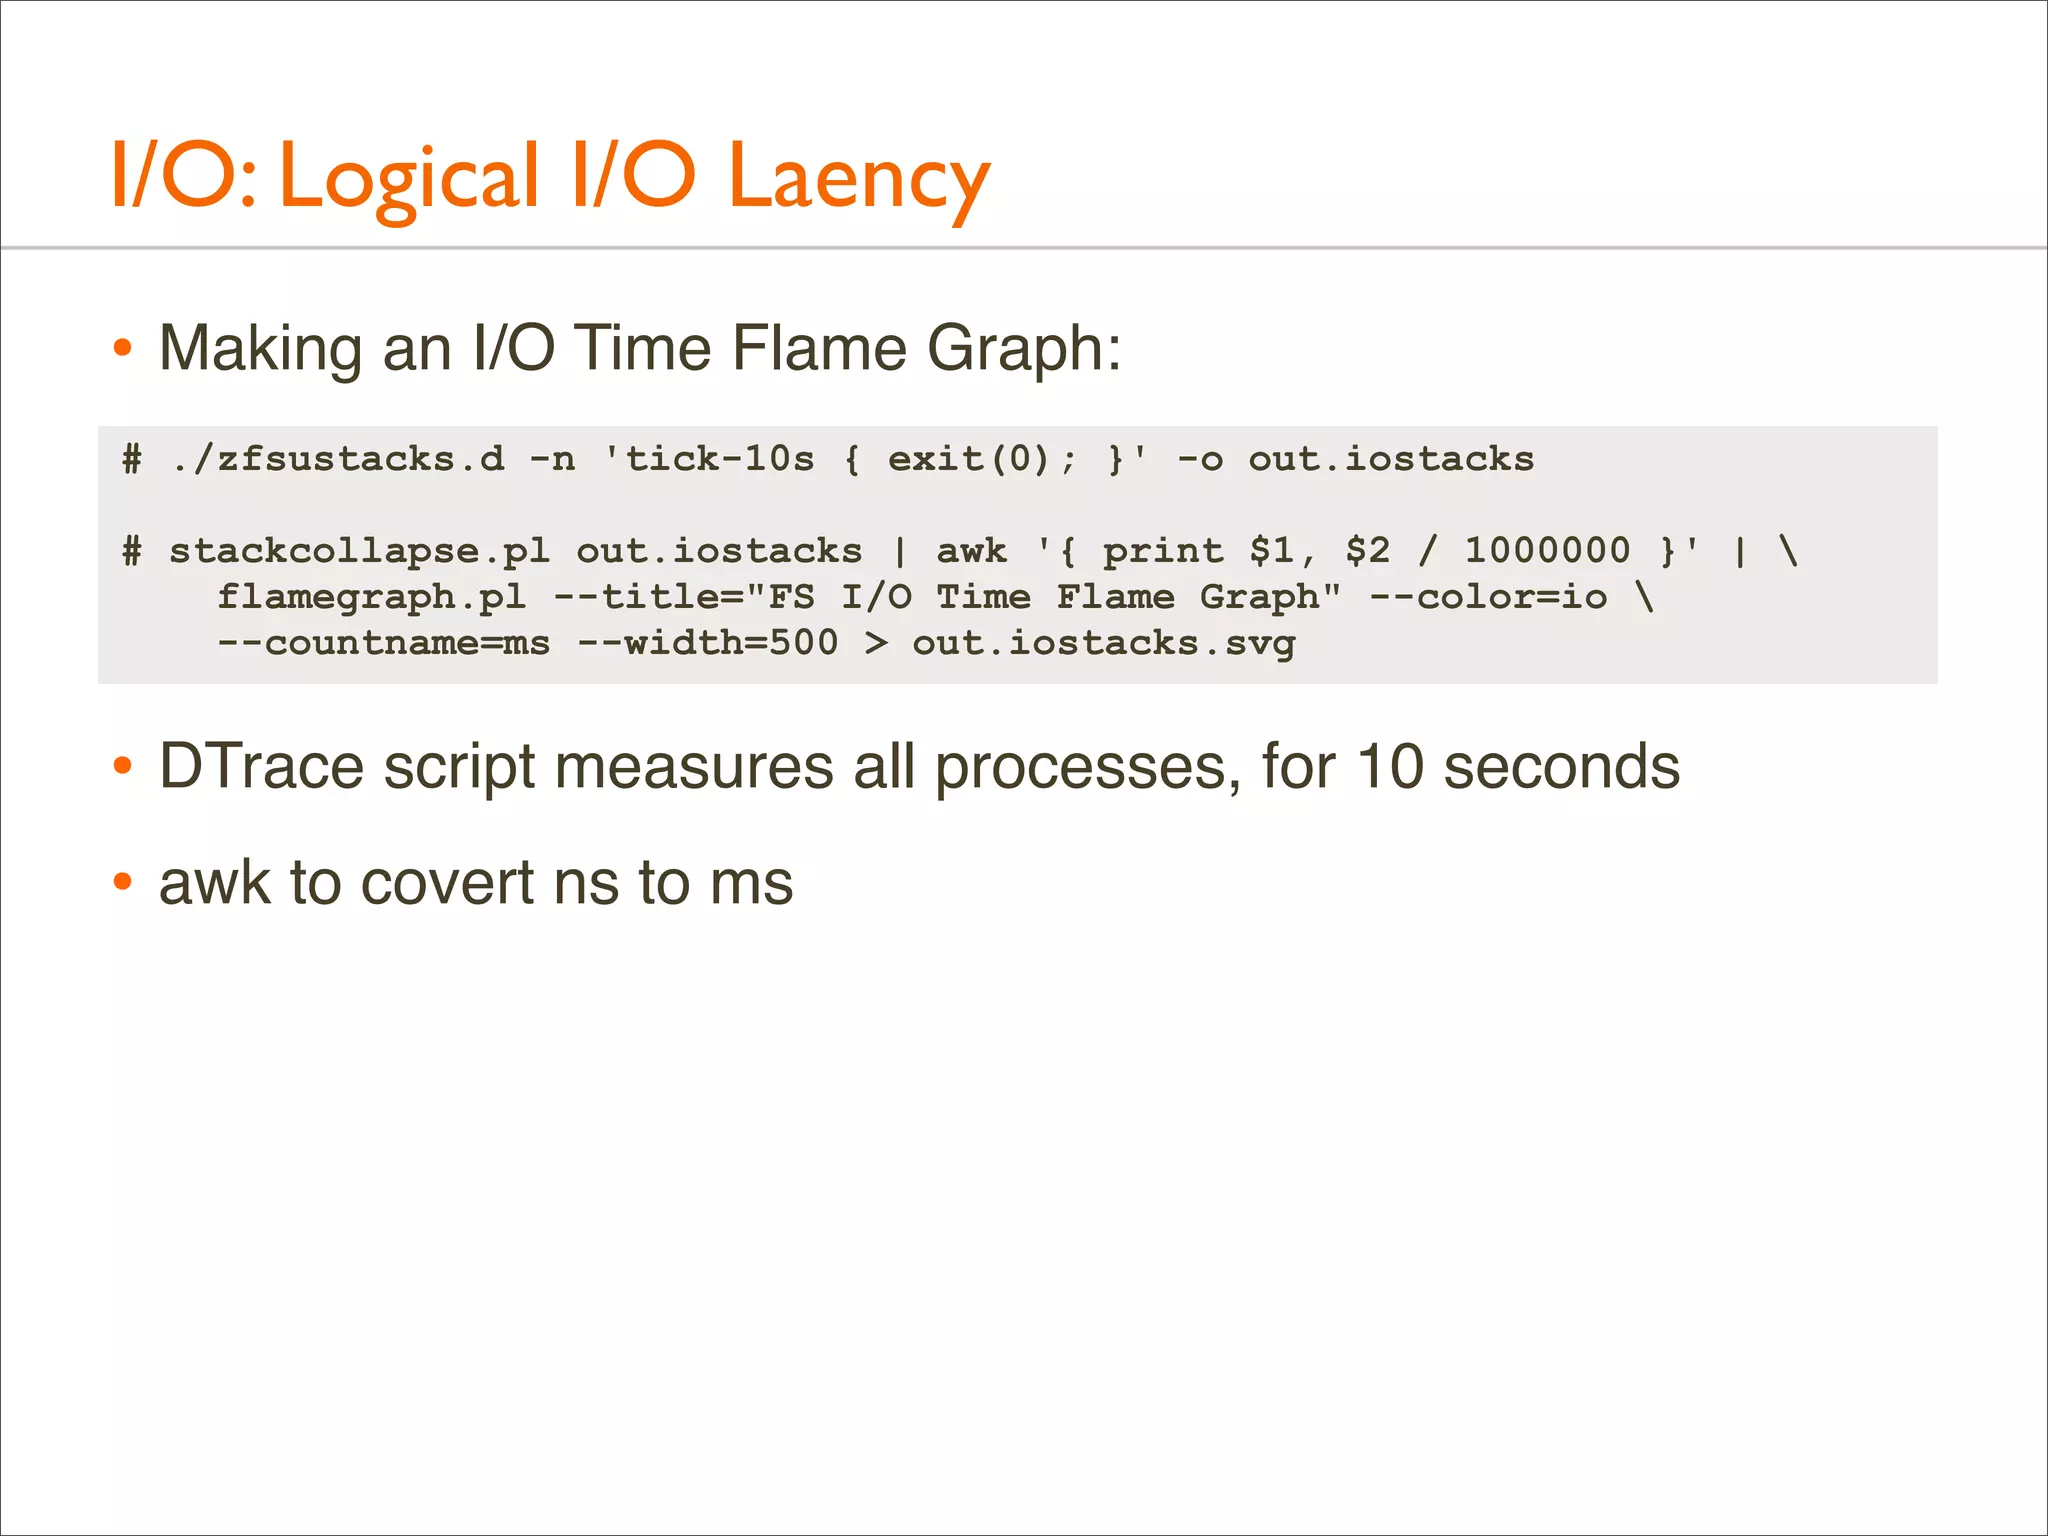
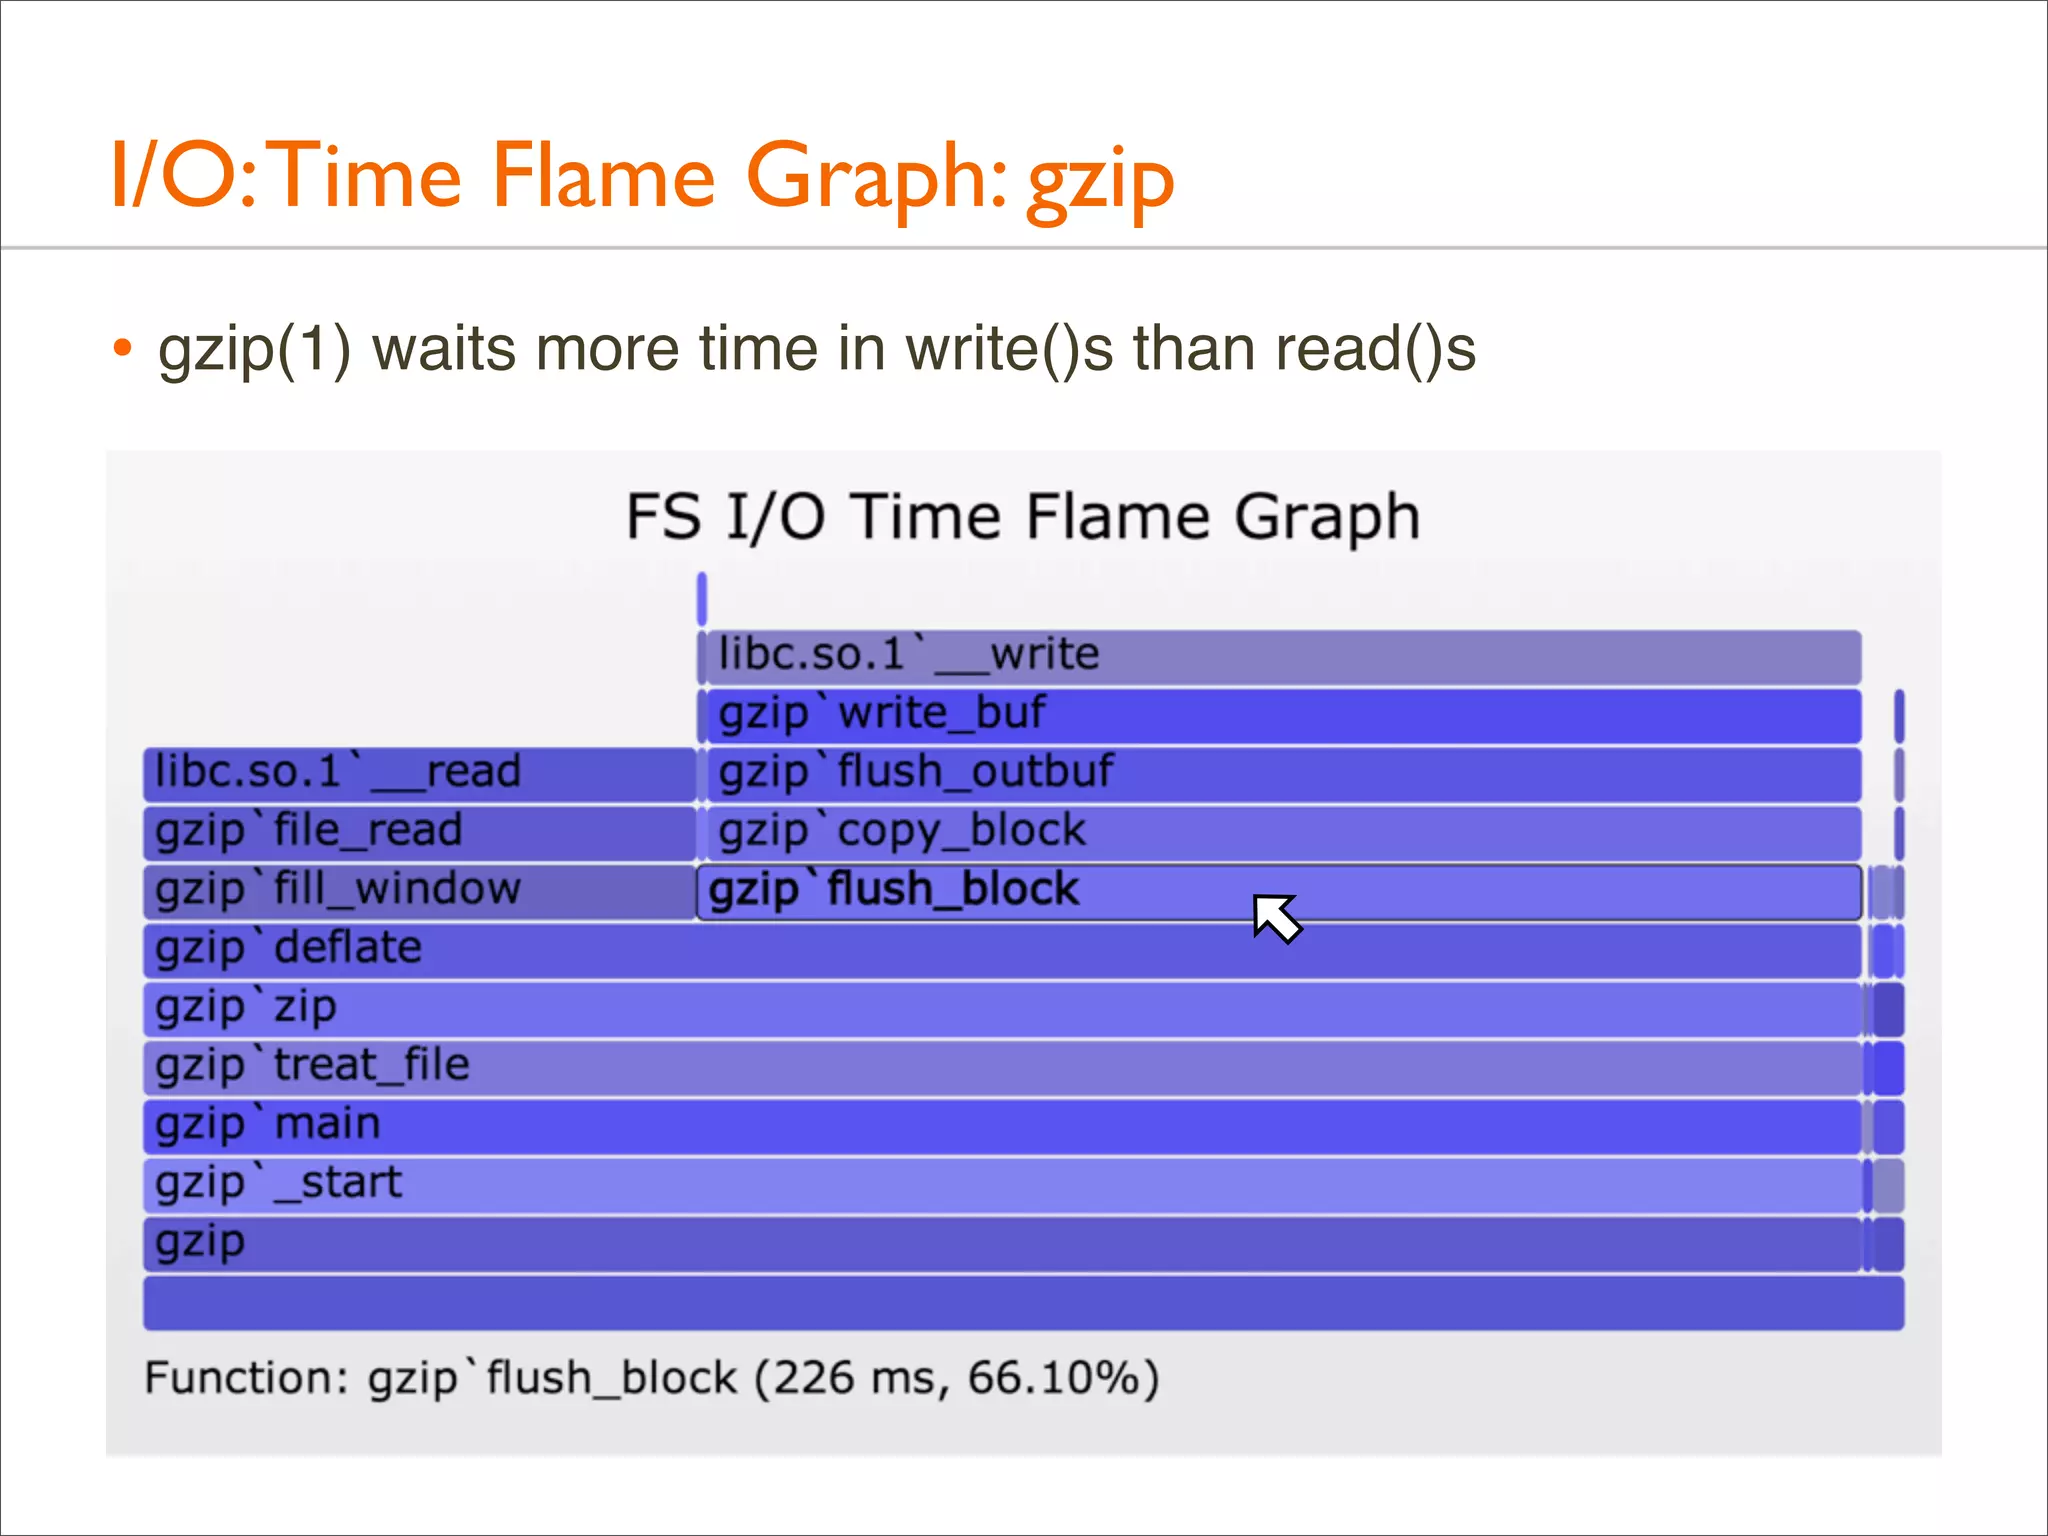
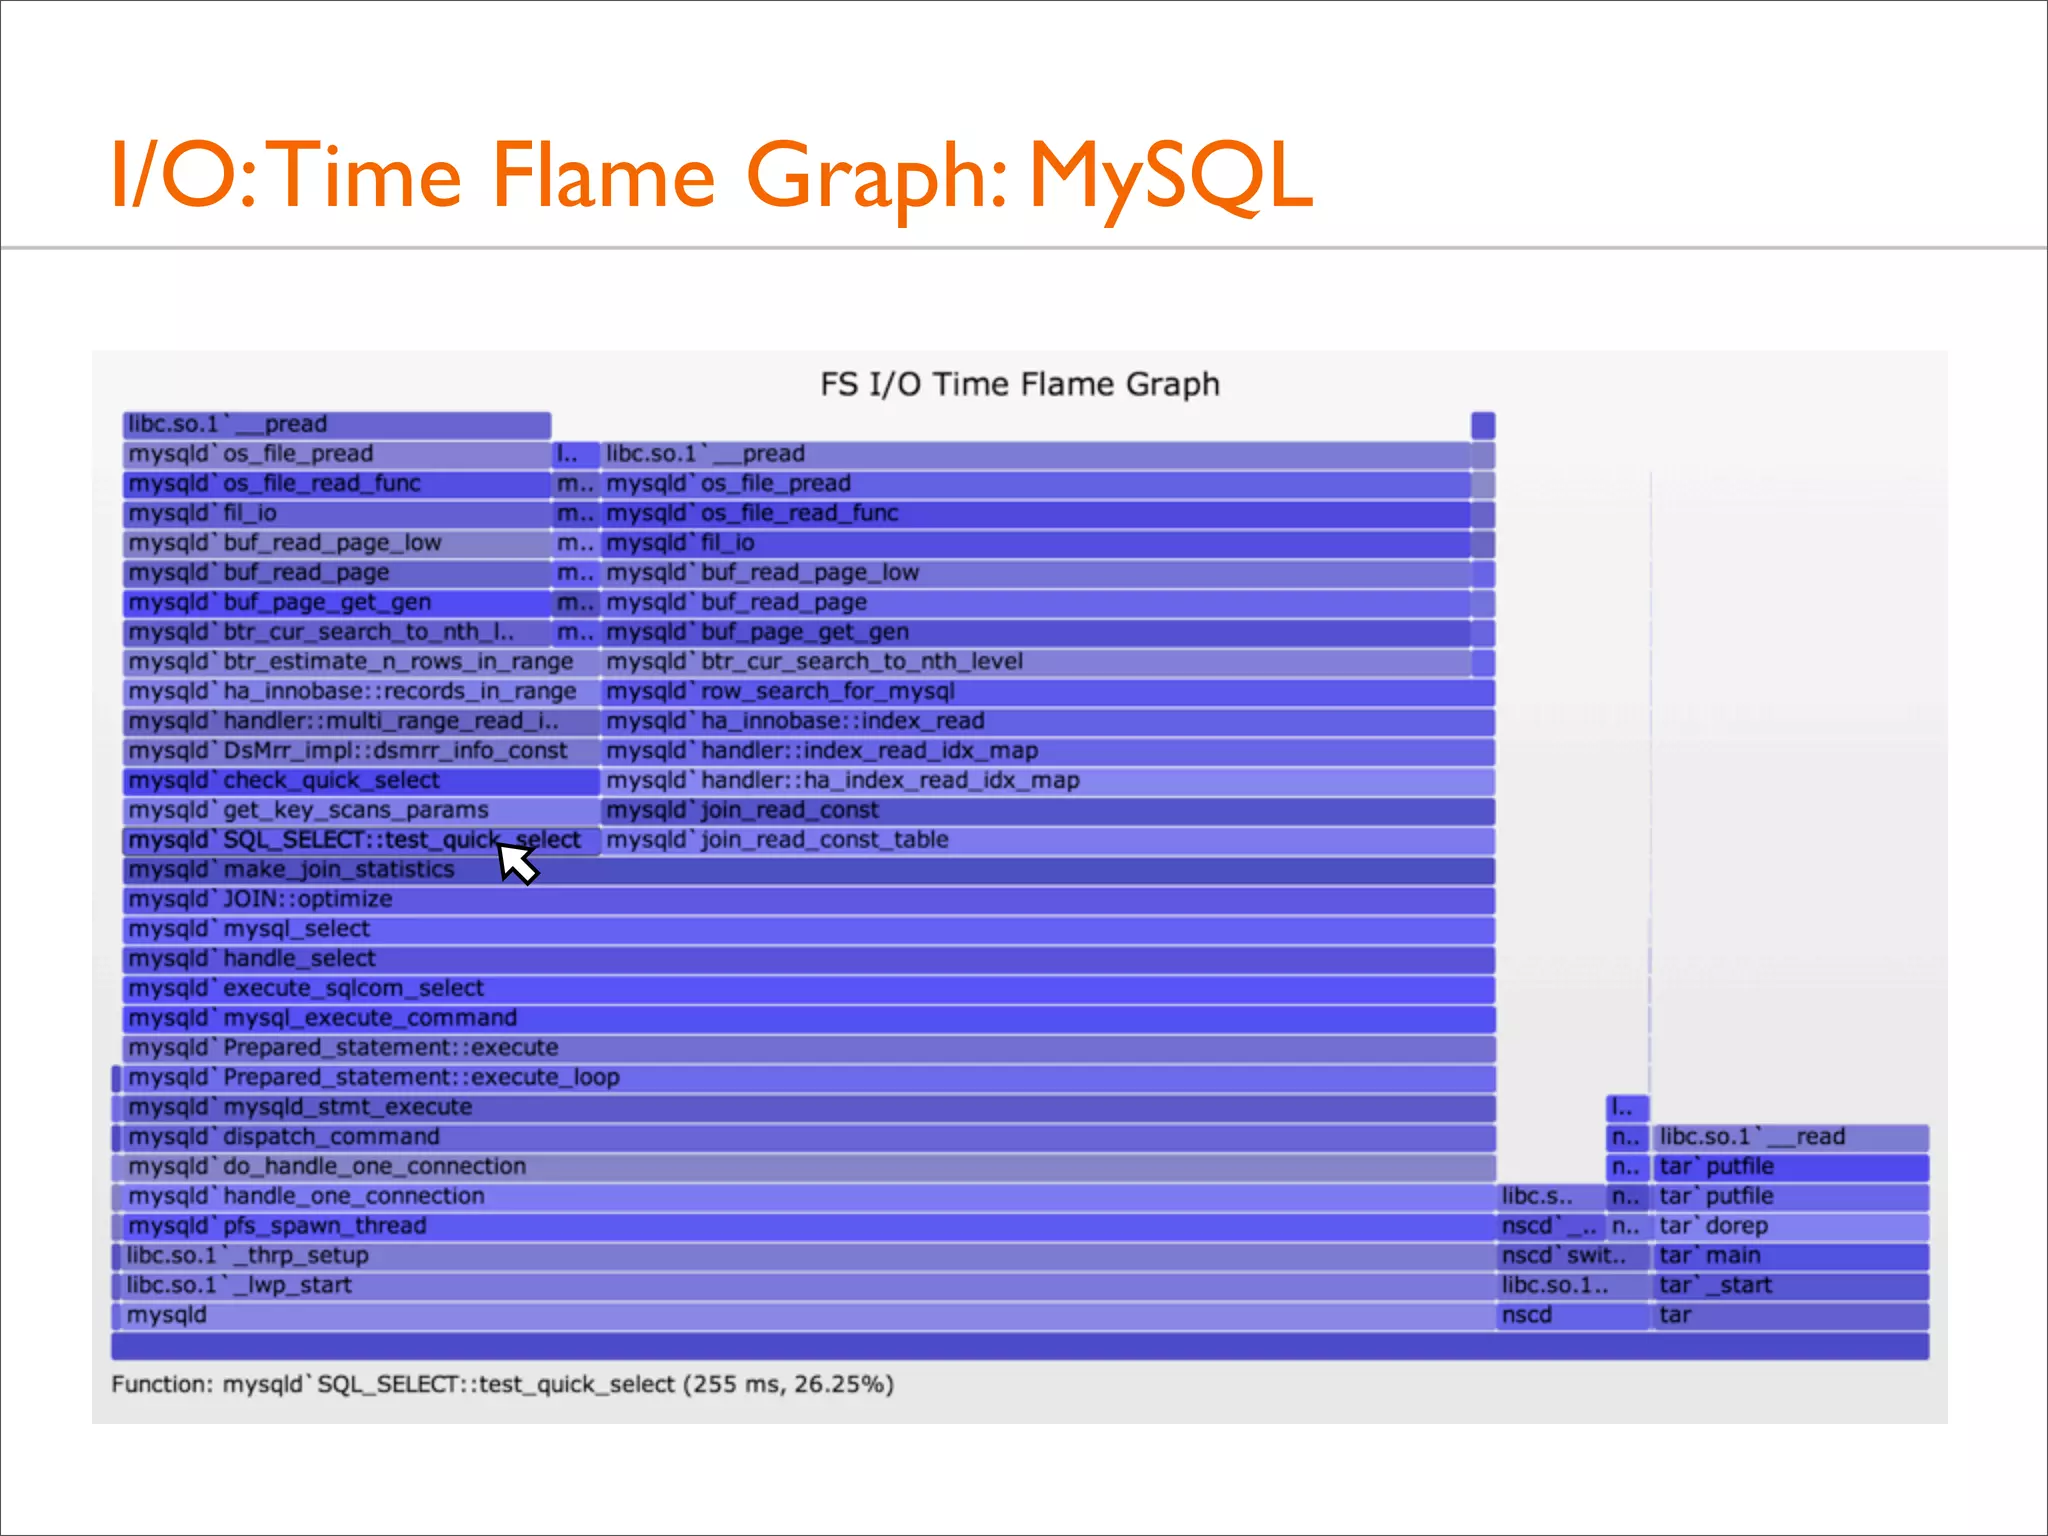
![I/O: Logical I/O Laency
• For example, ZFS call latency using DTrace (zfsustack.d):
#!/usr/sbin/dtrace -s
#pragma D option quiet
#pragma D option ustackframes=100
fbt::zfs_read:entry, fbt::zfs_write:entry,
fbt::zfs_readdir:entry, fbt::zfs_getattr:entry,
fbt::zfs_setattr:entry
{
self->start = timestamp;
}
fbt::zfs_read:return, fbt::zfs_write:return,
fbt::zfs_readdir:return, fbt::zfs_getattr:return,
fbt::zfs_setattr:return
/self->start/
{
this->time = timestamp - self->start;
@[ustack(), execname] = sum(this->time);
self->start = 0;
}
dtrace:::END
{
printa("%k%sn%@dn", @);
}
Timestamp from
function start (entry)
... to function end (return)](https://image.slidesharecdn.com/lisa13flamegraphs-131107112122-phpapp01/75/Blazing-Performance-with-Flame-Graphs-116-2048.jpg)

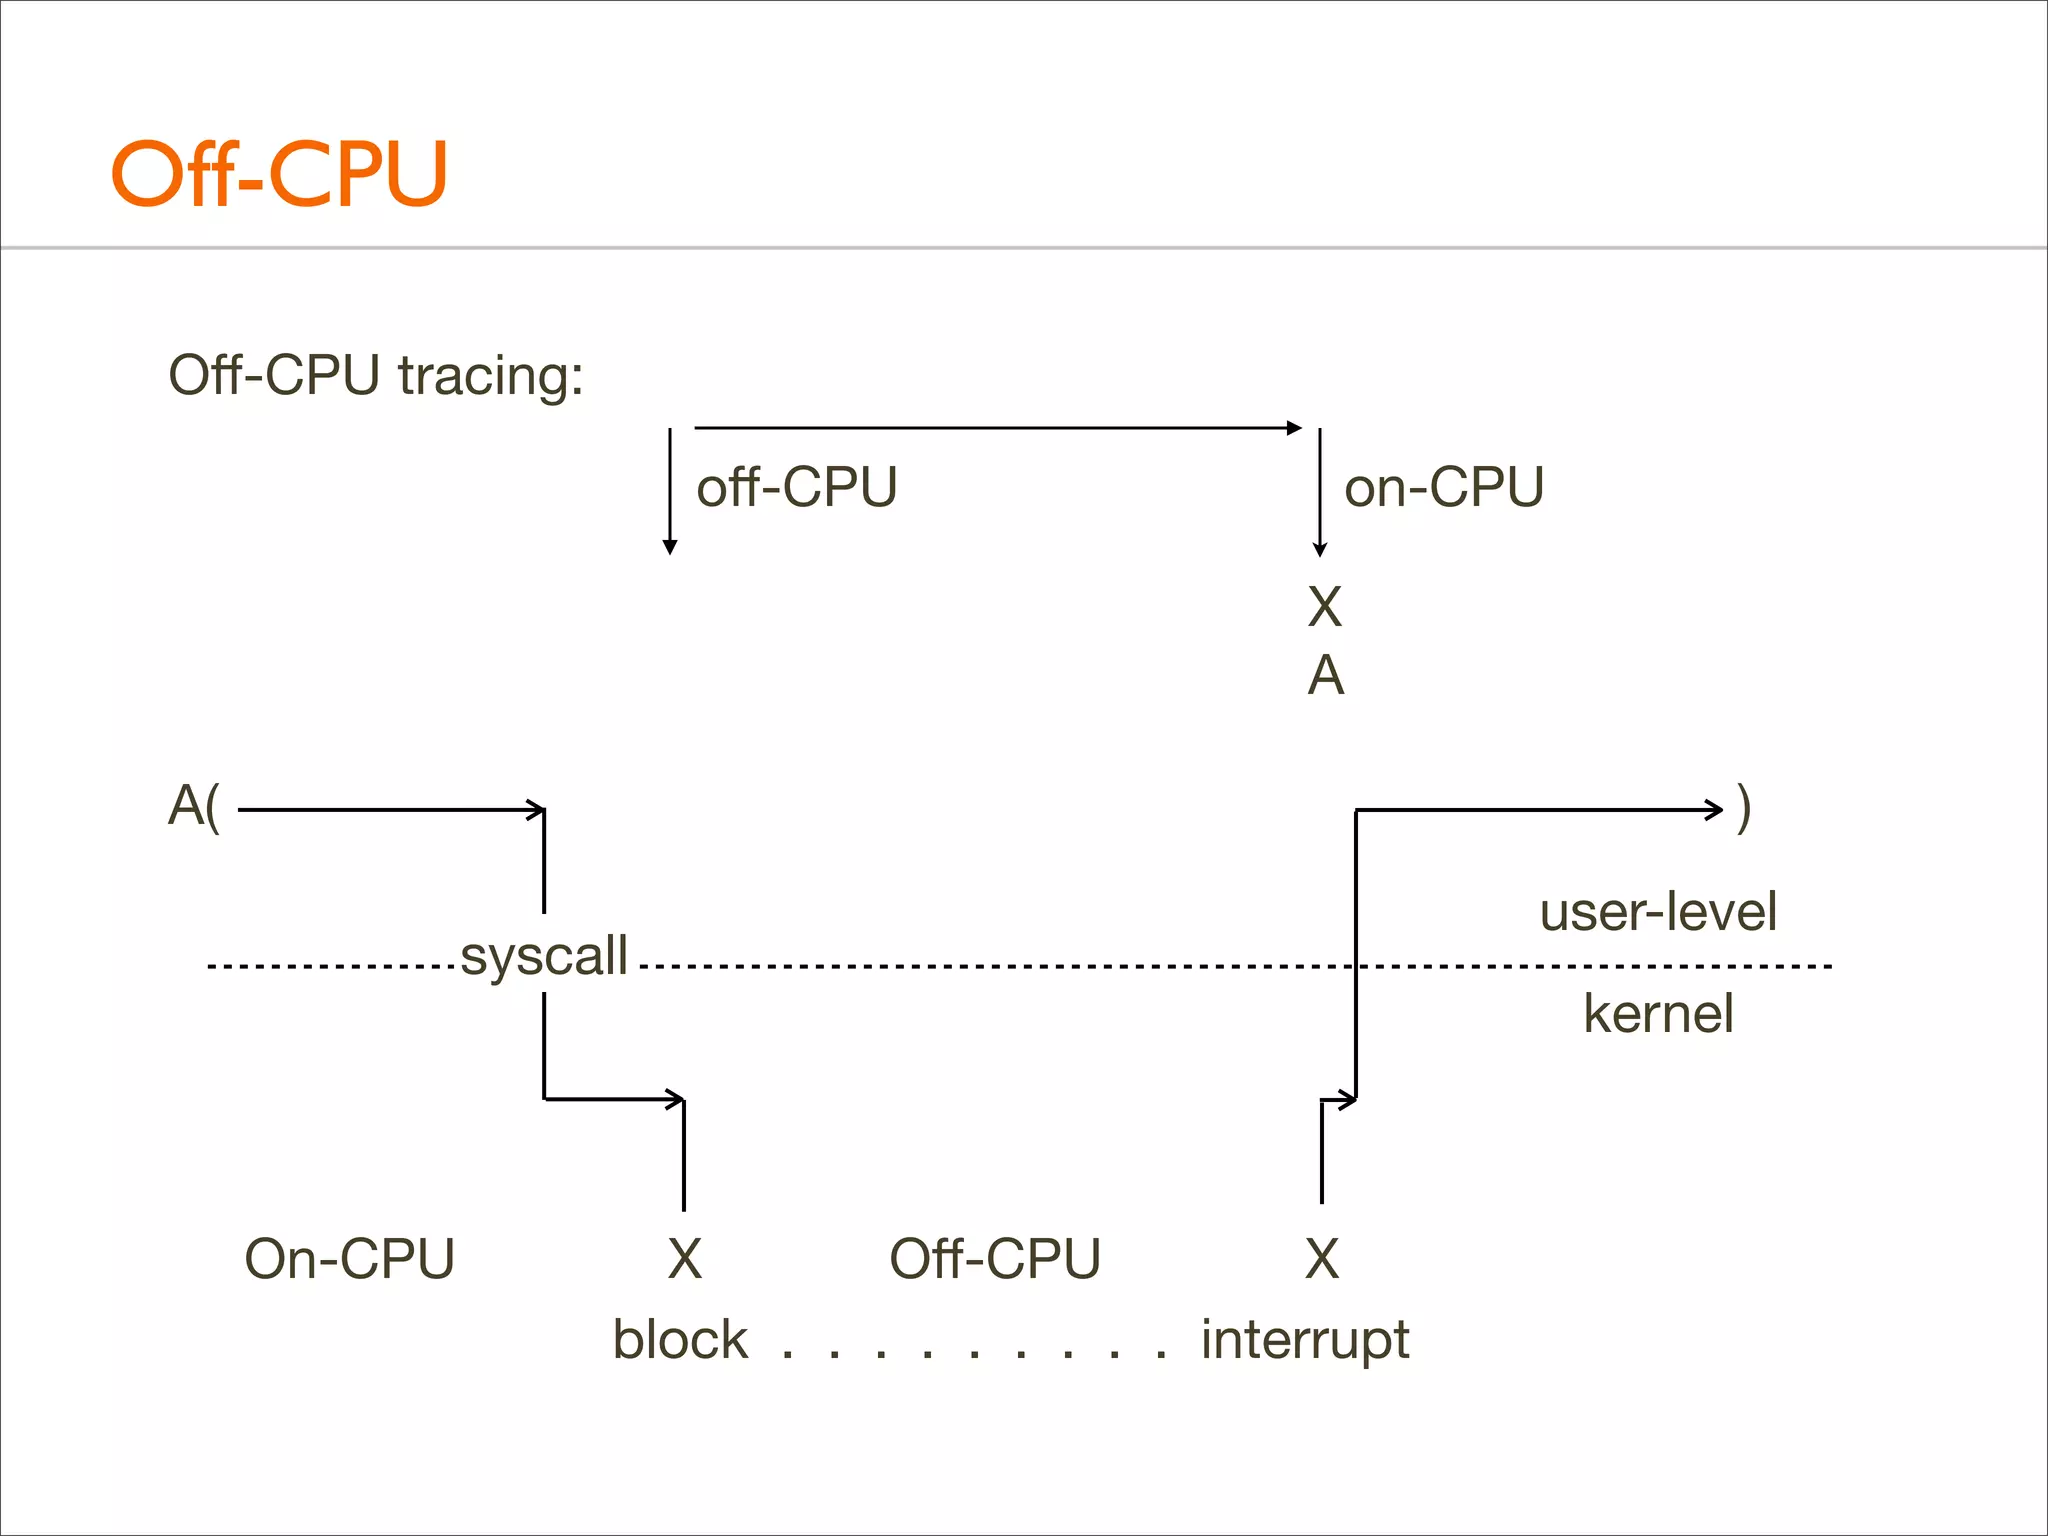
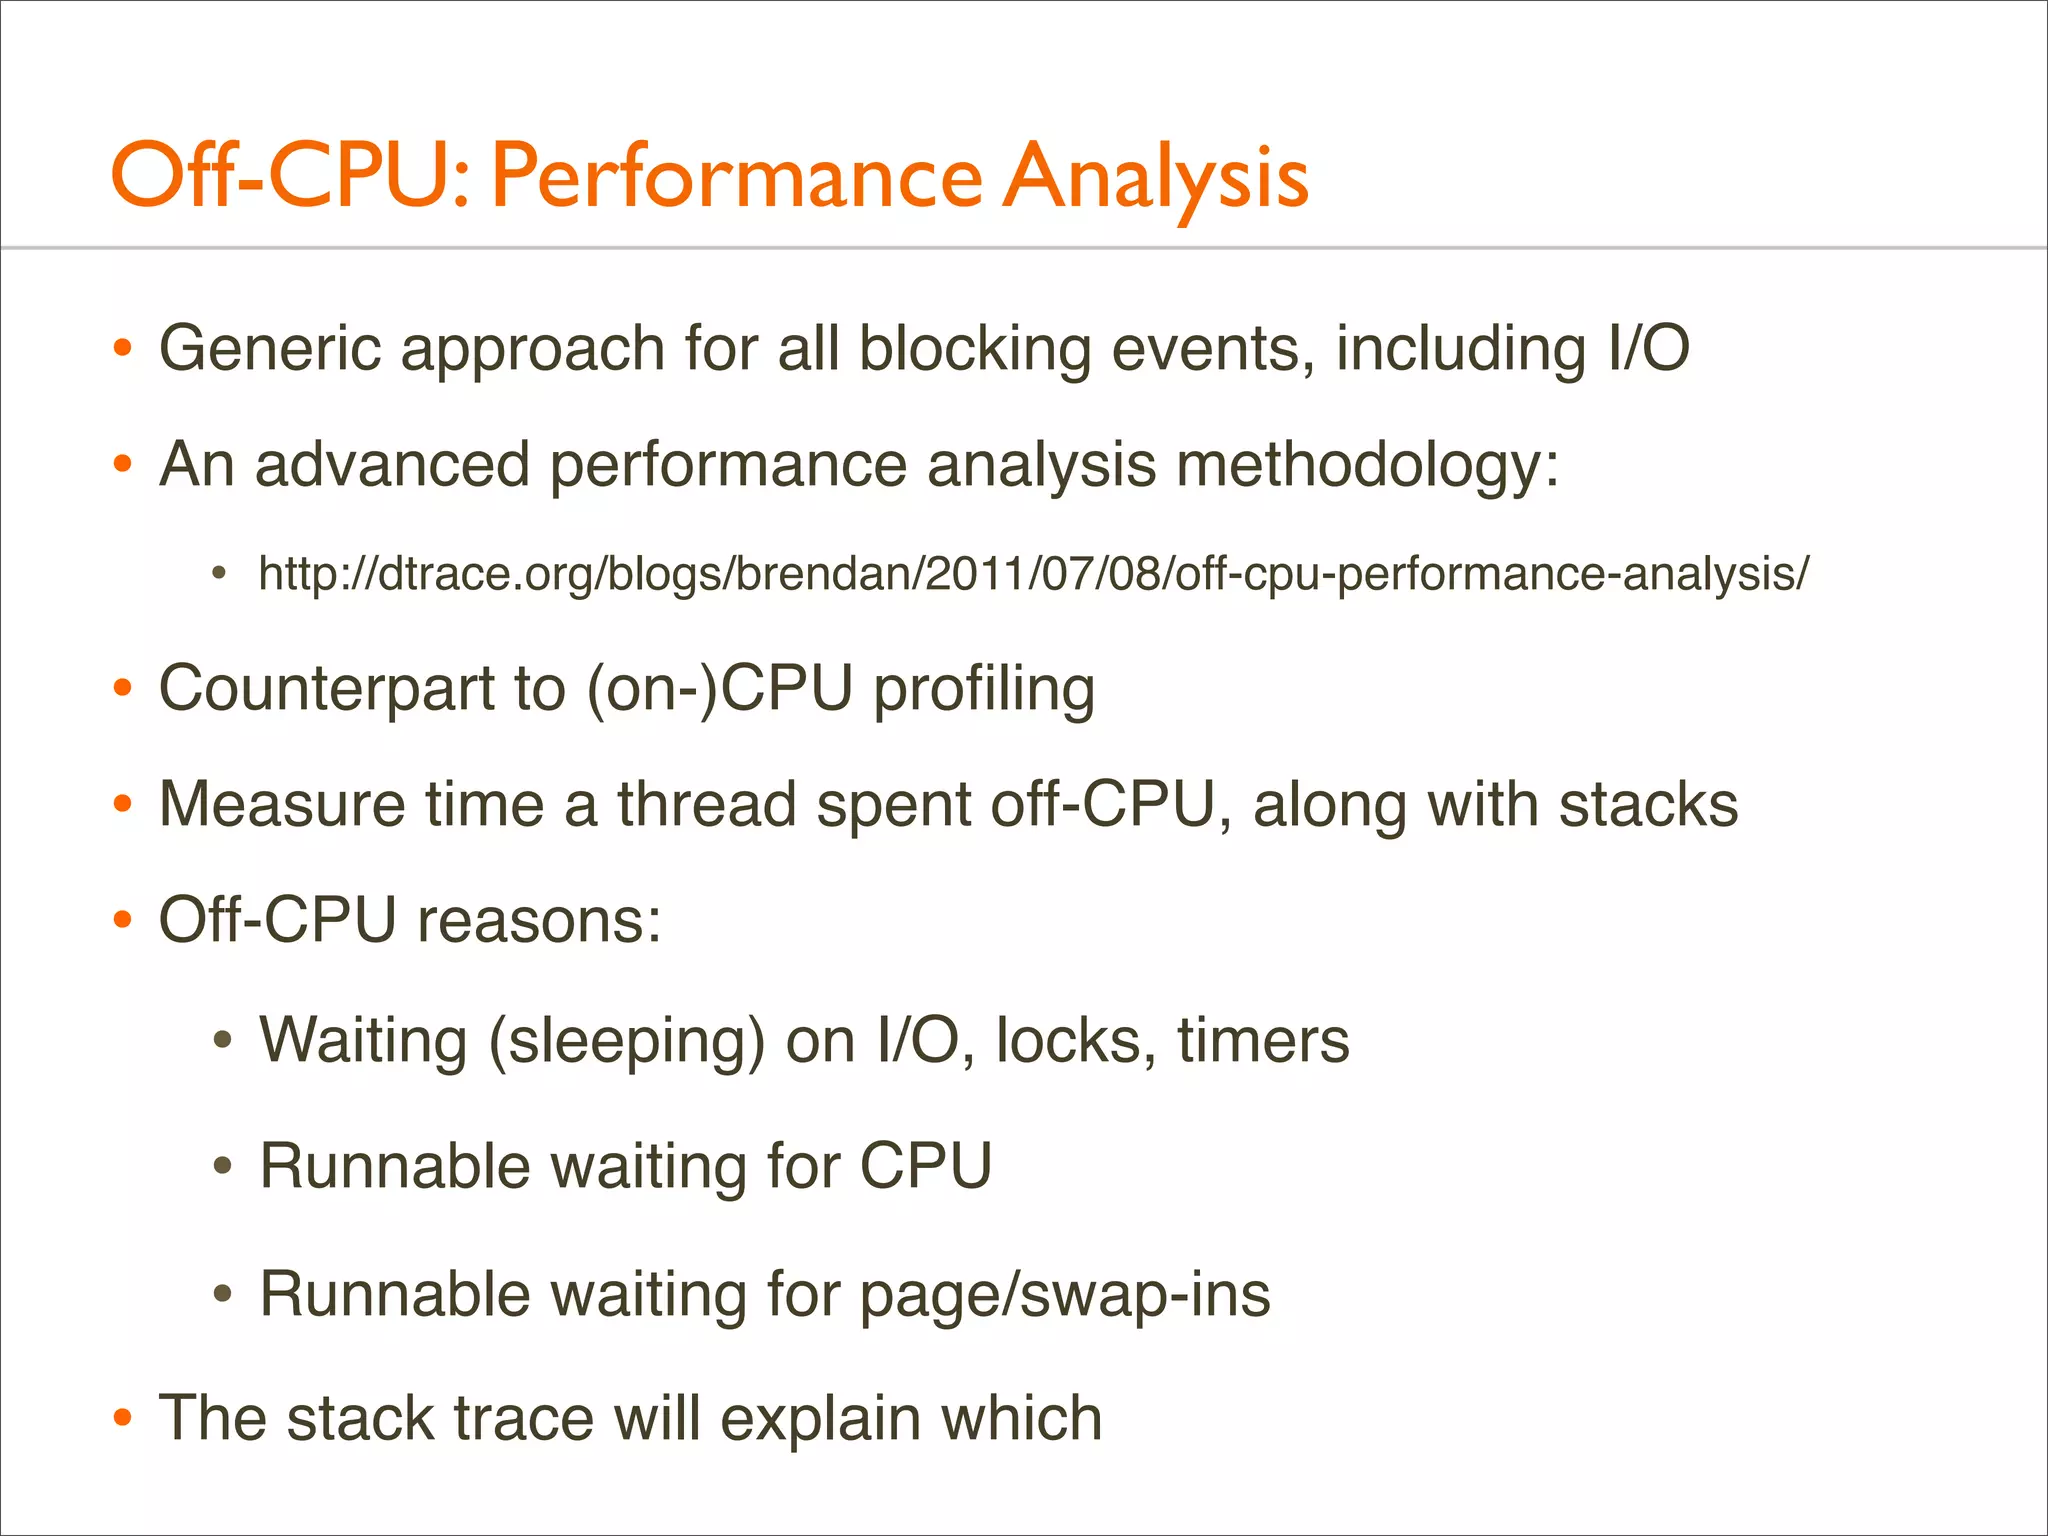
![Off-CPU: Profiling
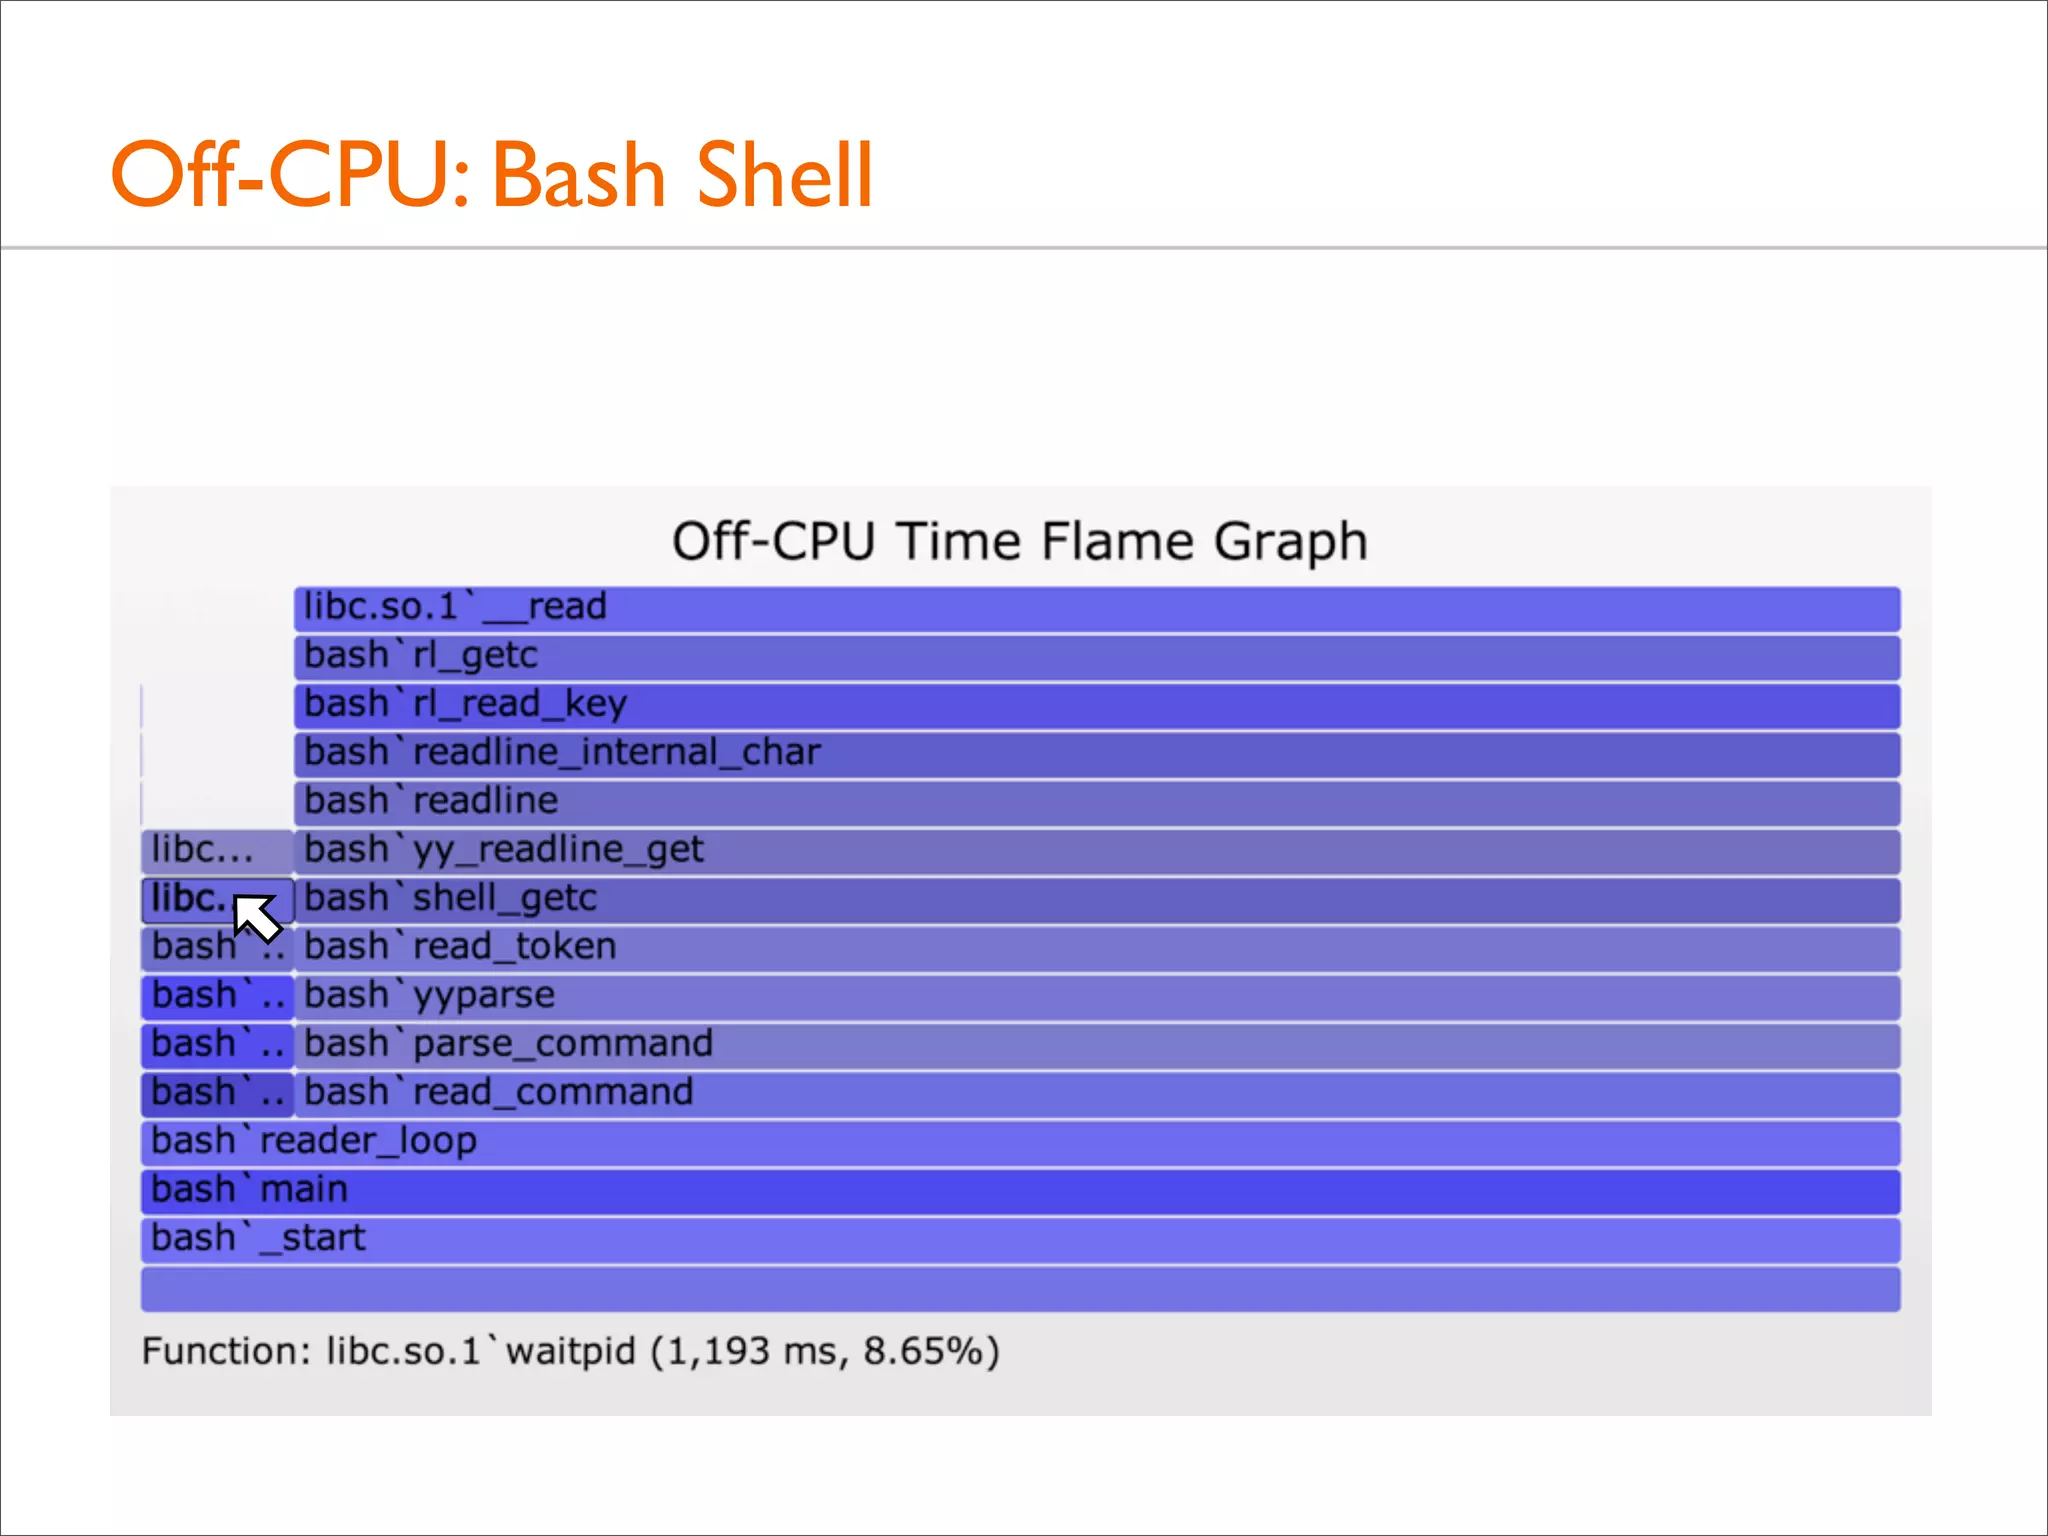
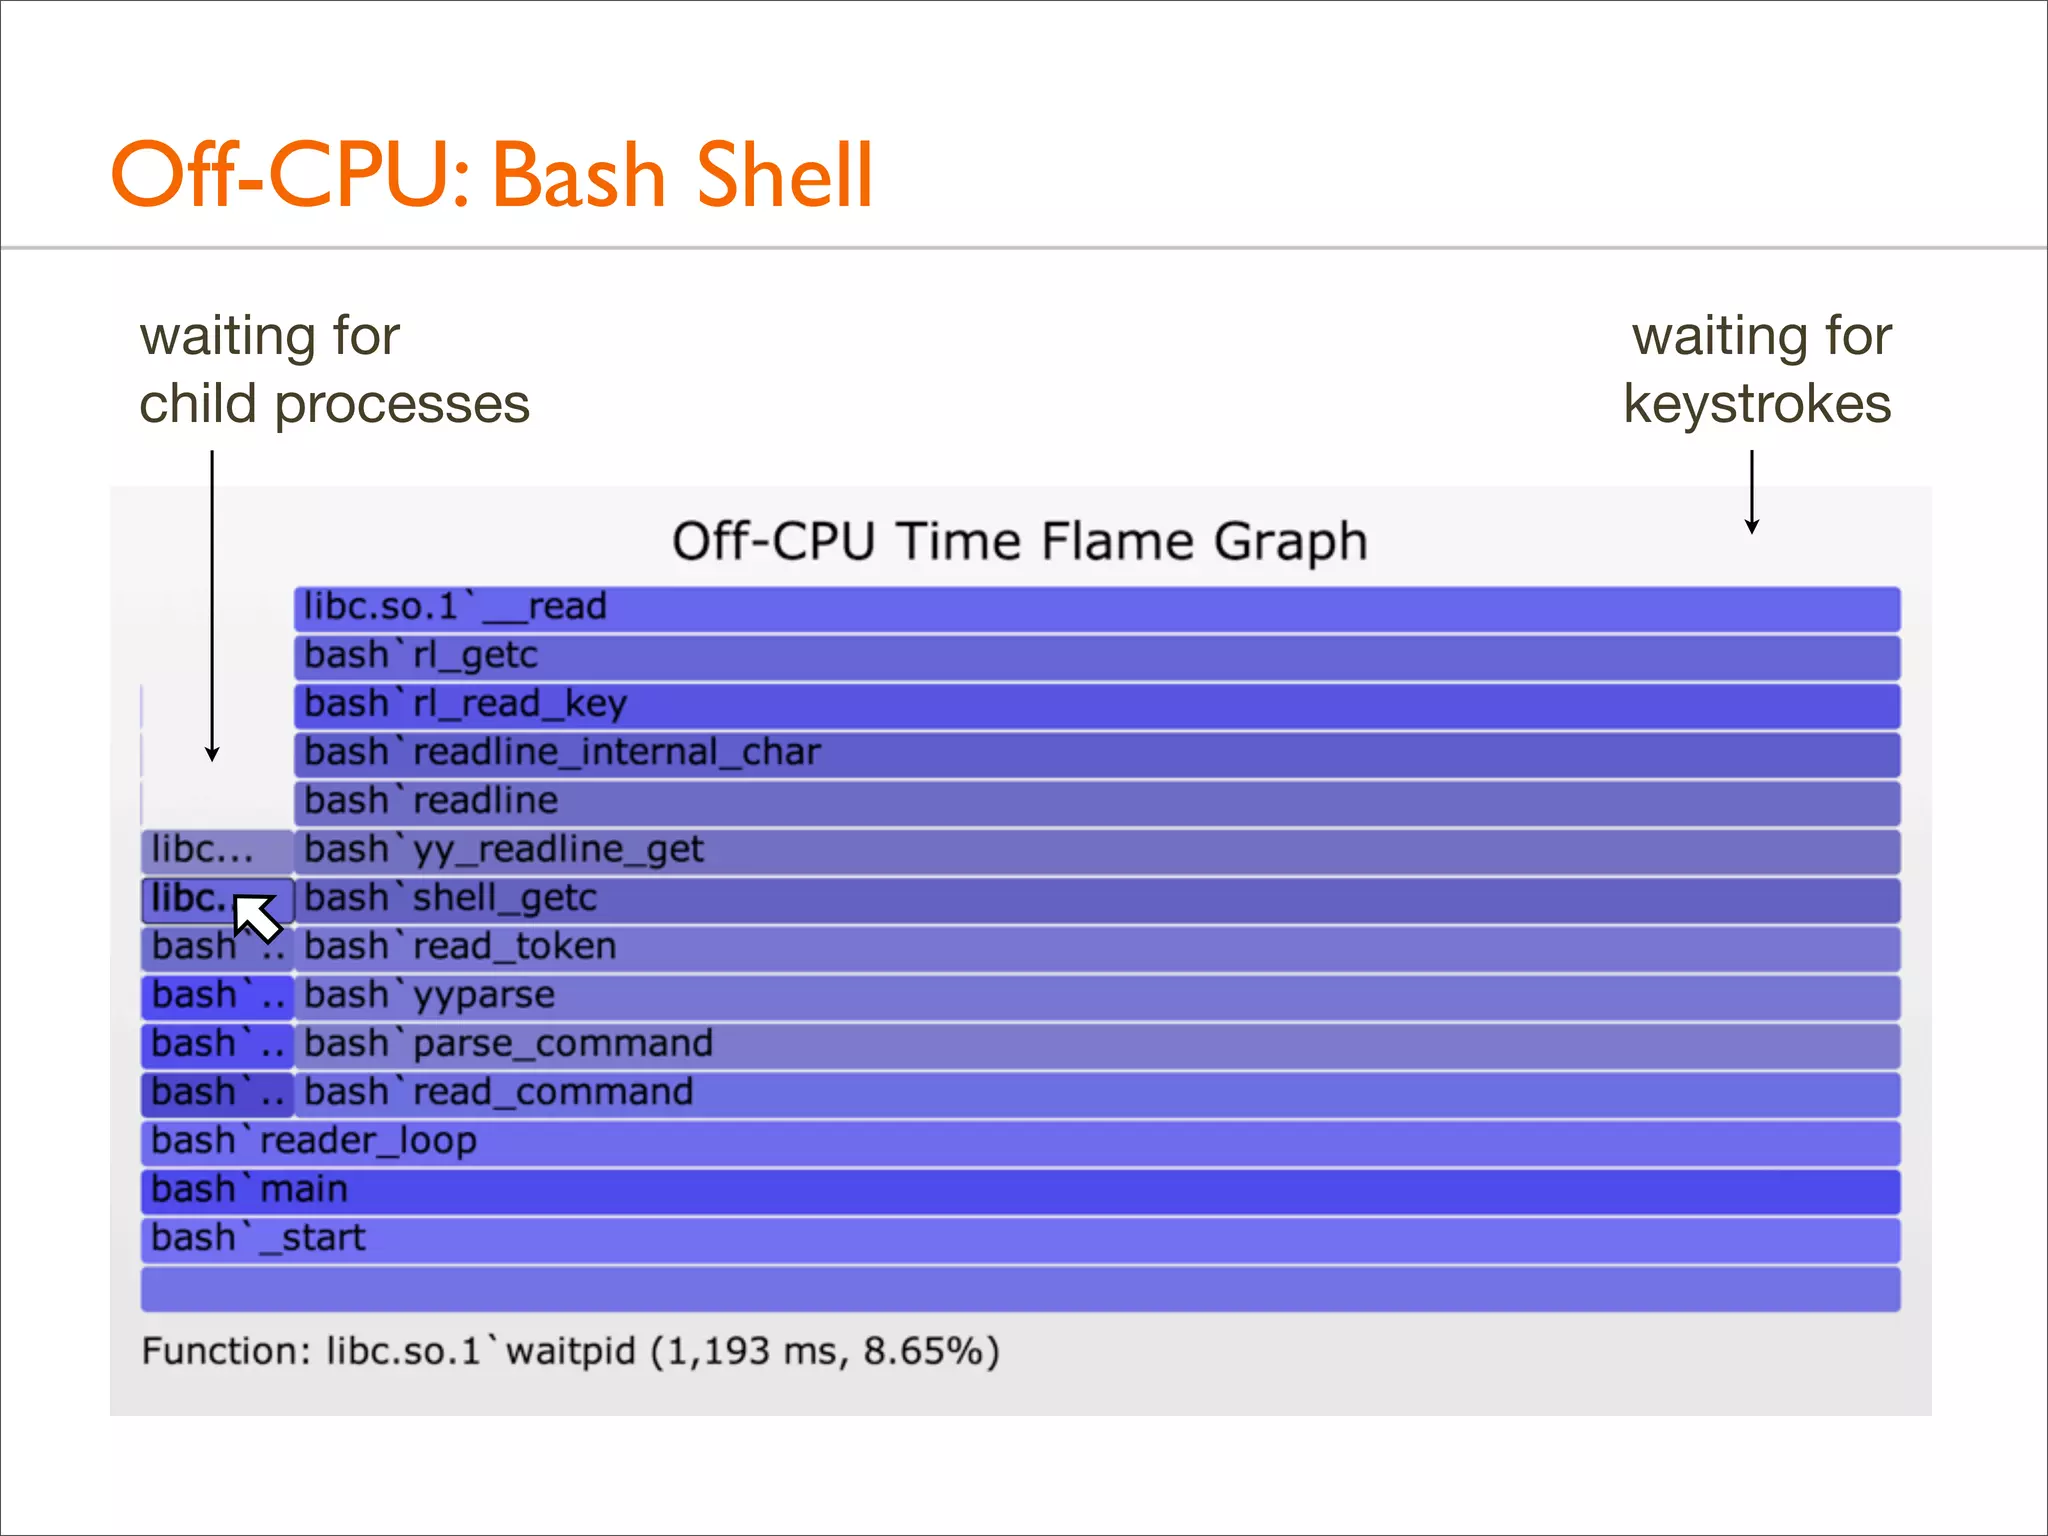
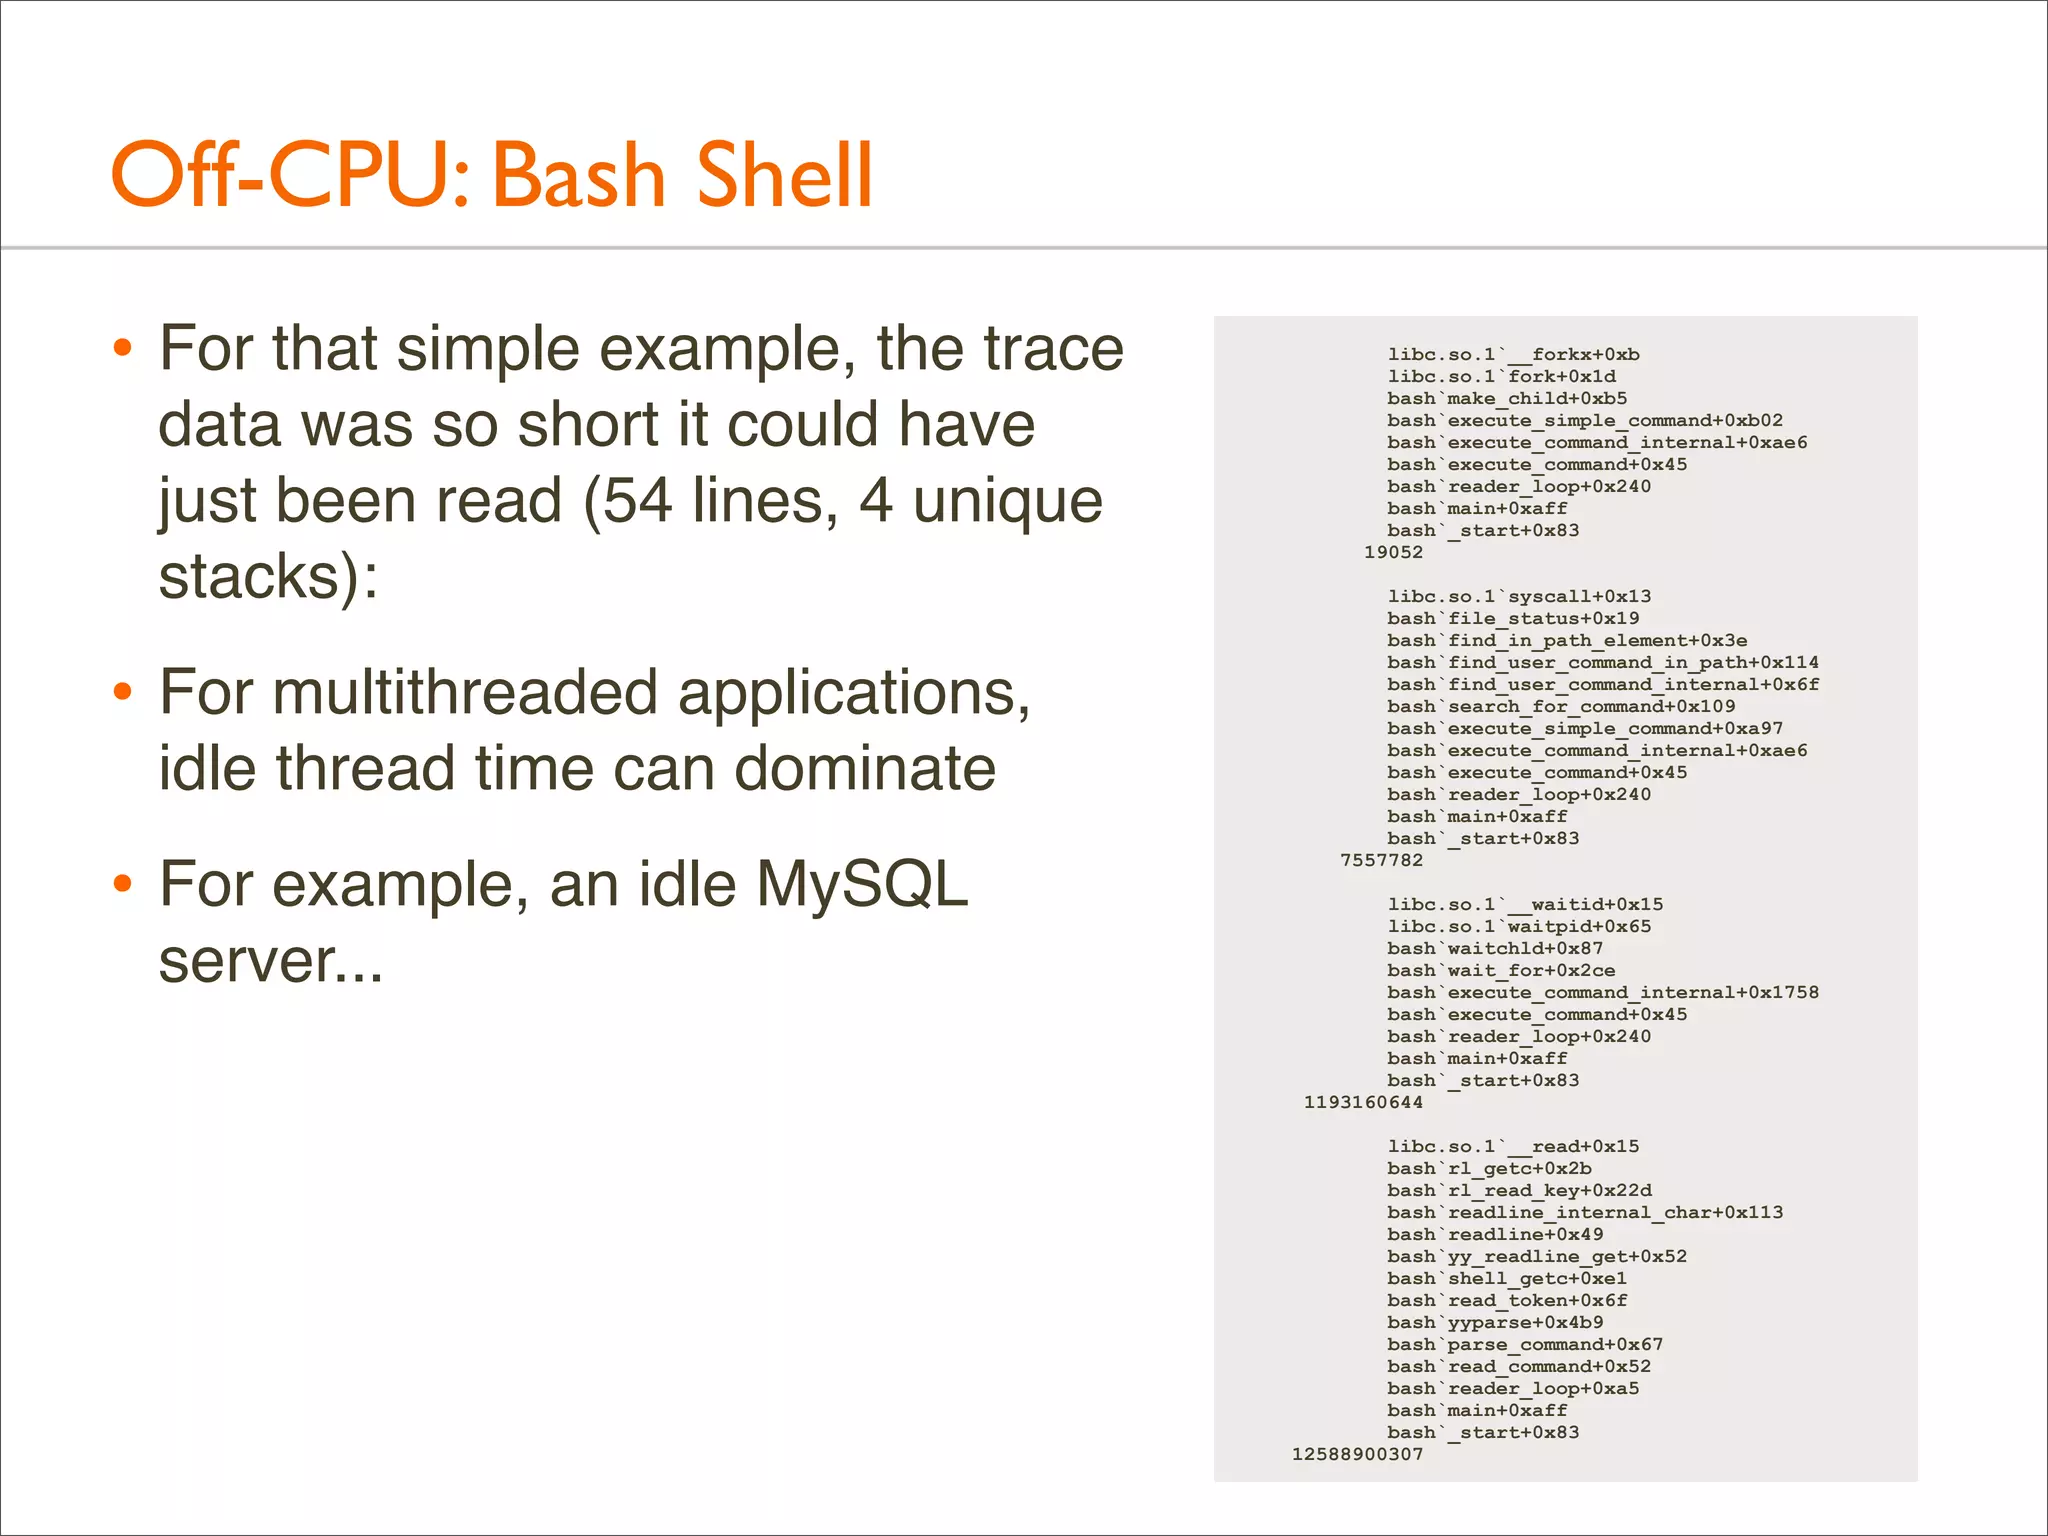
• Example of off-CPU profiling for the bash shell:
# dtrace -x ustackframes=100 -n '
sched:::off-cpu /execname == "bash"/ { self->ts = timestamp; }
sched:::on-cpu /self->ts/ {
@[ustack()] = sum(timestamp - self->ts); self->ts = 0; }
tick-30s { exit(0); }' -o out.offcpu
• Traces time from when a thread switches off-CPU to when it
returns on-CPU, with user-level stacks. ie, time blocked or
sleeping
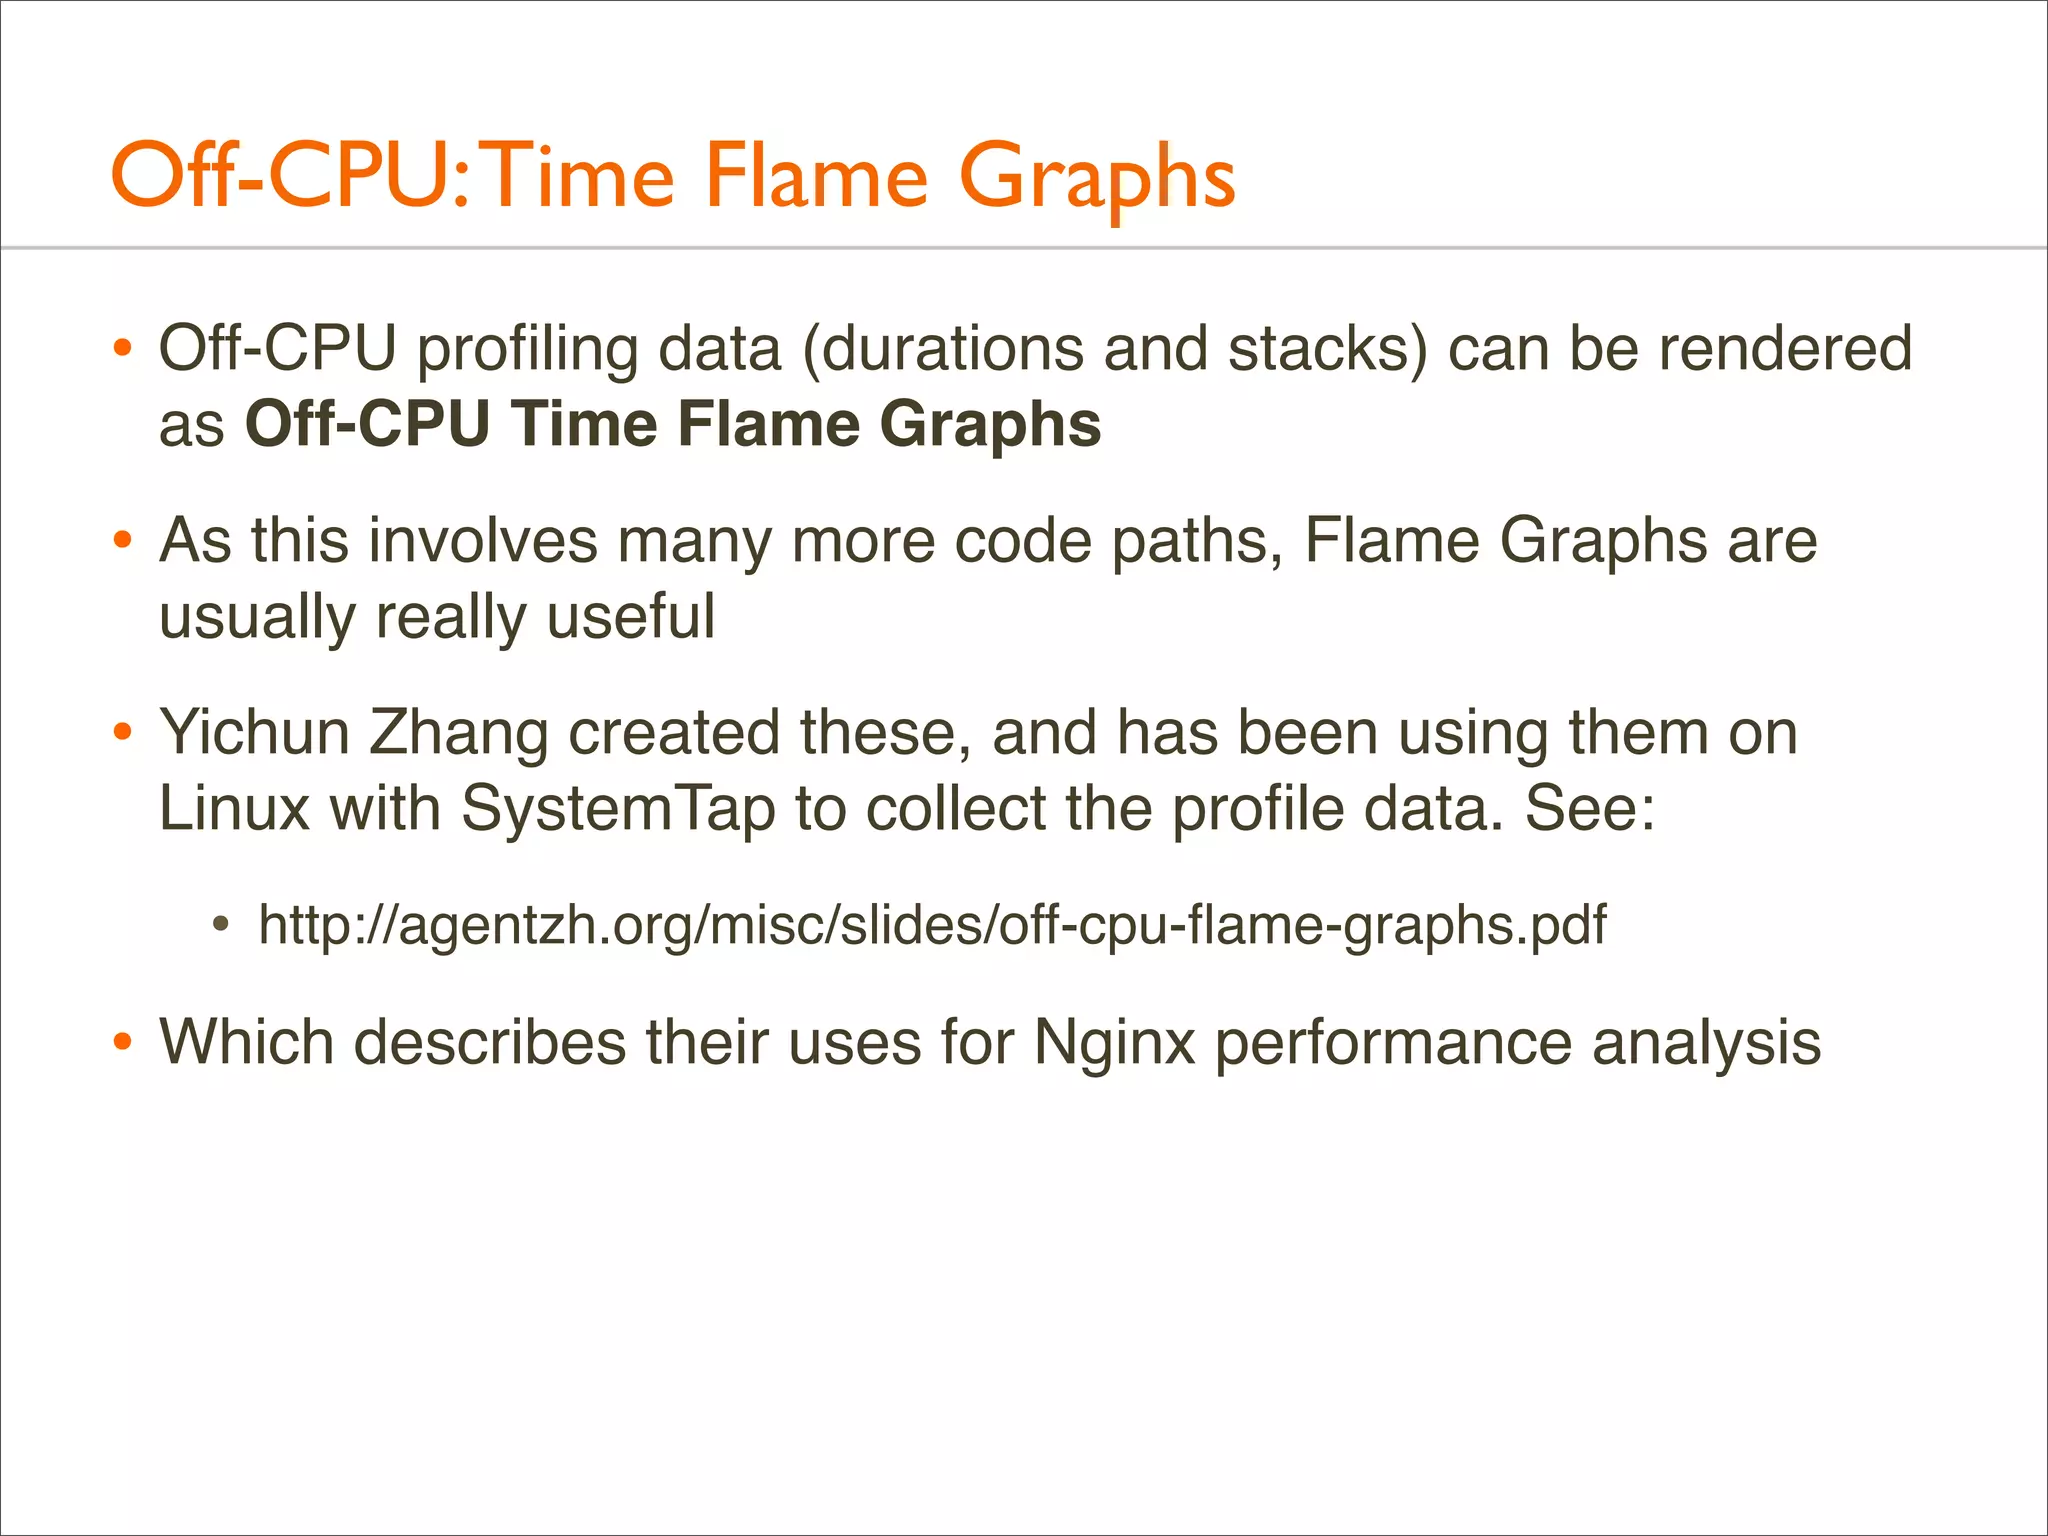
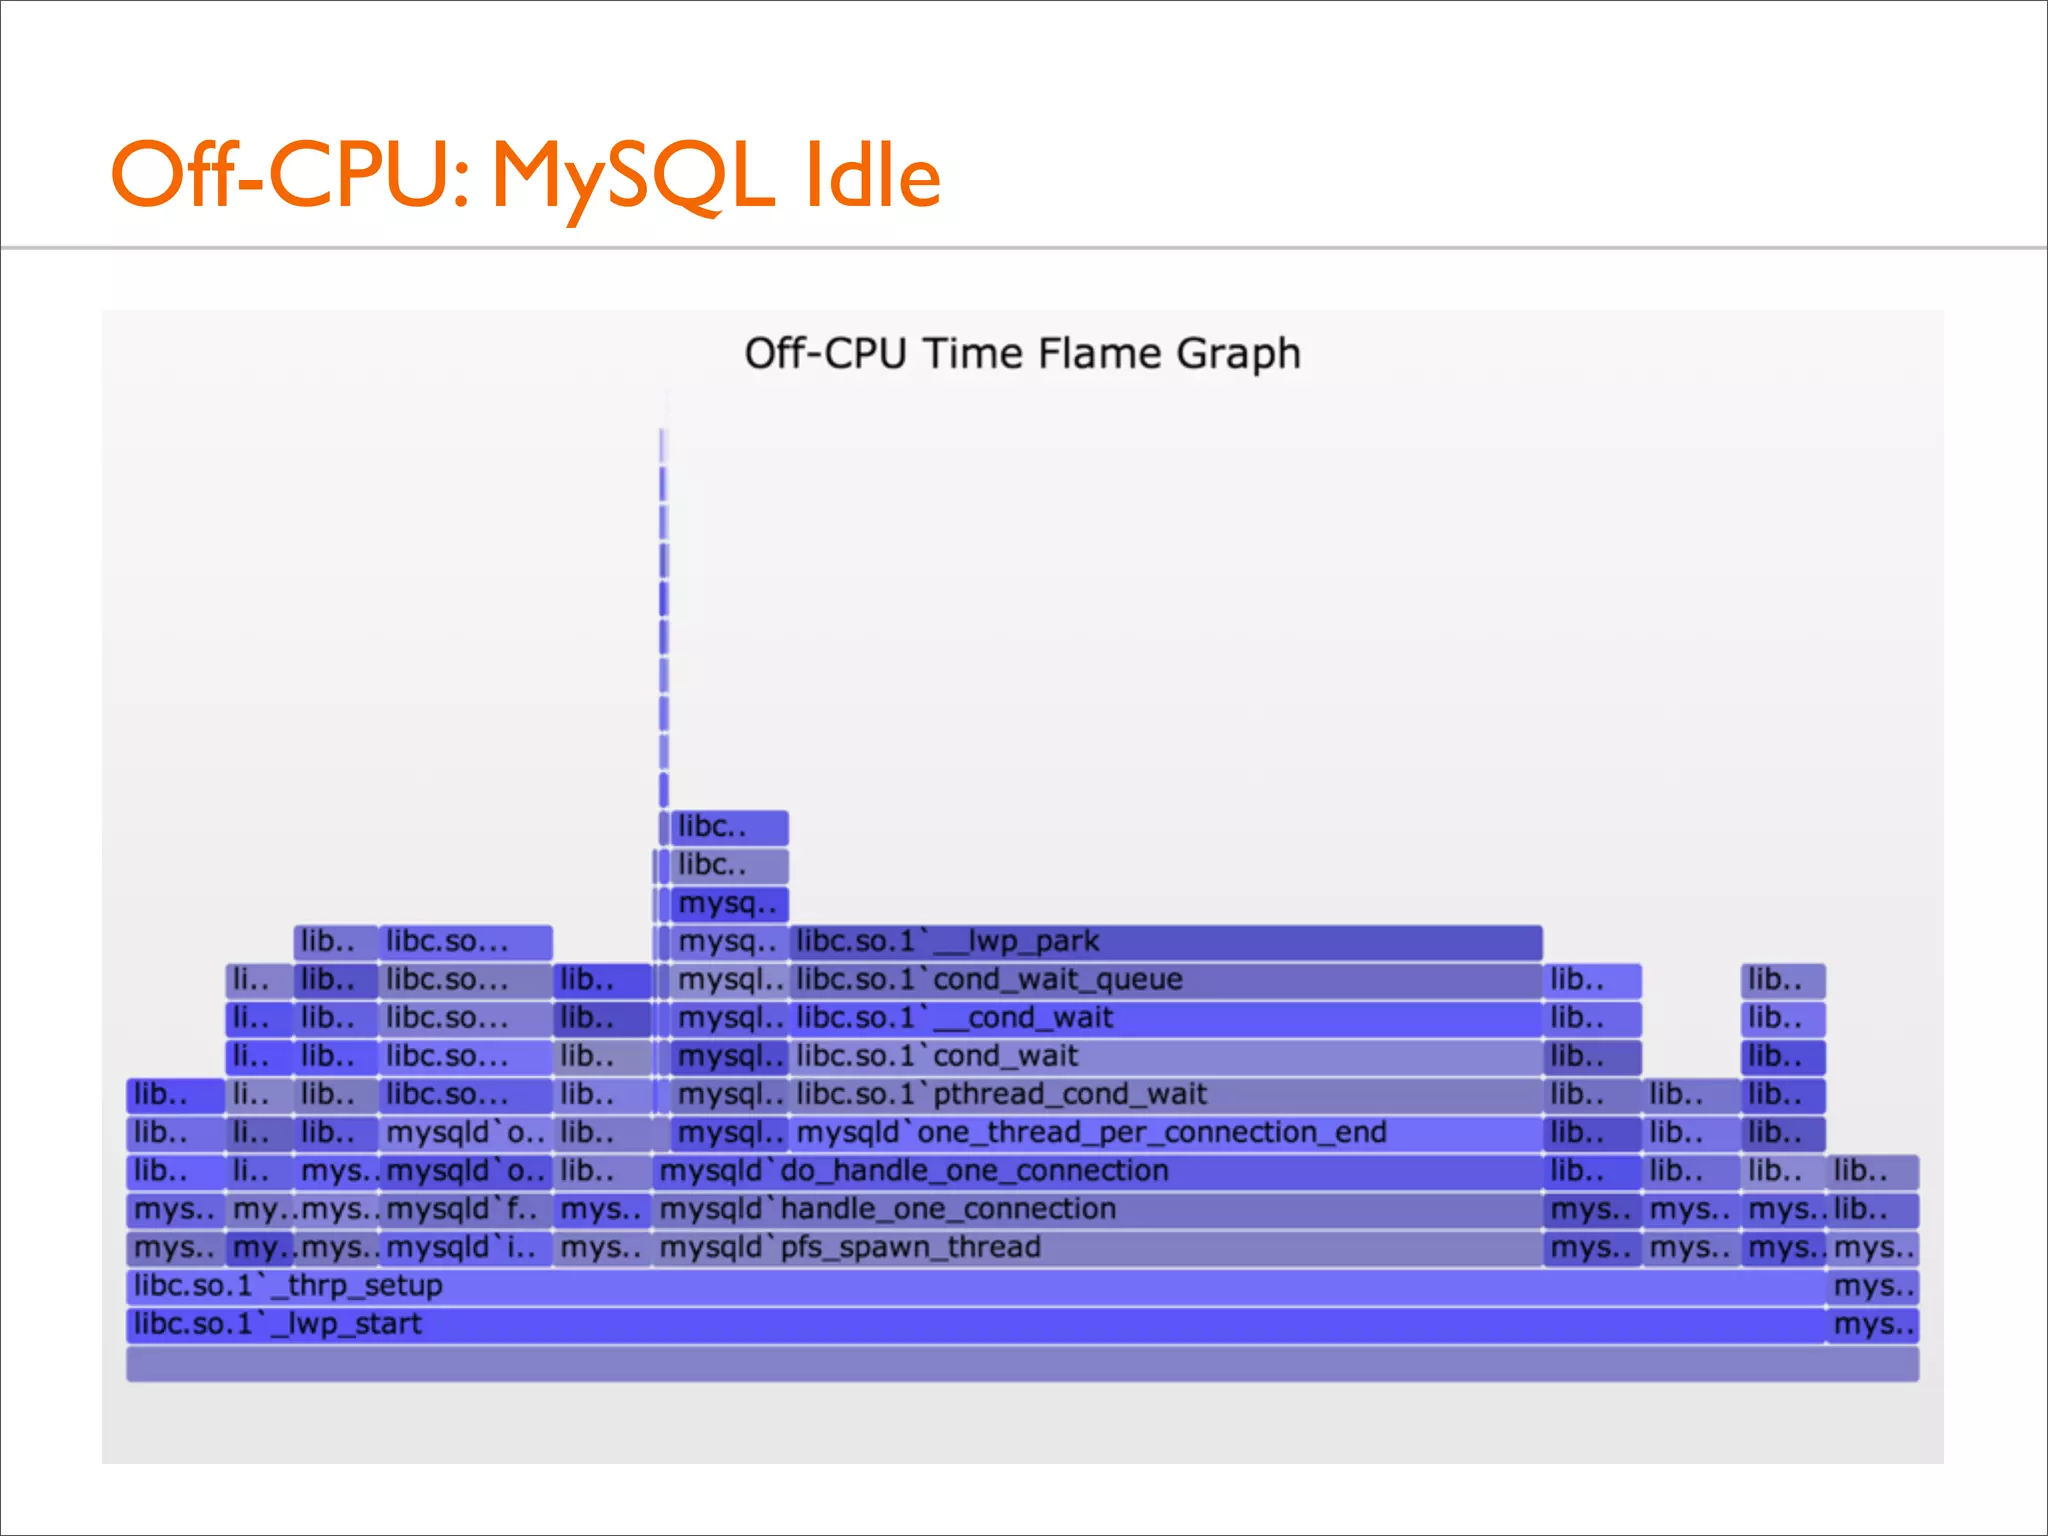
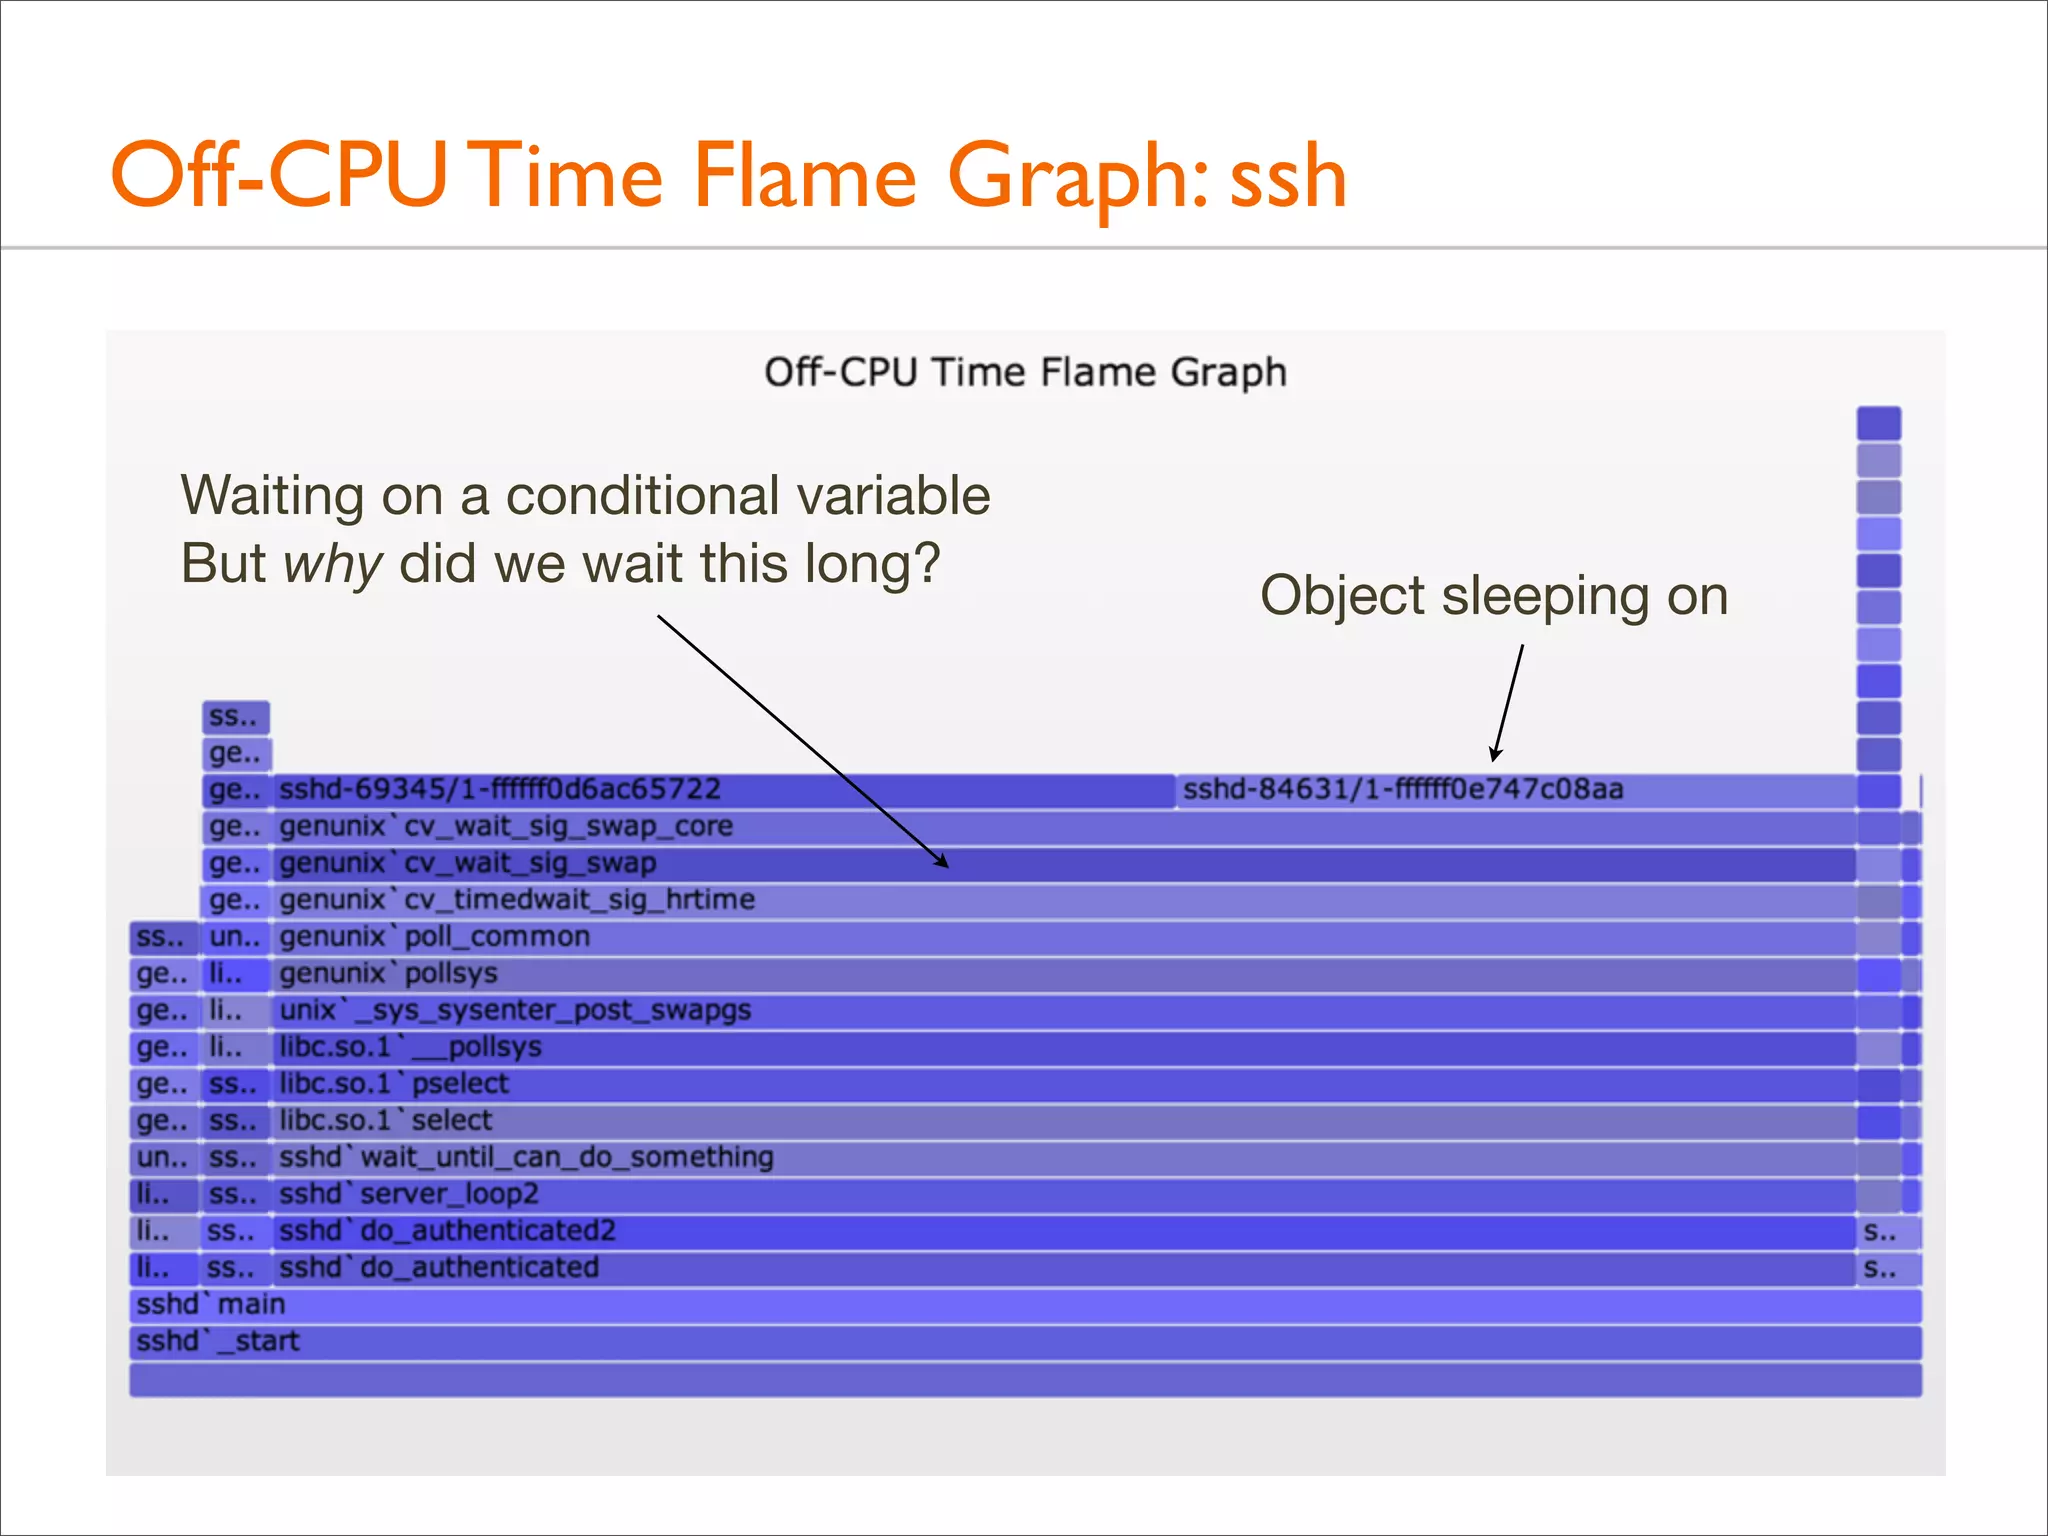
• Off-CPU Time Flame Graph:
# stackcollapse.pl < out.offcpu | awk '{ print $1, $2 / 1000000 }' |
flamegraph.pl --title="Off-CPU Time Flame Graph" --color=io
--countname=ms --width=600 > out.offcpu.svg
• This uses awk to convert nanoseconds into milliseconds](https://image.slidesharecdn.com/lisa13flamegraphs-131107112122-phpapp01/75/Blazing-Performance-with-Flame-Graphs-125-2048.jpg)
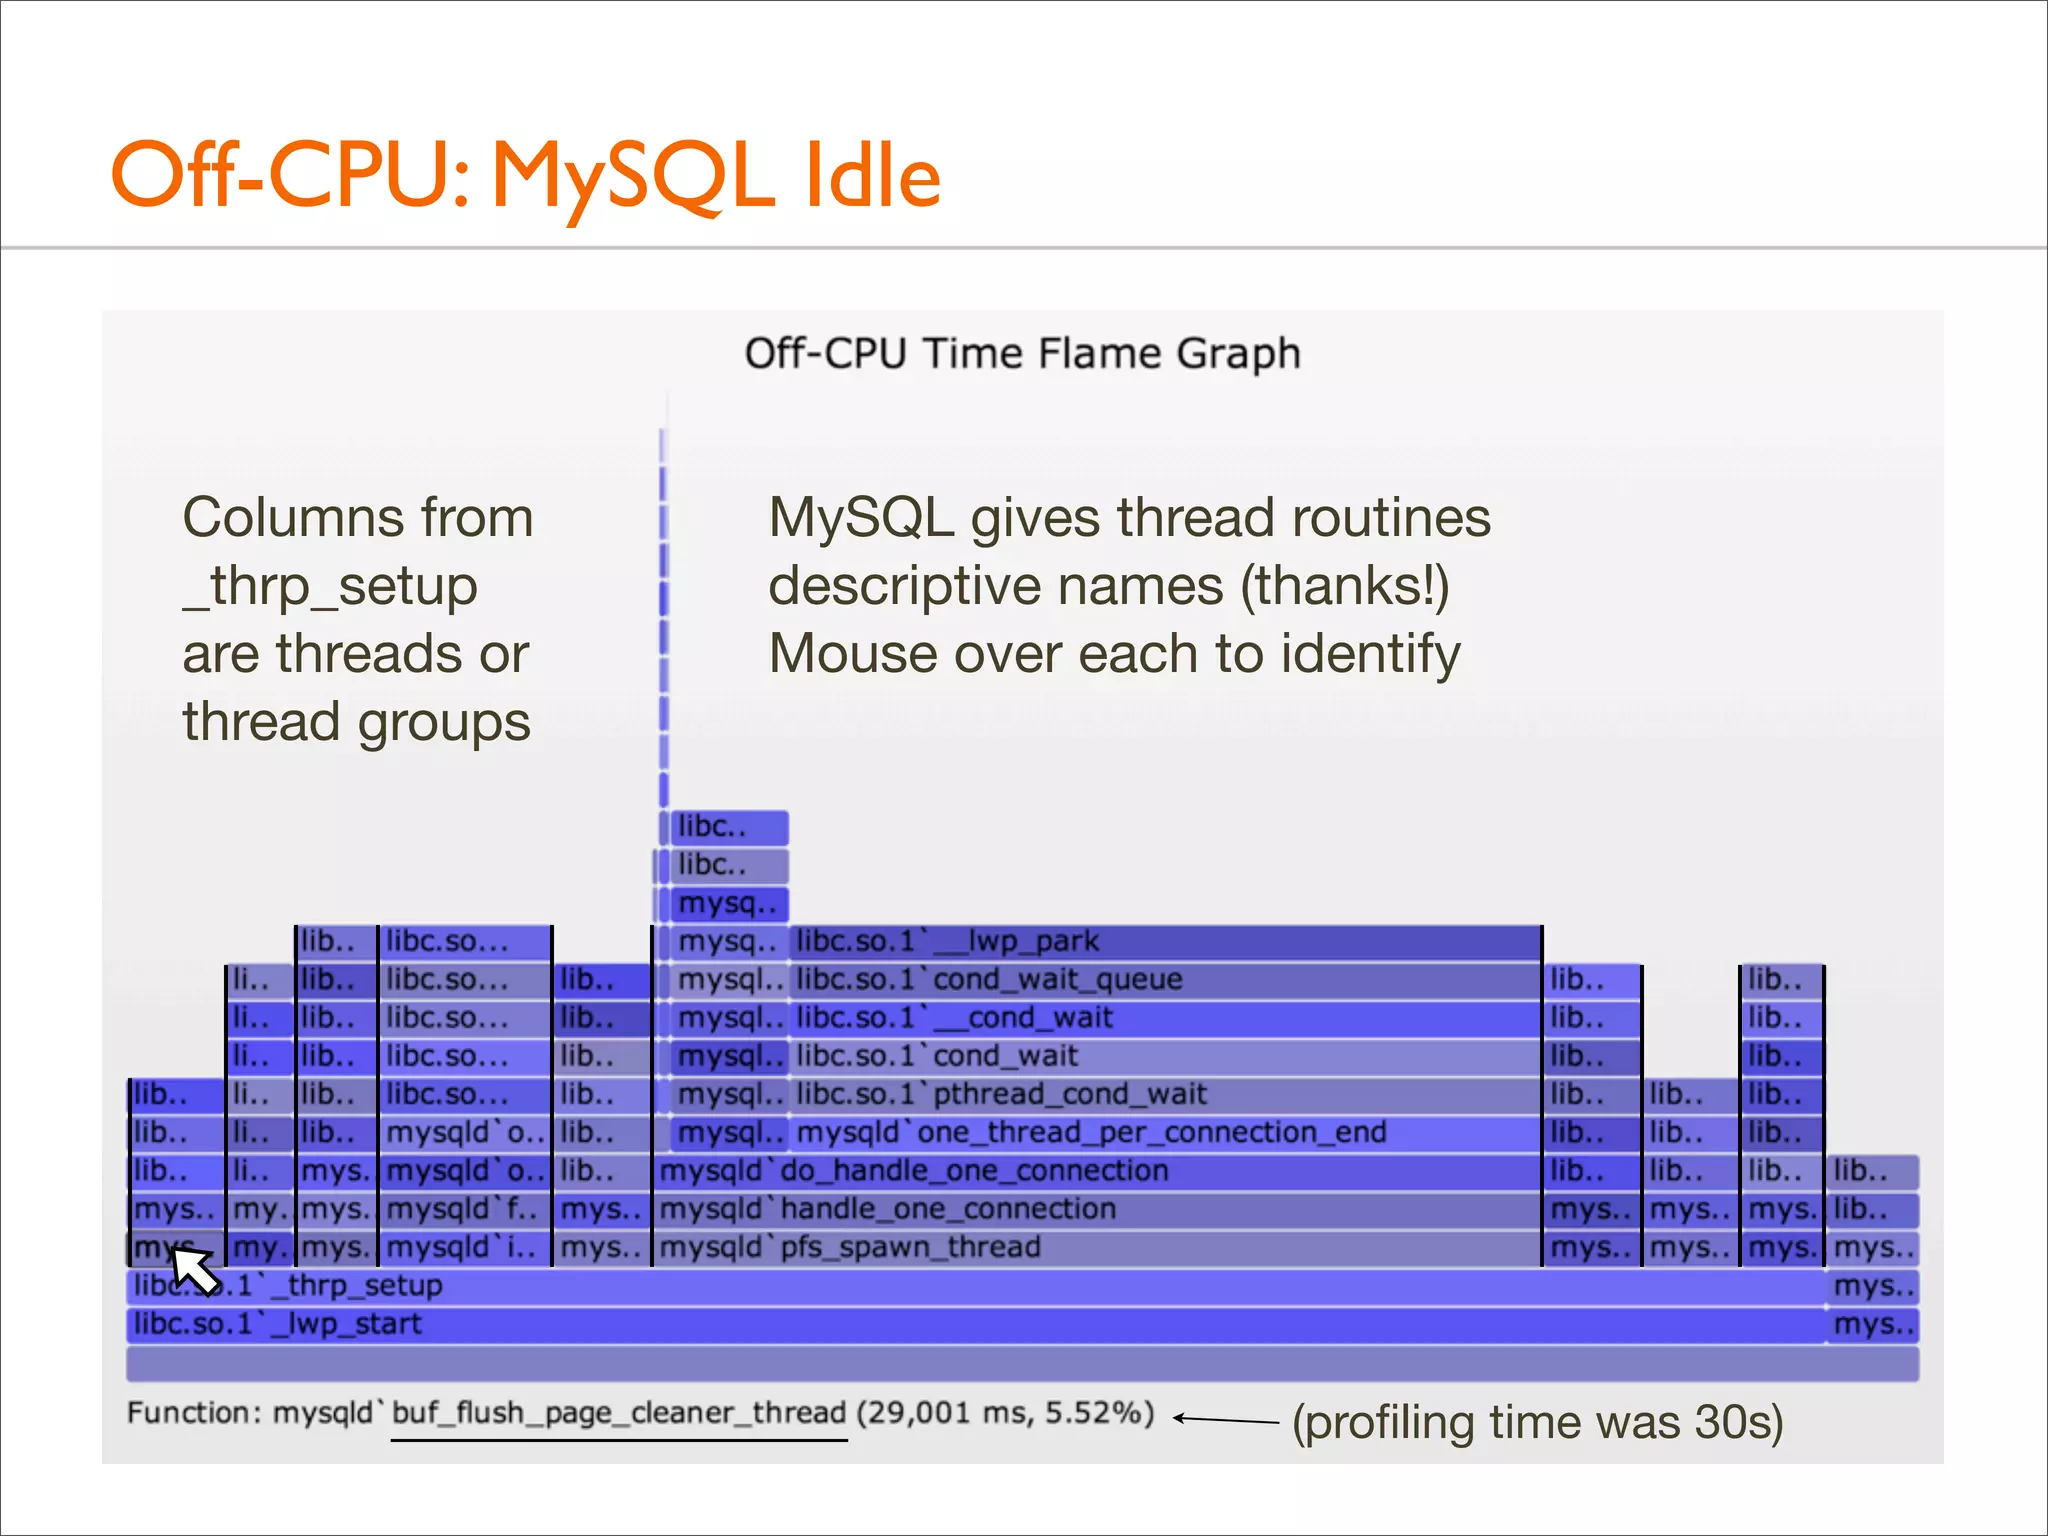
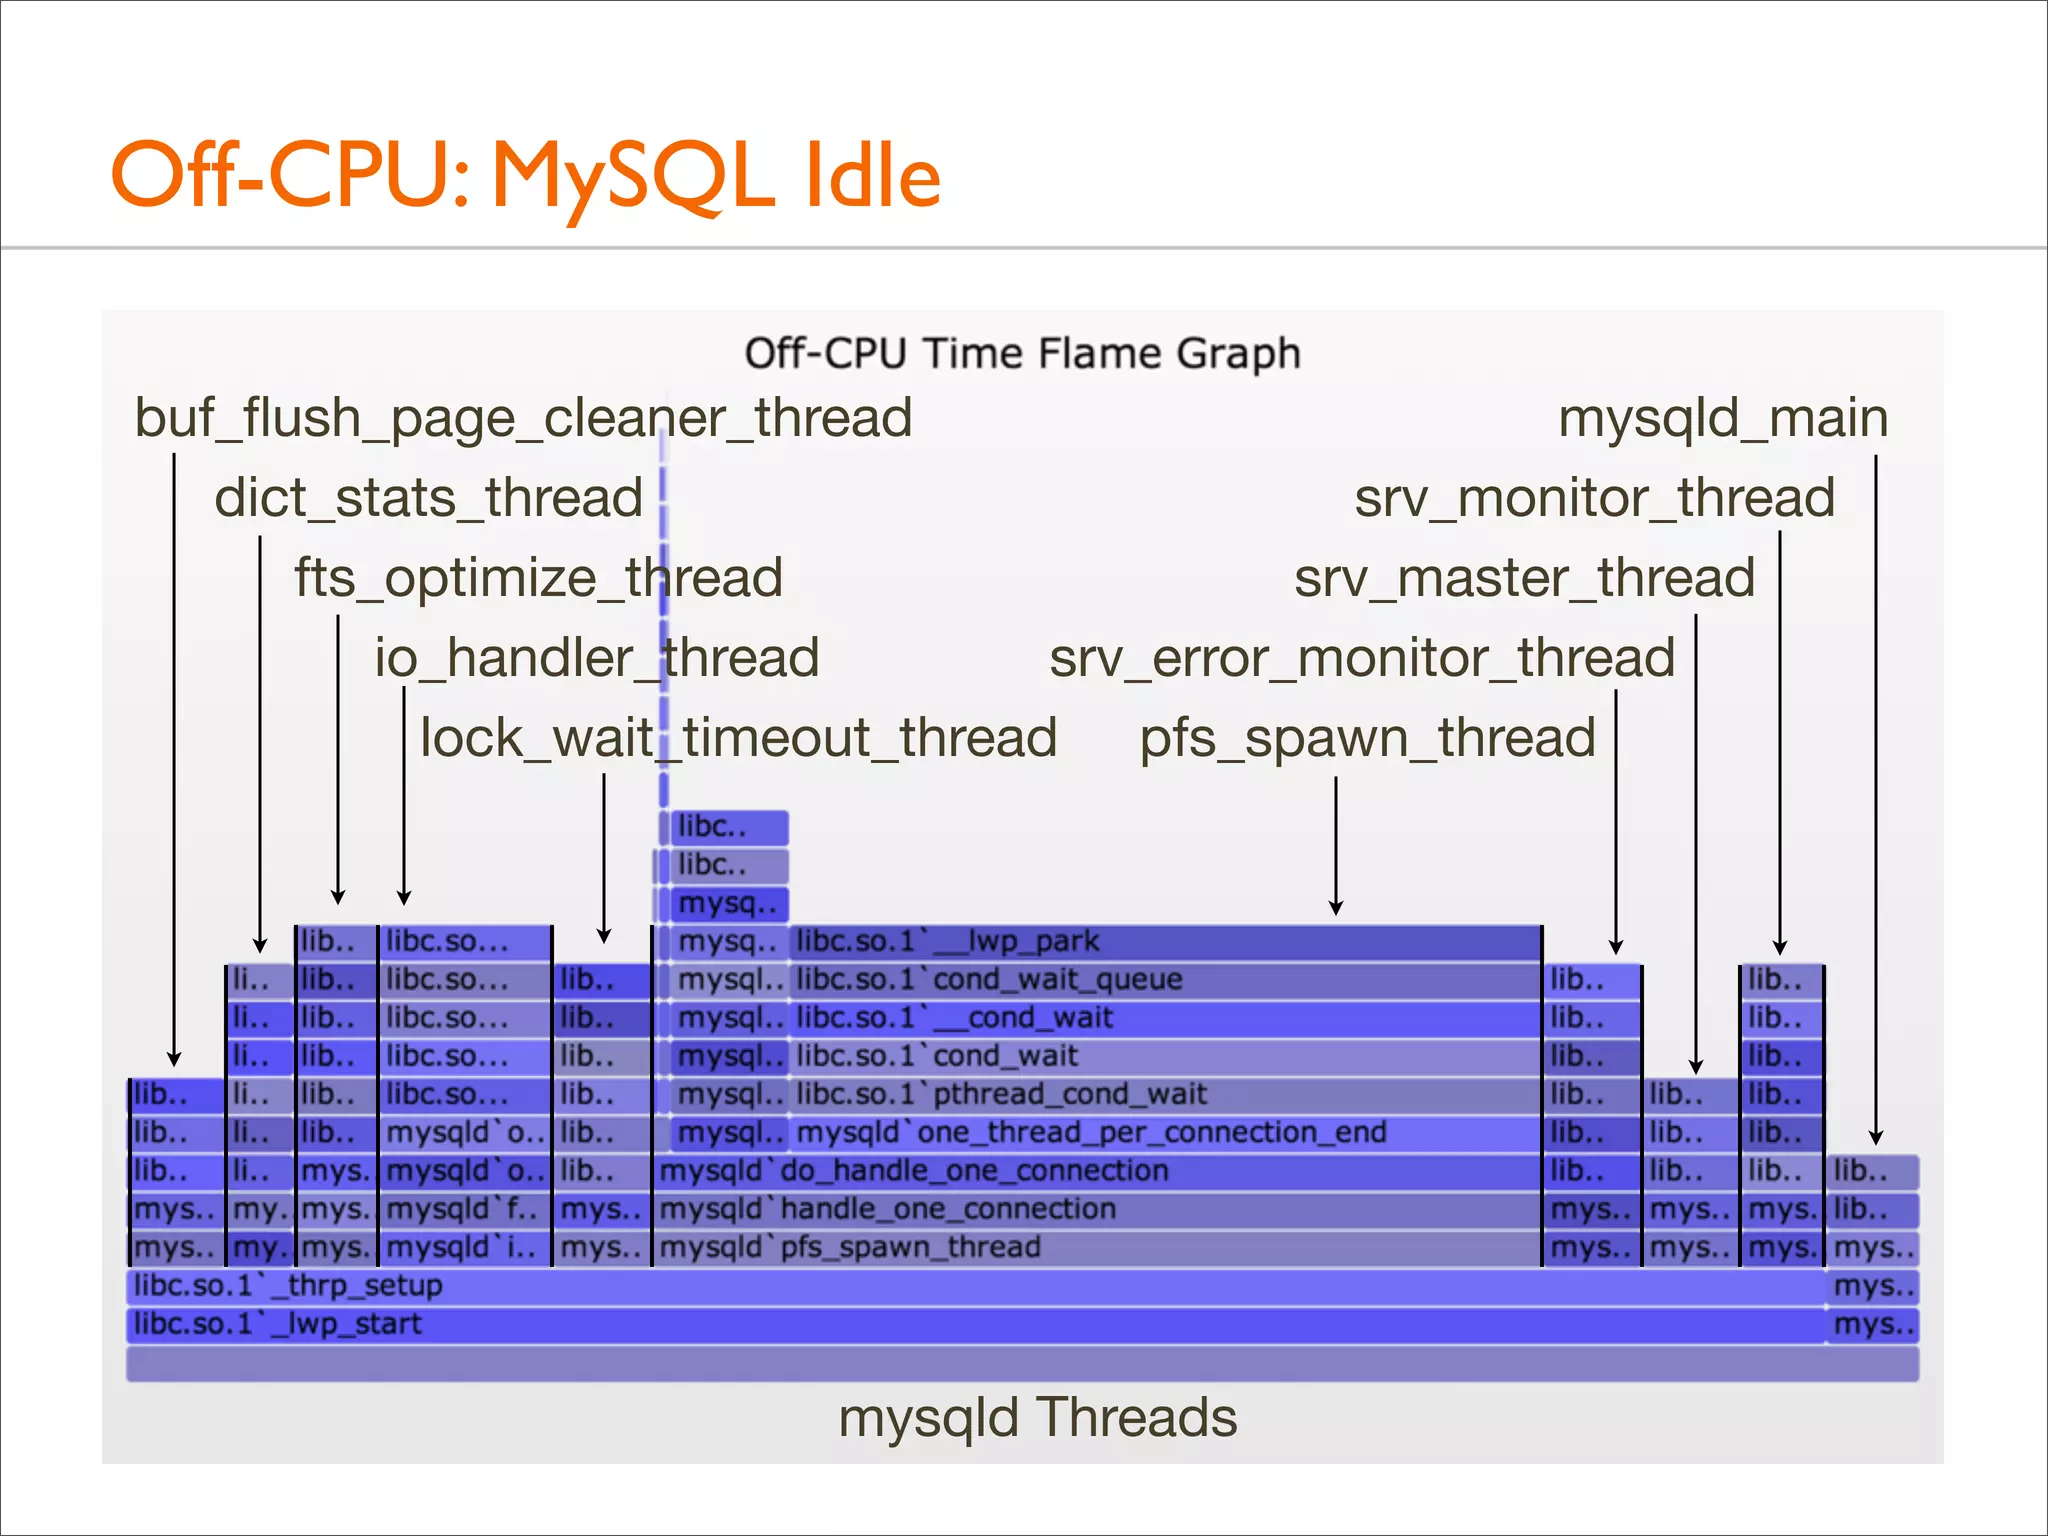
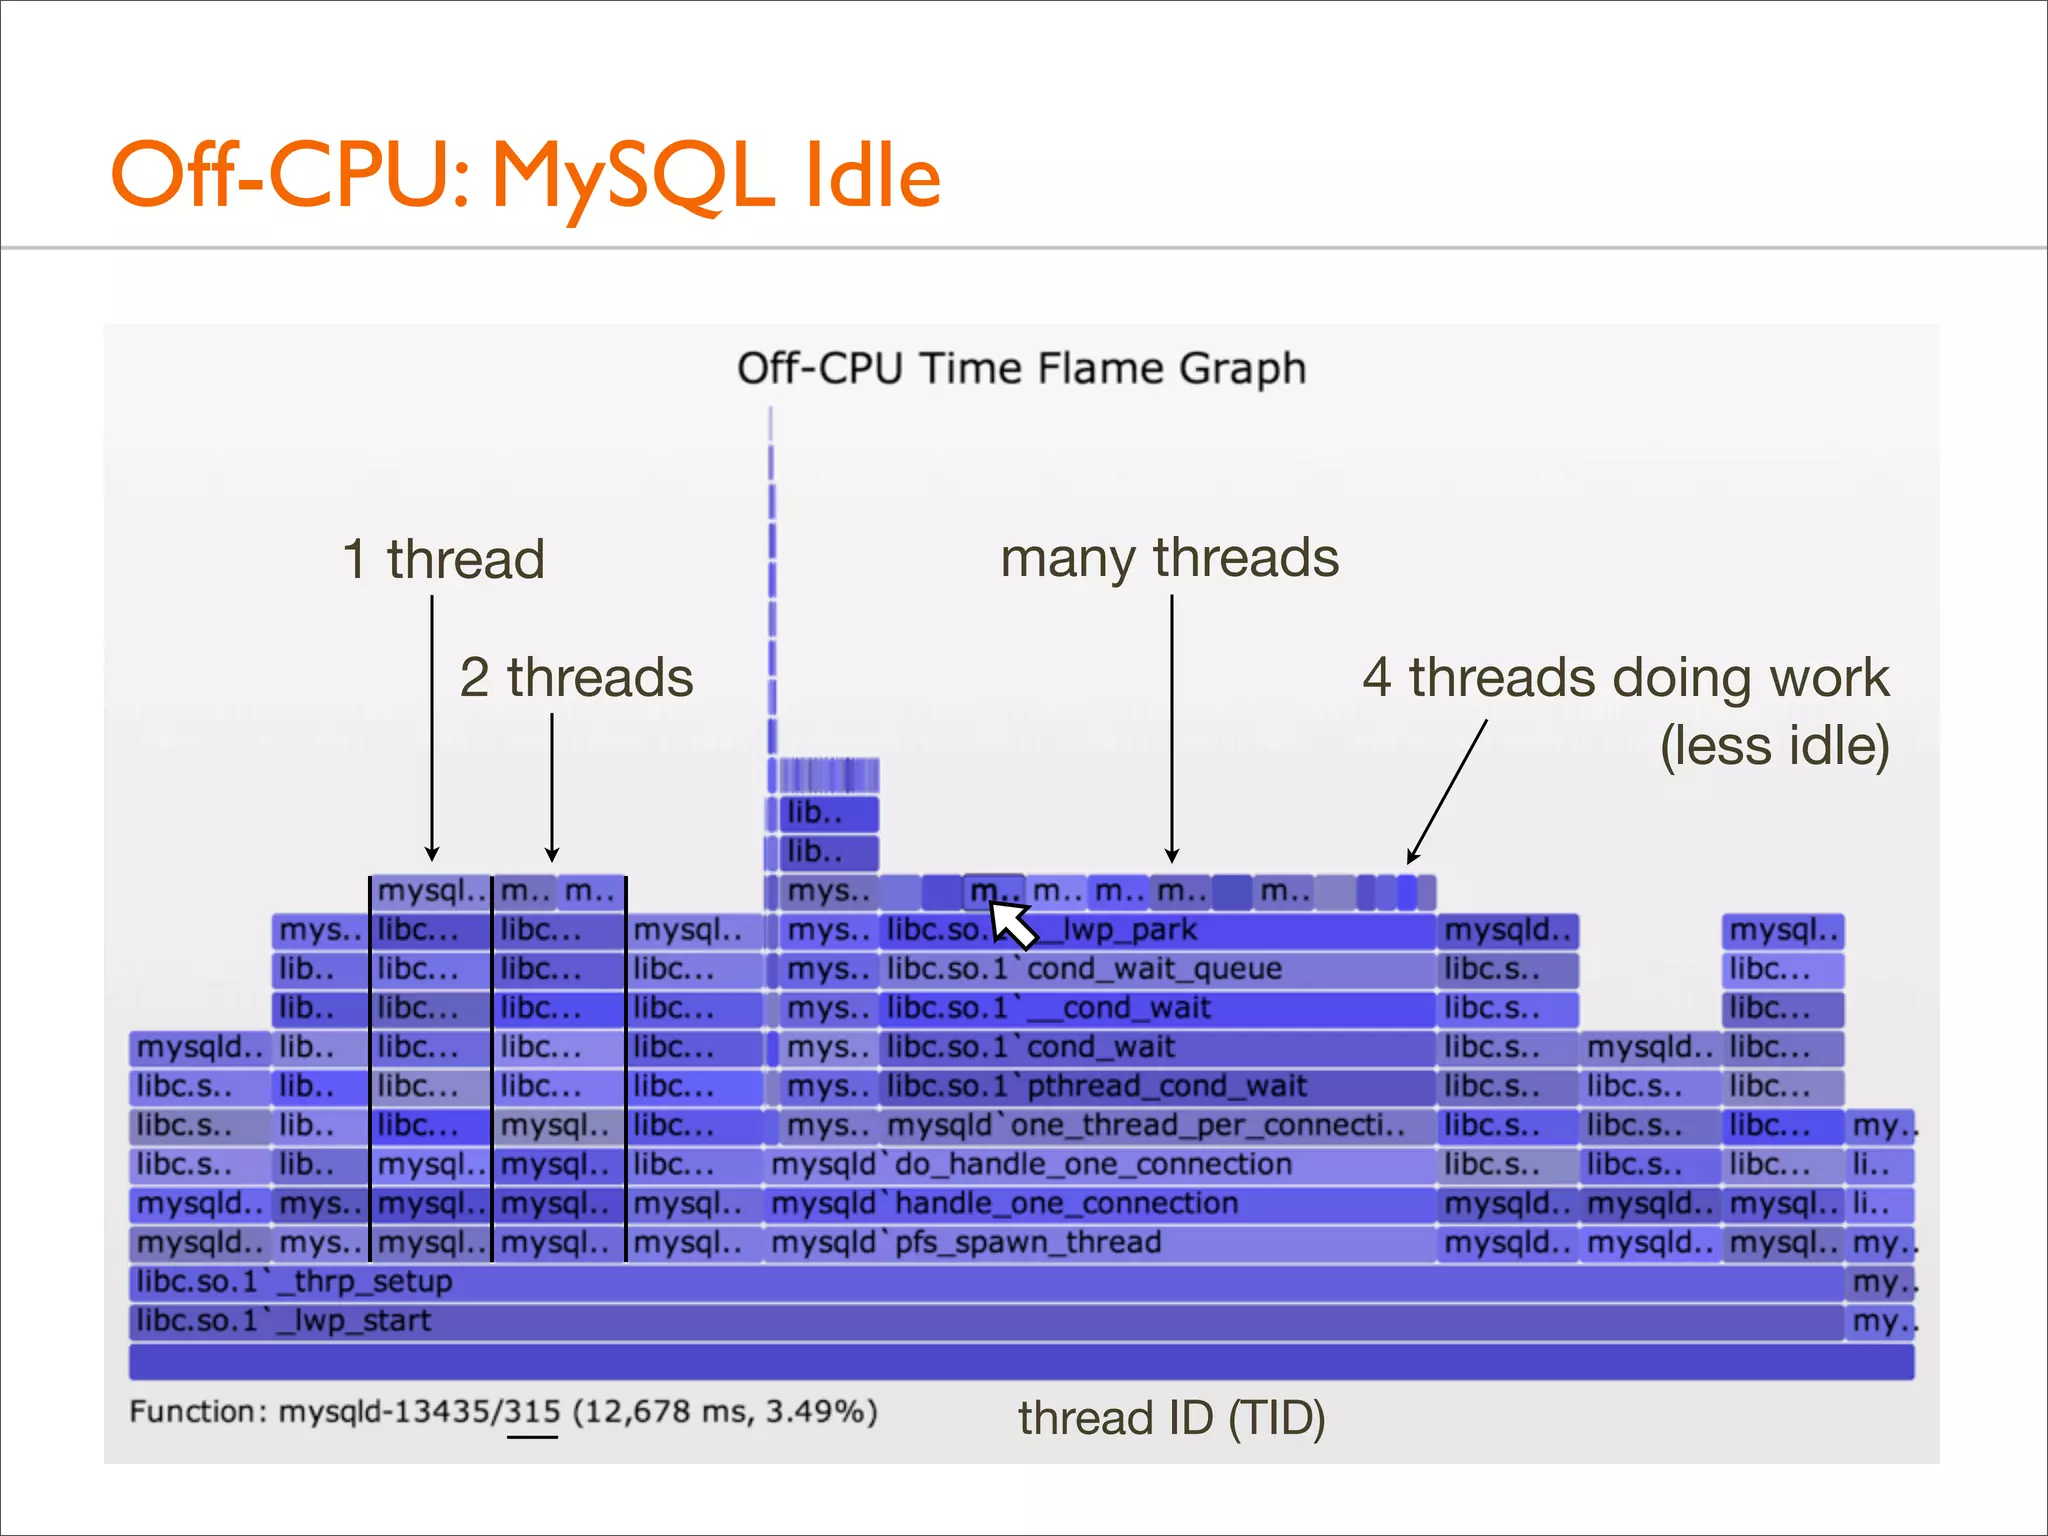
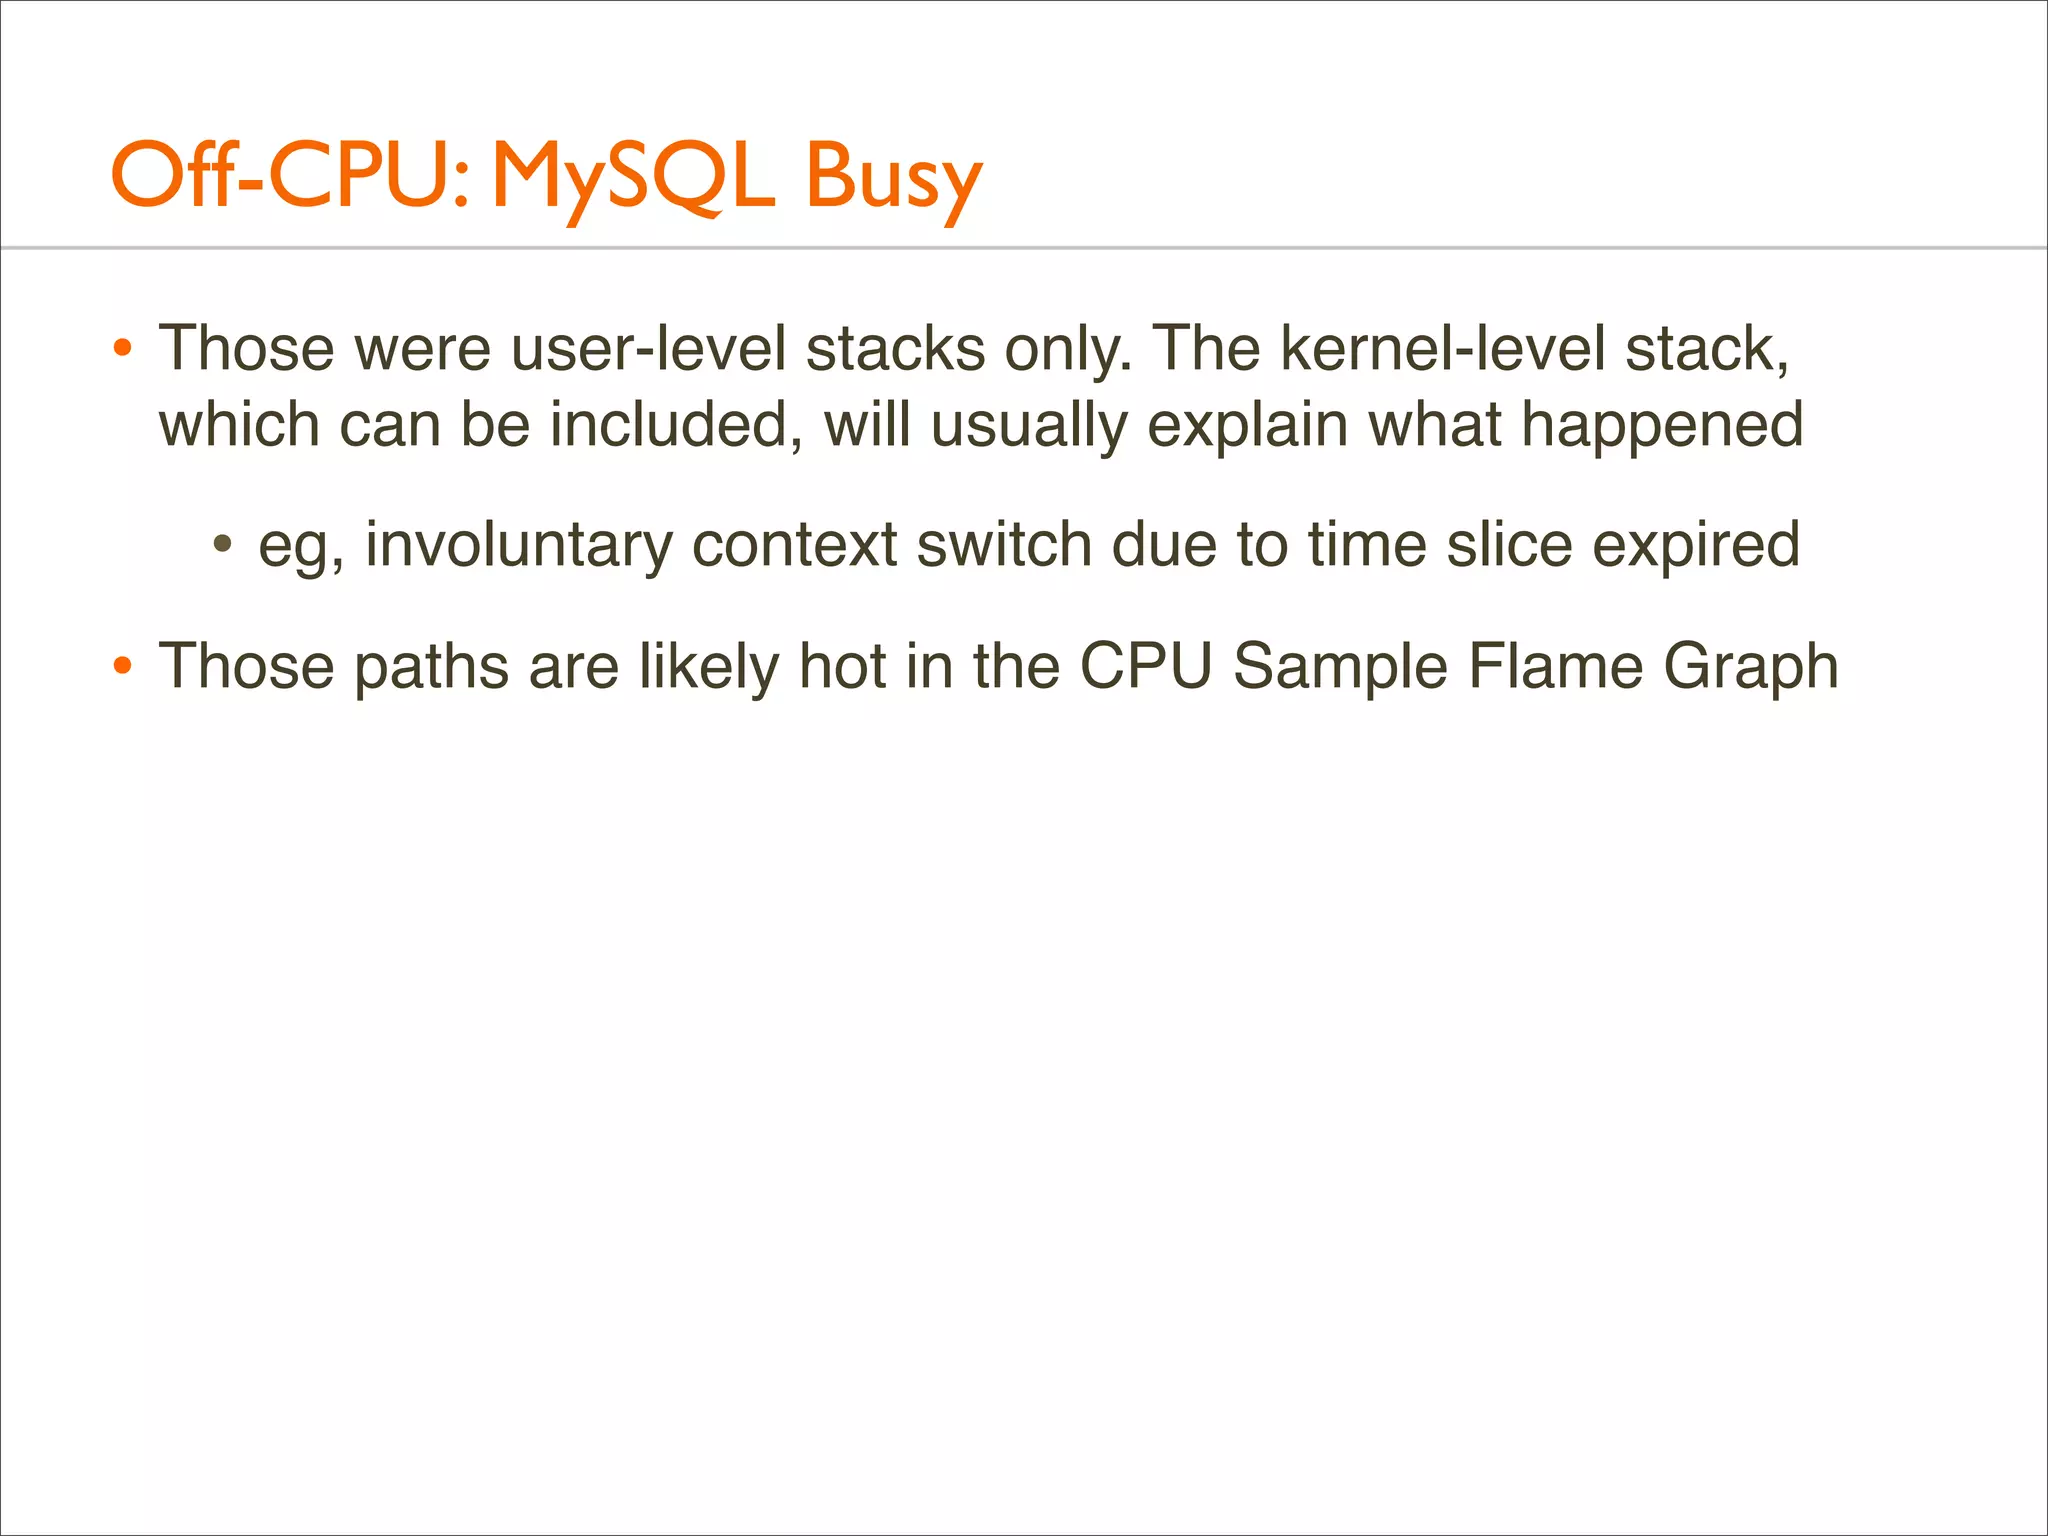
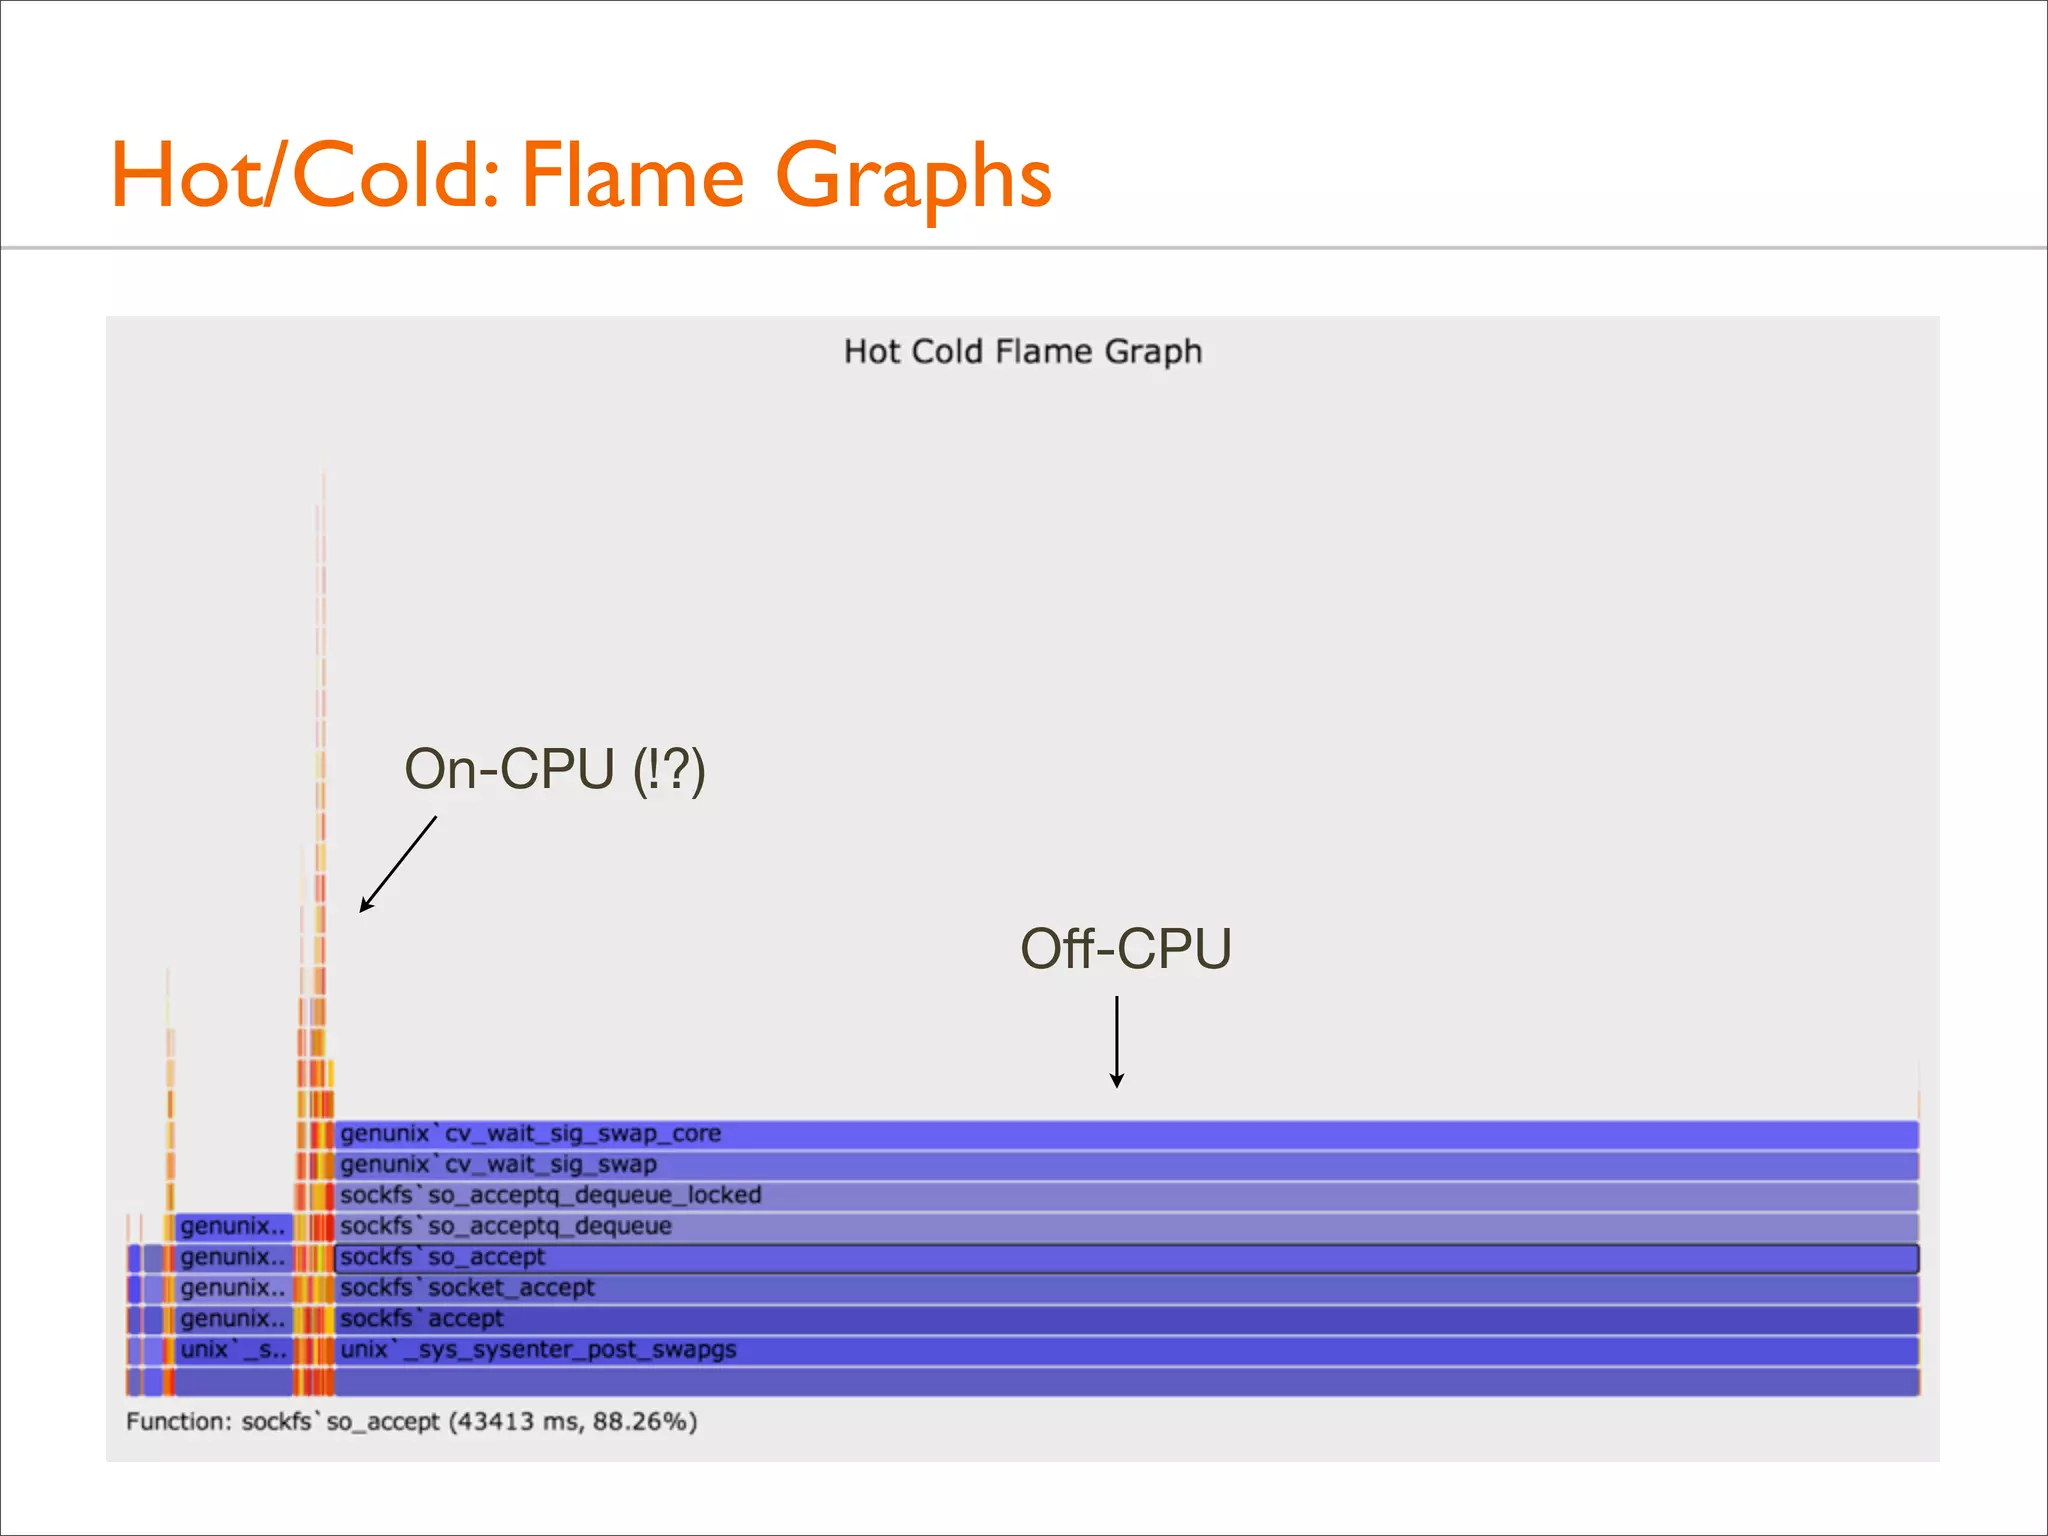
![Off-CPU: MySQL Idle
• Some thread columns are wider than the measurement time:
evidence of multiple threads
• This can be shown a number of ways. Eg, adding process
name, PID, and TID to the top of each user stack:
#!/usr/sbin/dtrace -s
#pragma D option ustackframes=100
sched:::off-cpu /execname == "mysqld"/ { self->ts = timestamp; }
sched:::on-cpu
/self->ts/
{
@[execname, pid, curlwpsinfo->pr_lwpid, ustack()] =
sum(timestamp - self->ts);
self->ts = 0;
}
dtrace:::END { printa("n%s-%d/%d%k%@dn", @); }](https://image.slidesharecdn.com/lisa13flamegraphs-131107112122-phpapp01/75/Blazing-Performance-with-Flame-Graphs-132-2048.jpg)

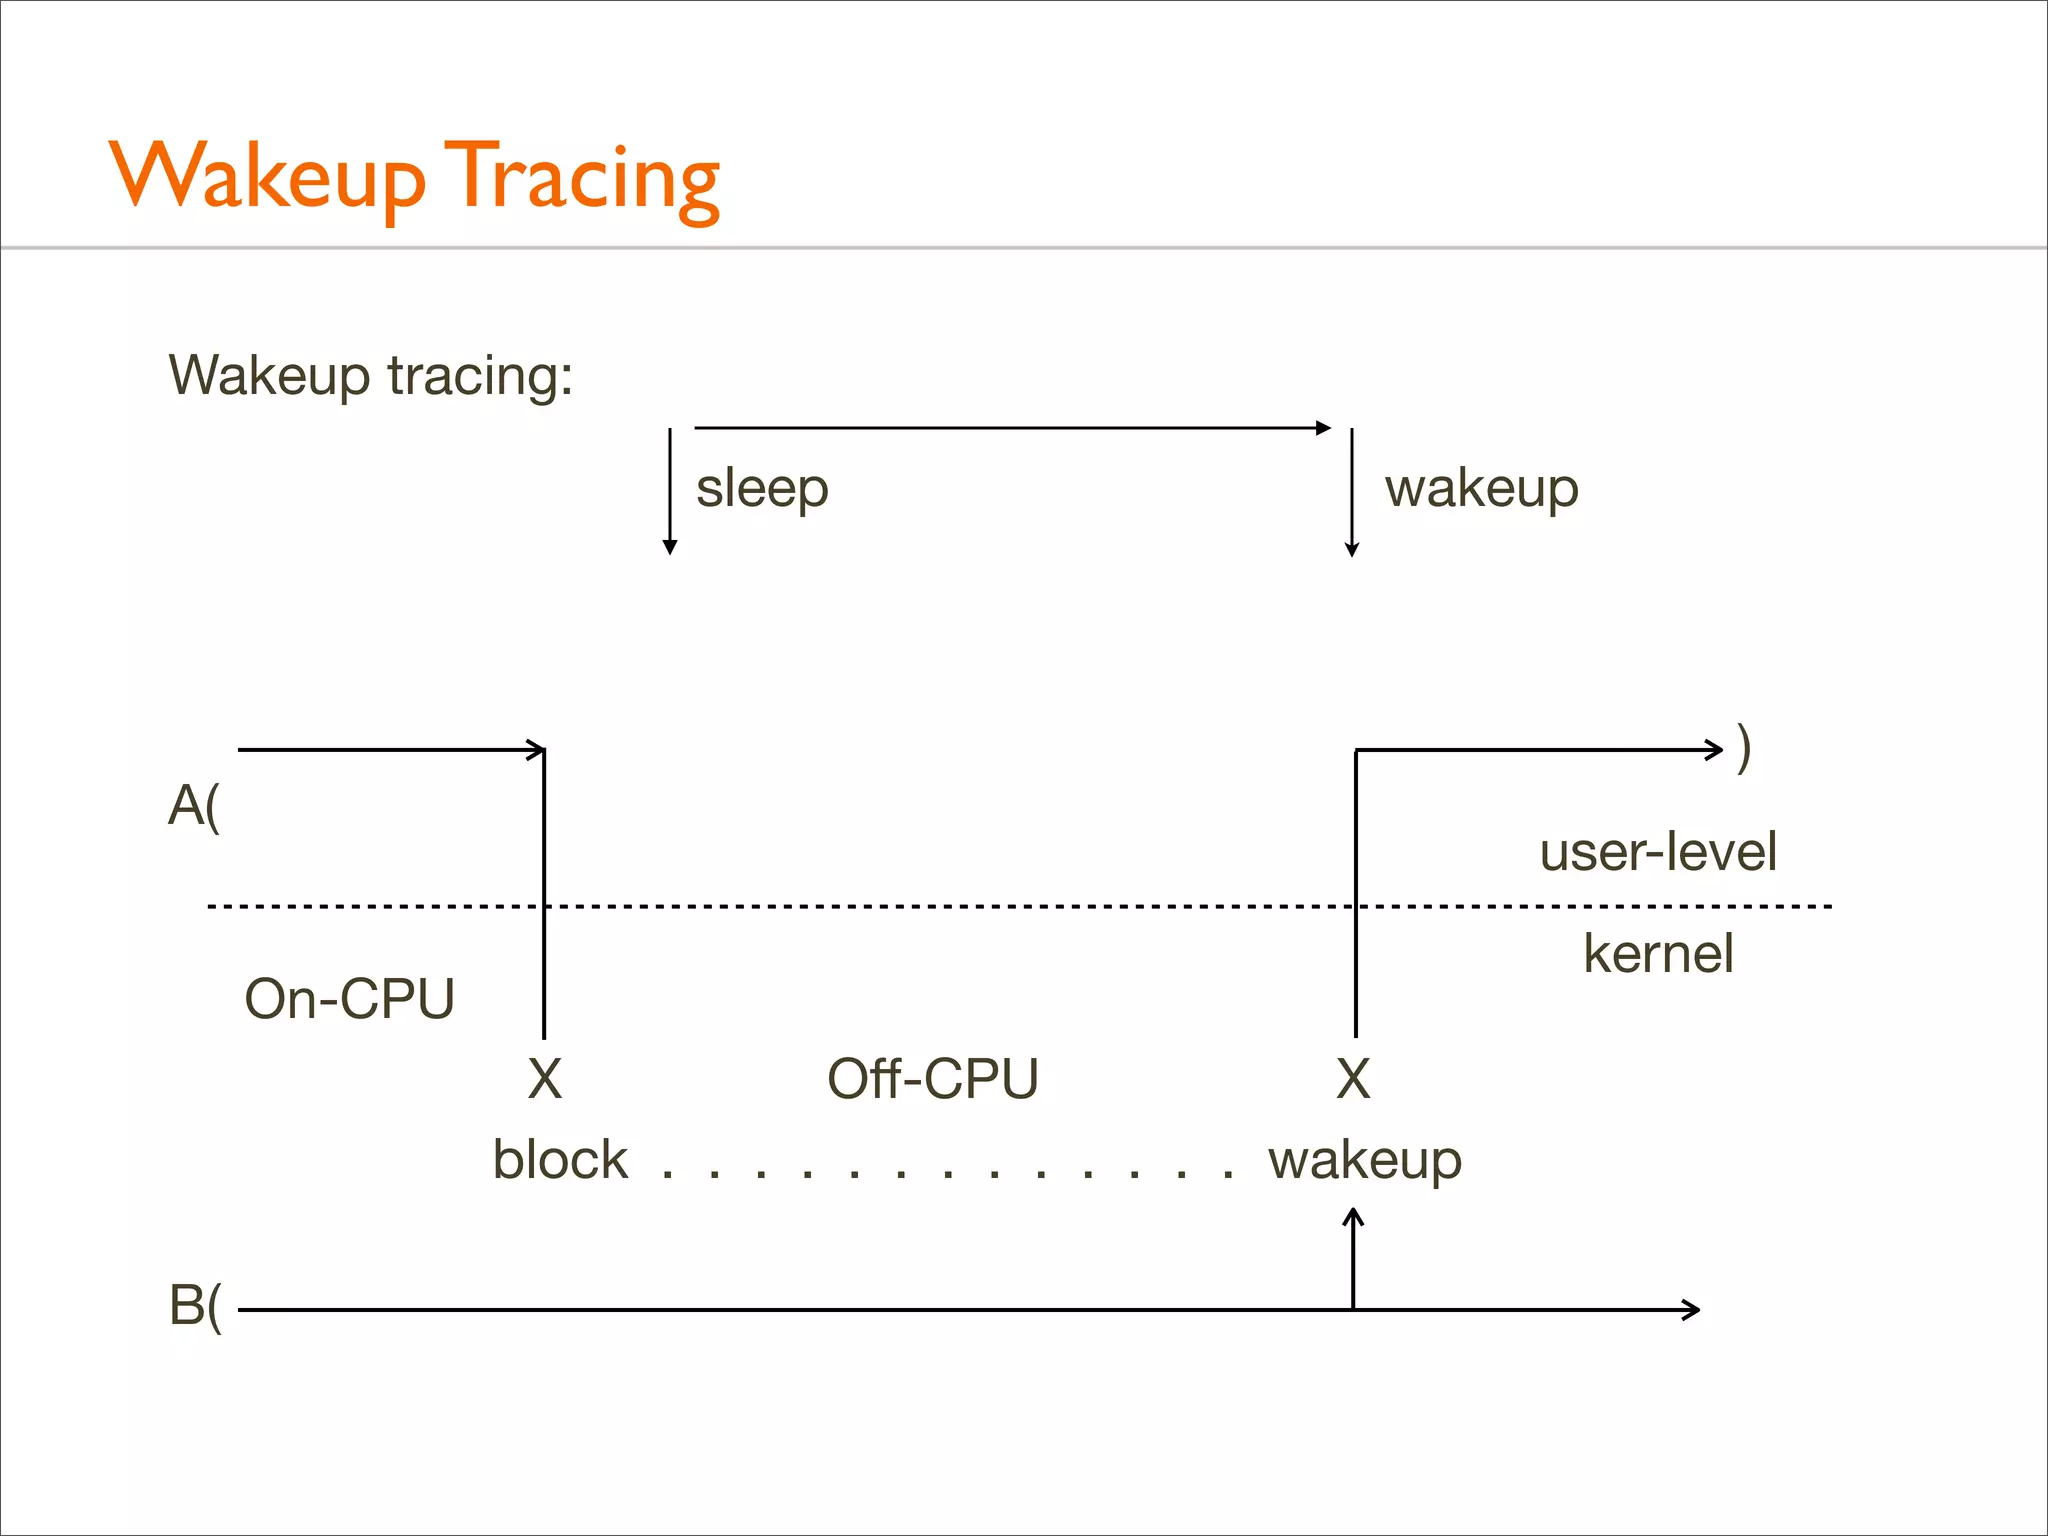
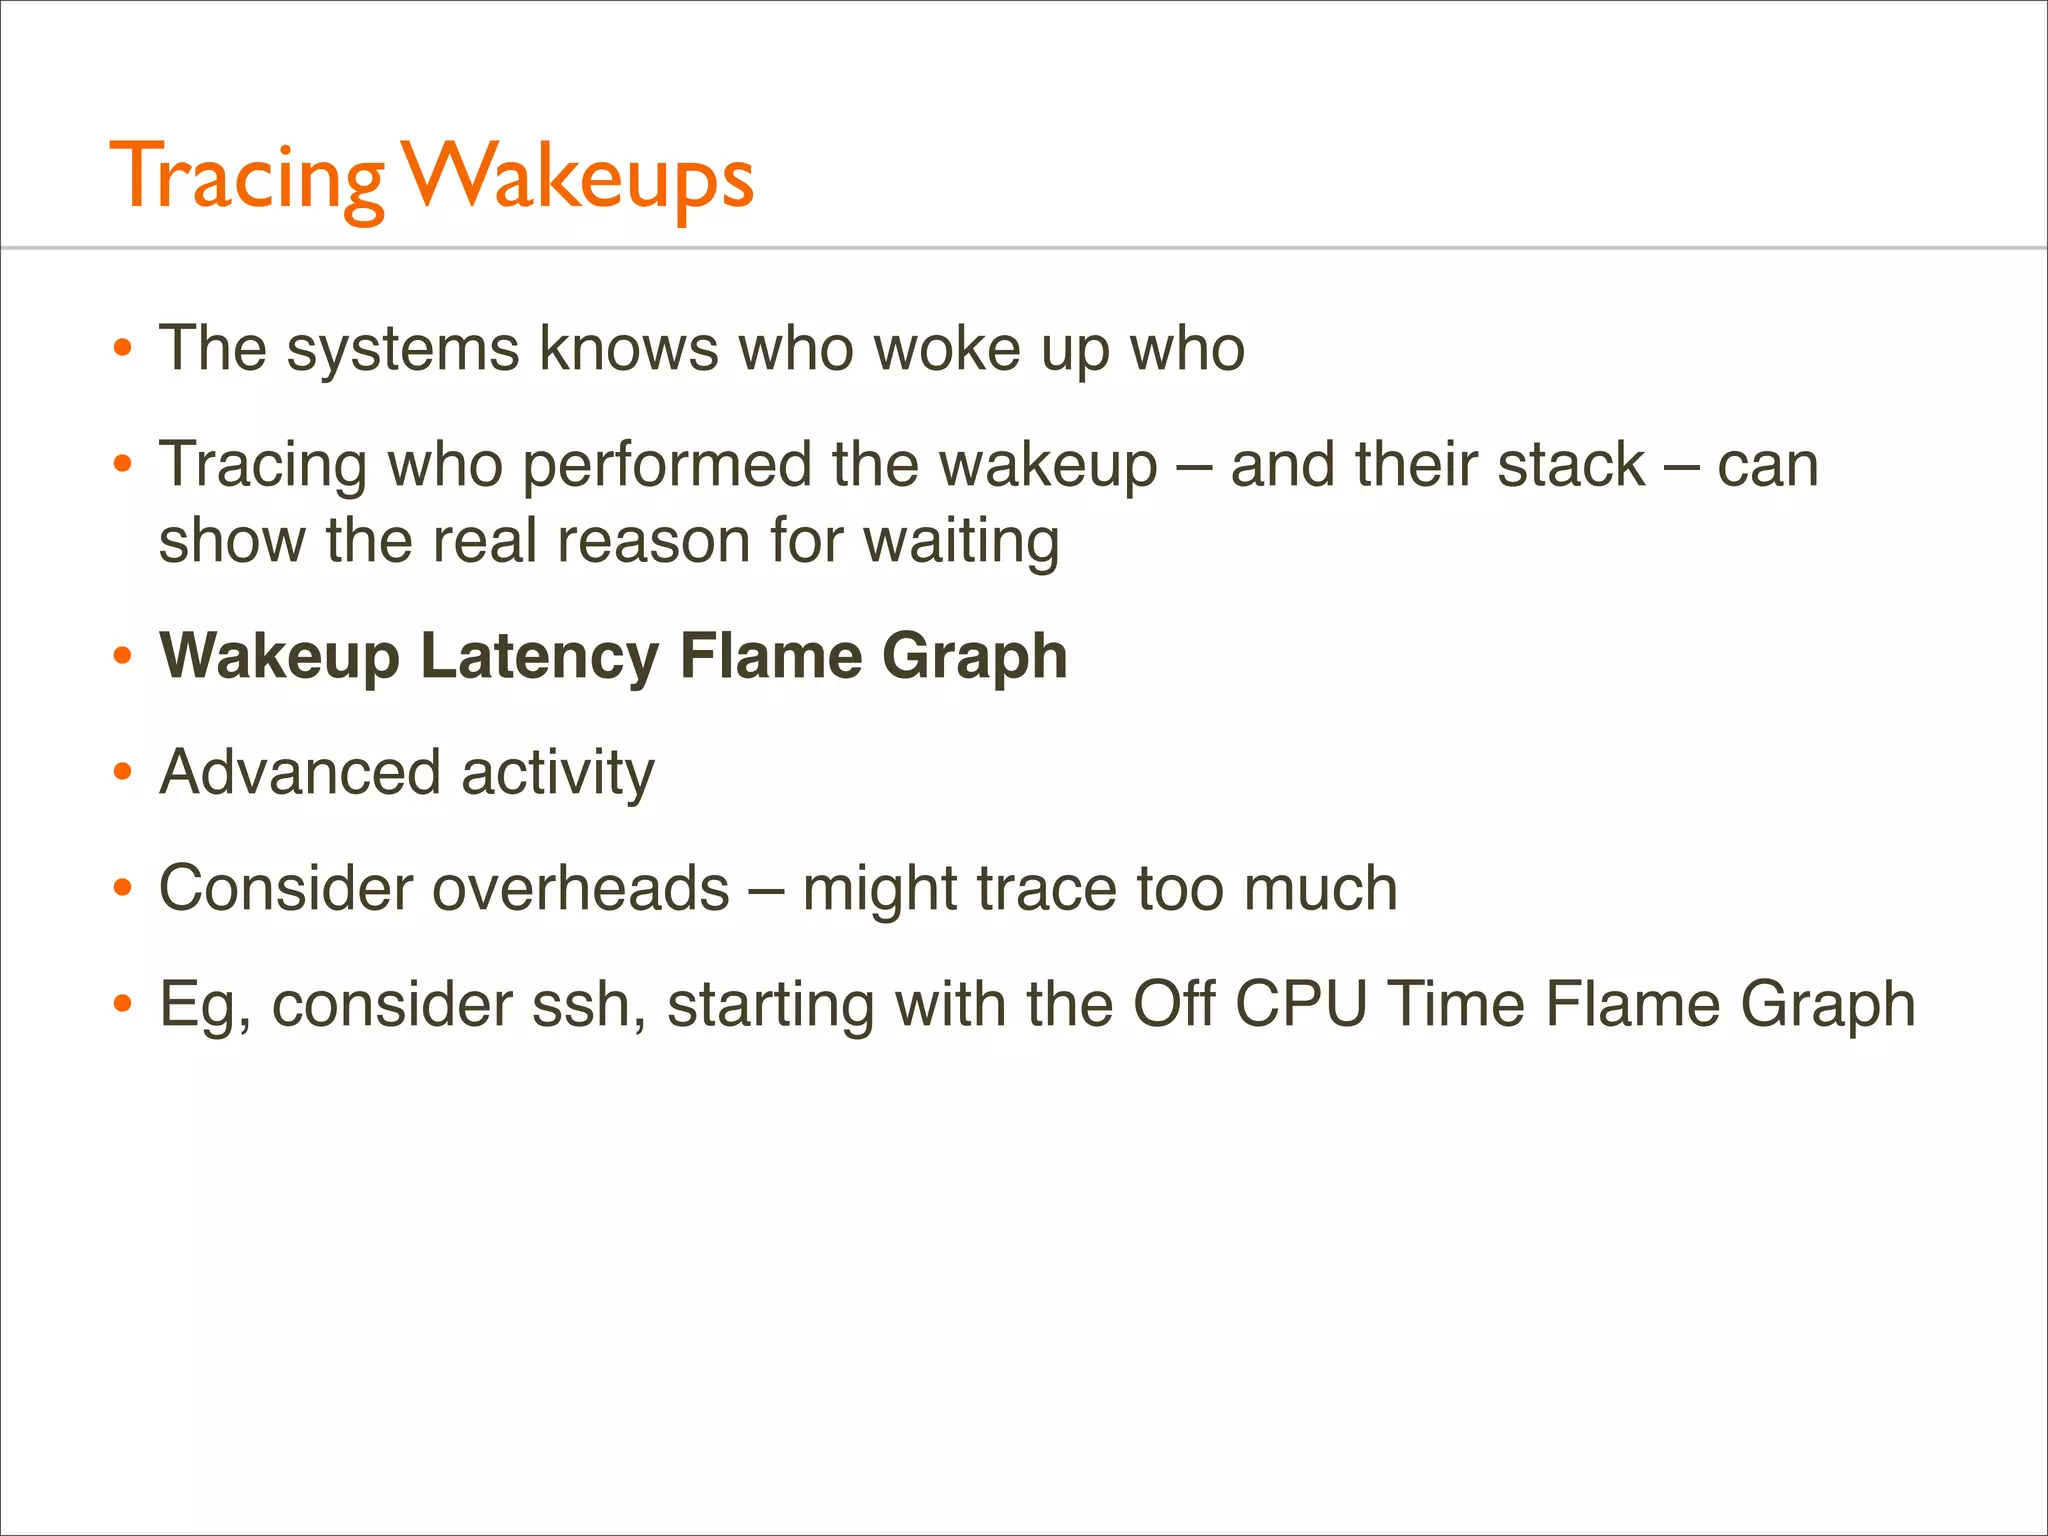
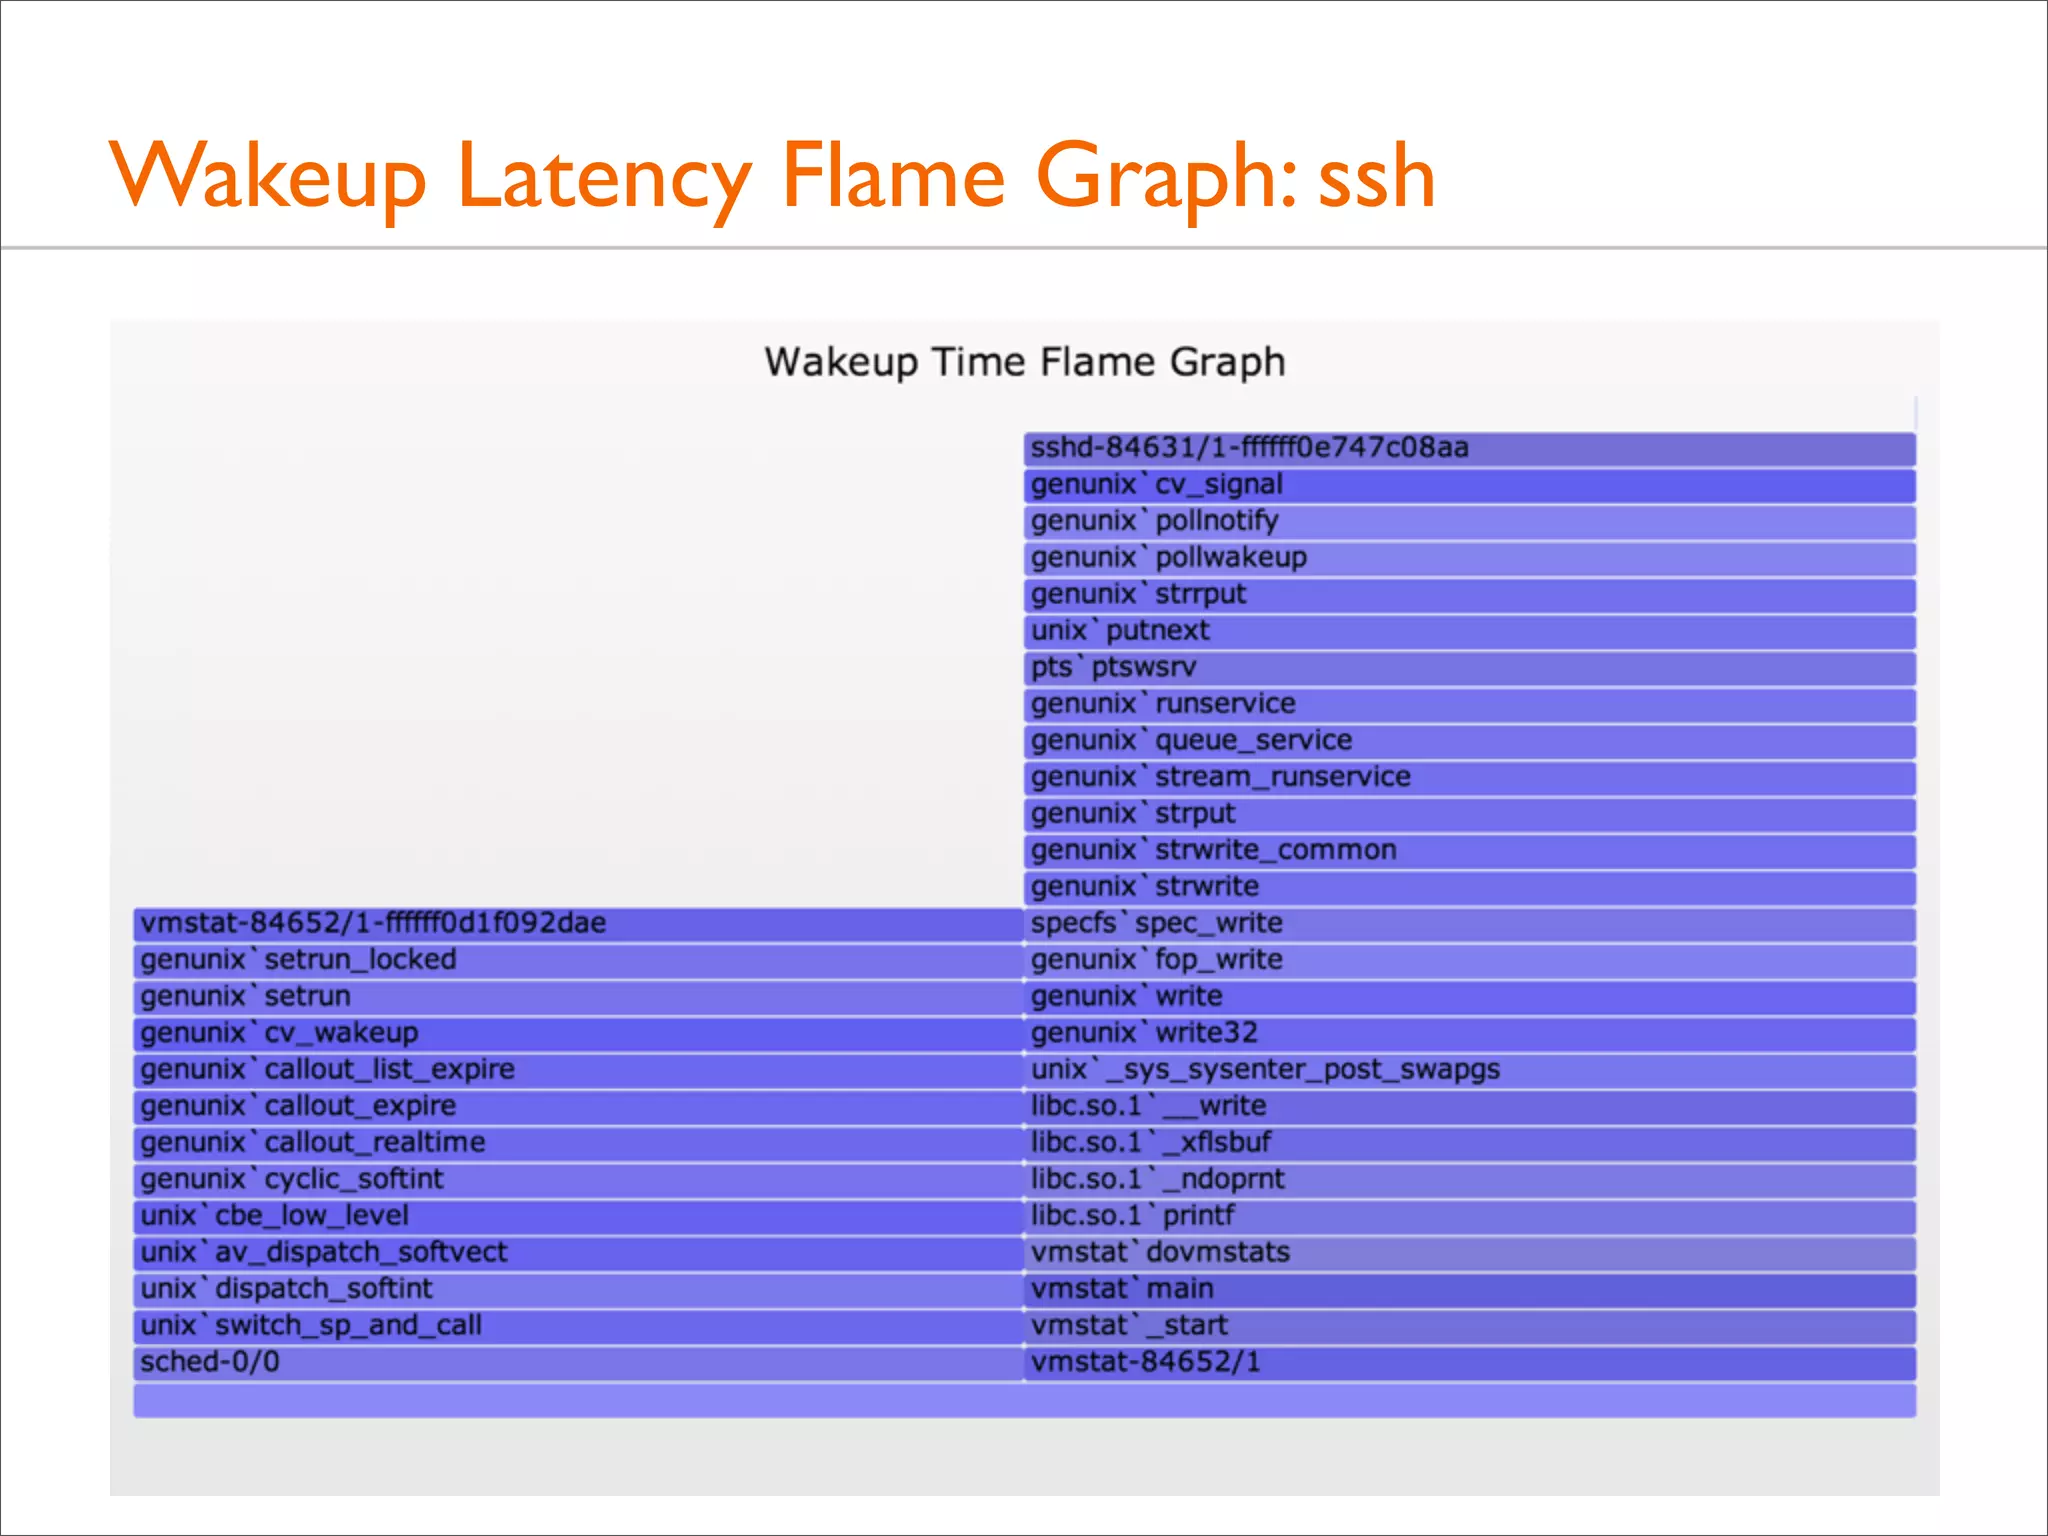
![Tracing Wakeup, Example (DTrace)
#!/usr/sbin/dtrace -s
#pragma D option quiet
#pragma D option ustackframes=100
#pragma D option stackframes=100
int related[uint64_t];
This example targets sshd
(previous example also matched
vmstat, after discovering that
sshd was blocked on vmstat,
which it was: "vmstat 1")
sched:::sleep
/execname == "sshd"/
{
ts[curlwpsinfo->pr_addr] = timestamp;
}
Time from sleep to wakeup
sched:::wakeup
/ts[args[0]->pr_addr]/
{
this->d = timestamp - ts[args[0]->pr_addr];
@[args[1]->pr_fname, args[1]->pr_pid, args[0]->pr_lwpid, args[0]->pr_wchan,
stack(), ustack(), execname, pid, curlwpsinfo->pr_lwpid] = sum(this->d);
ts[args[0]->pr_addr] = 0;
}
Stack traces of who is doing the waking
dtrace:::END
{
printa("n%s-%d/%d-%x%k-%k%s-%d/%dn%@dn", @);
}
Aggregate if possible instead of dumping, to minimize overheads](https://image.slidesharecdn.com/lisa13flamegraphs-131107112122-phpapp01/75/Blazing-Performance-with-Flame-Graphs-150-2048.jpg)
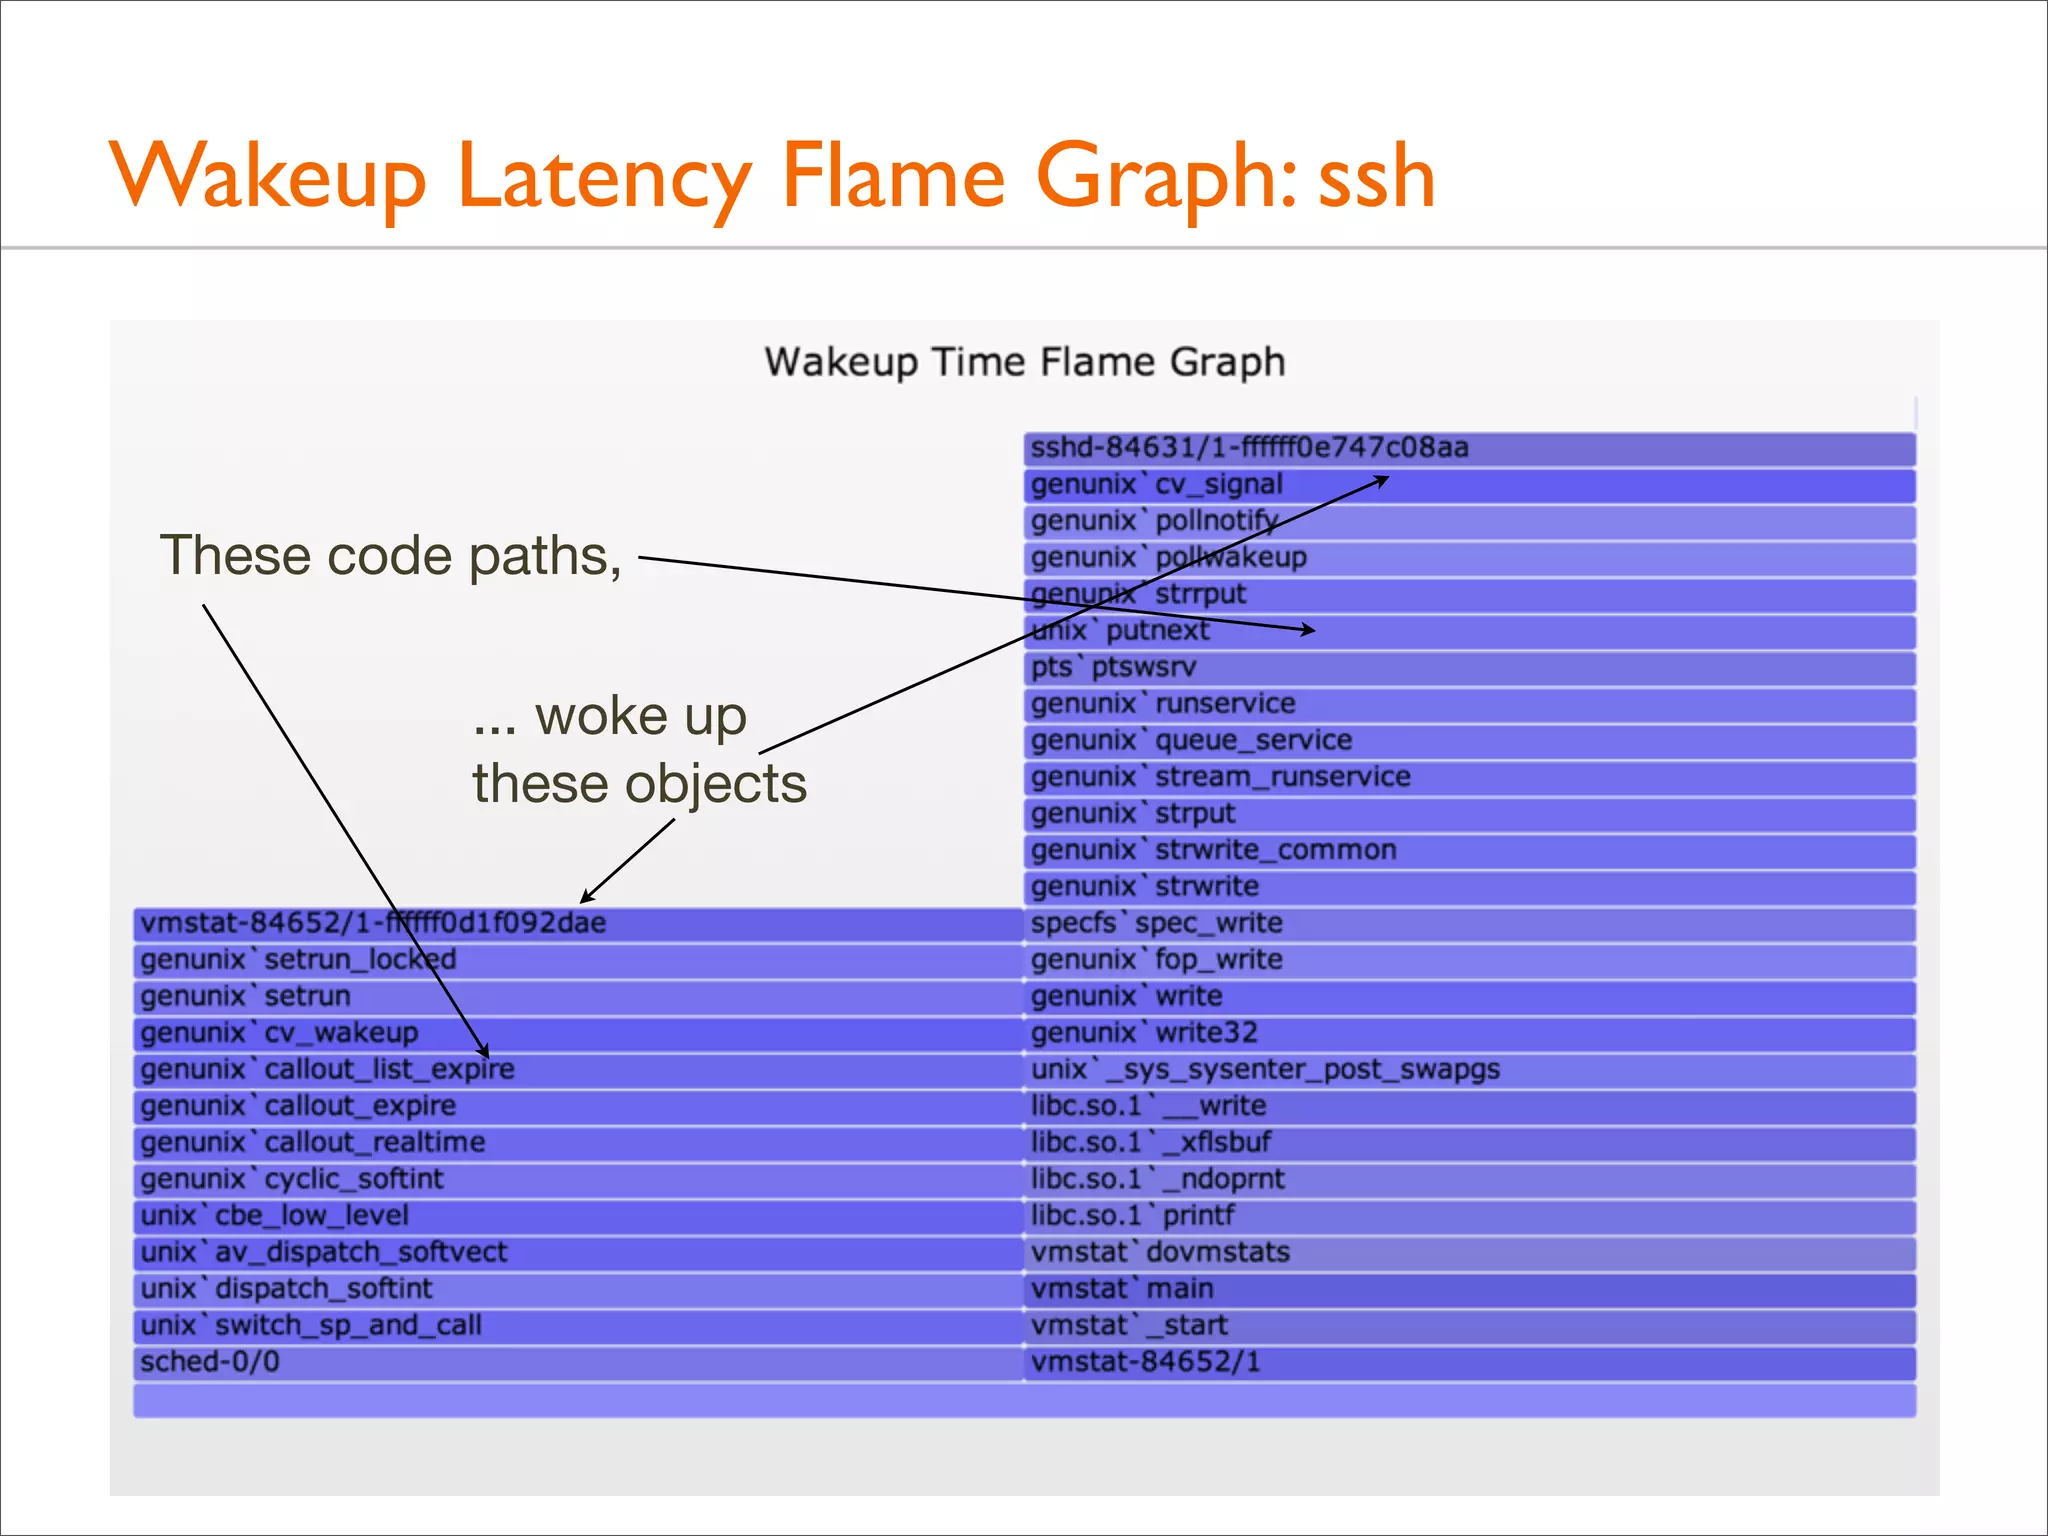
![Following Wakeup Chains, Example (DTrace)
#!/usr/sbin/dtrace -s
#pragma D option quiet
#pragma D option ustackframes=100
#pragma D option stackframes=100
int related[uint64_t];
sched:::sleep
/execname == "sshd" || related[curlwpsinfo->pr_addr]/
{
ts[curlwpsinfo->pr_addr] = timestamp;
}
sched:::wakeup
/ts[args[0]->pr_addr]/
{
this->d = timestamp - ts[args[0]->pr_addr];
@[args[1]->pr_fname, args[1]->pr_pid, args[0]->pr_lwpid, args[0]->pr_wchan,
stack(), ustack(), execname, pid, curlwpsinfo->pr_lwpid] = sum(this->d);
ts[args[0]->pr_addr] = 0;
related[curlwpsinfo->pr_addr] = 1;
}
dtrace:::END
{
printa("n%s-%d/%d-%x%k-%k%s-%d/%dn%@dn", @);
}
Also follow who
wakes up the waker](https://image.slidesharecdn.com/lisa13flamegraphs-131107112122-phpapp01/75/Blazing-Performance-with-Flame-Graphs-155-2048.jpg)


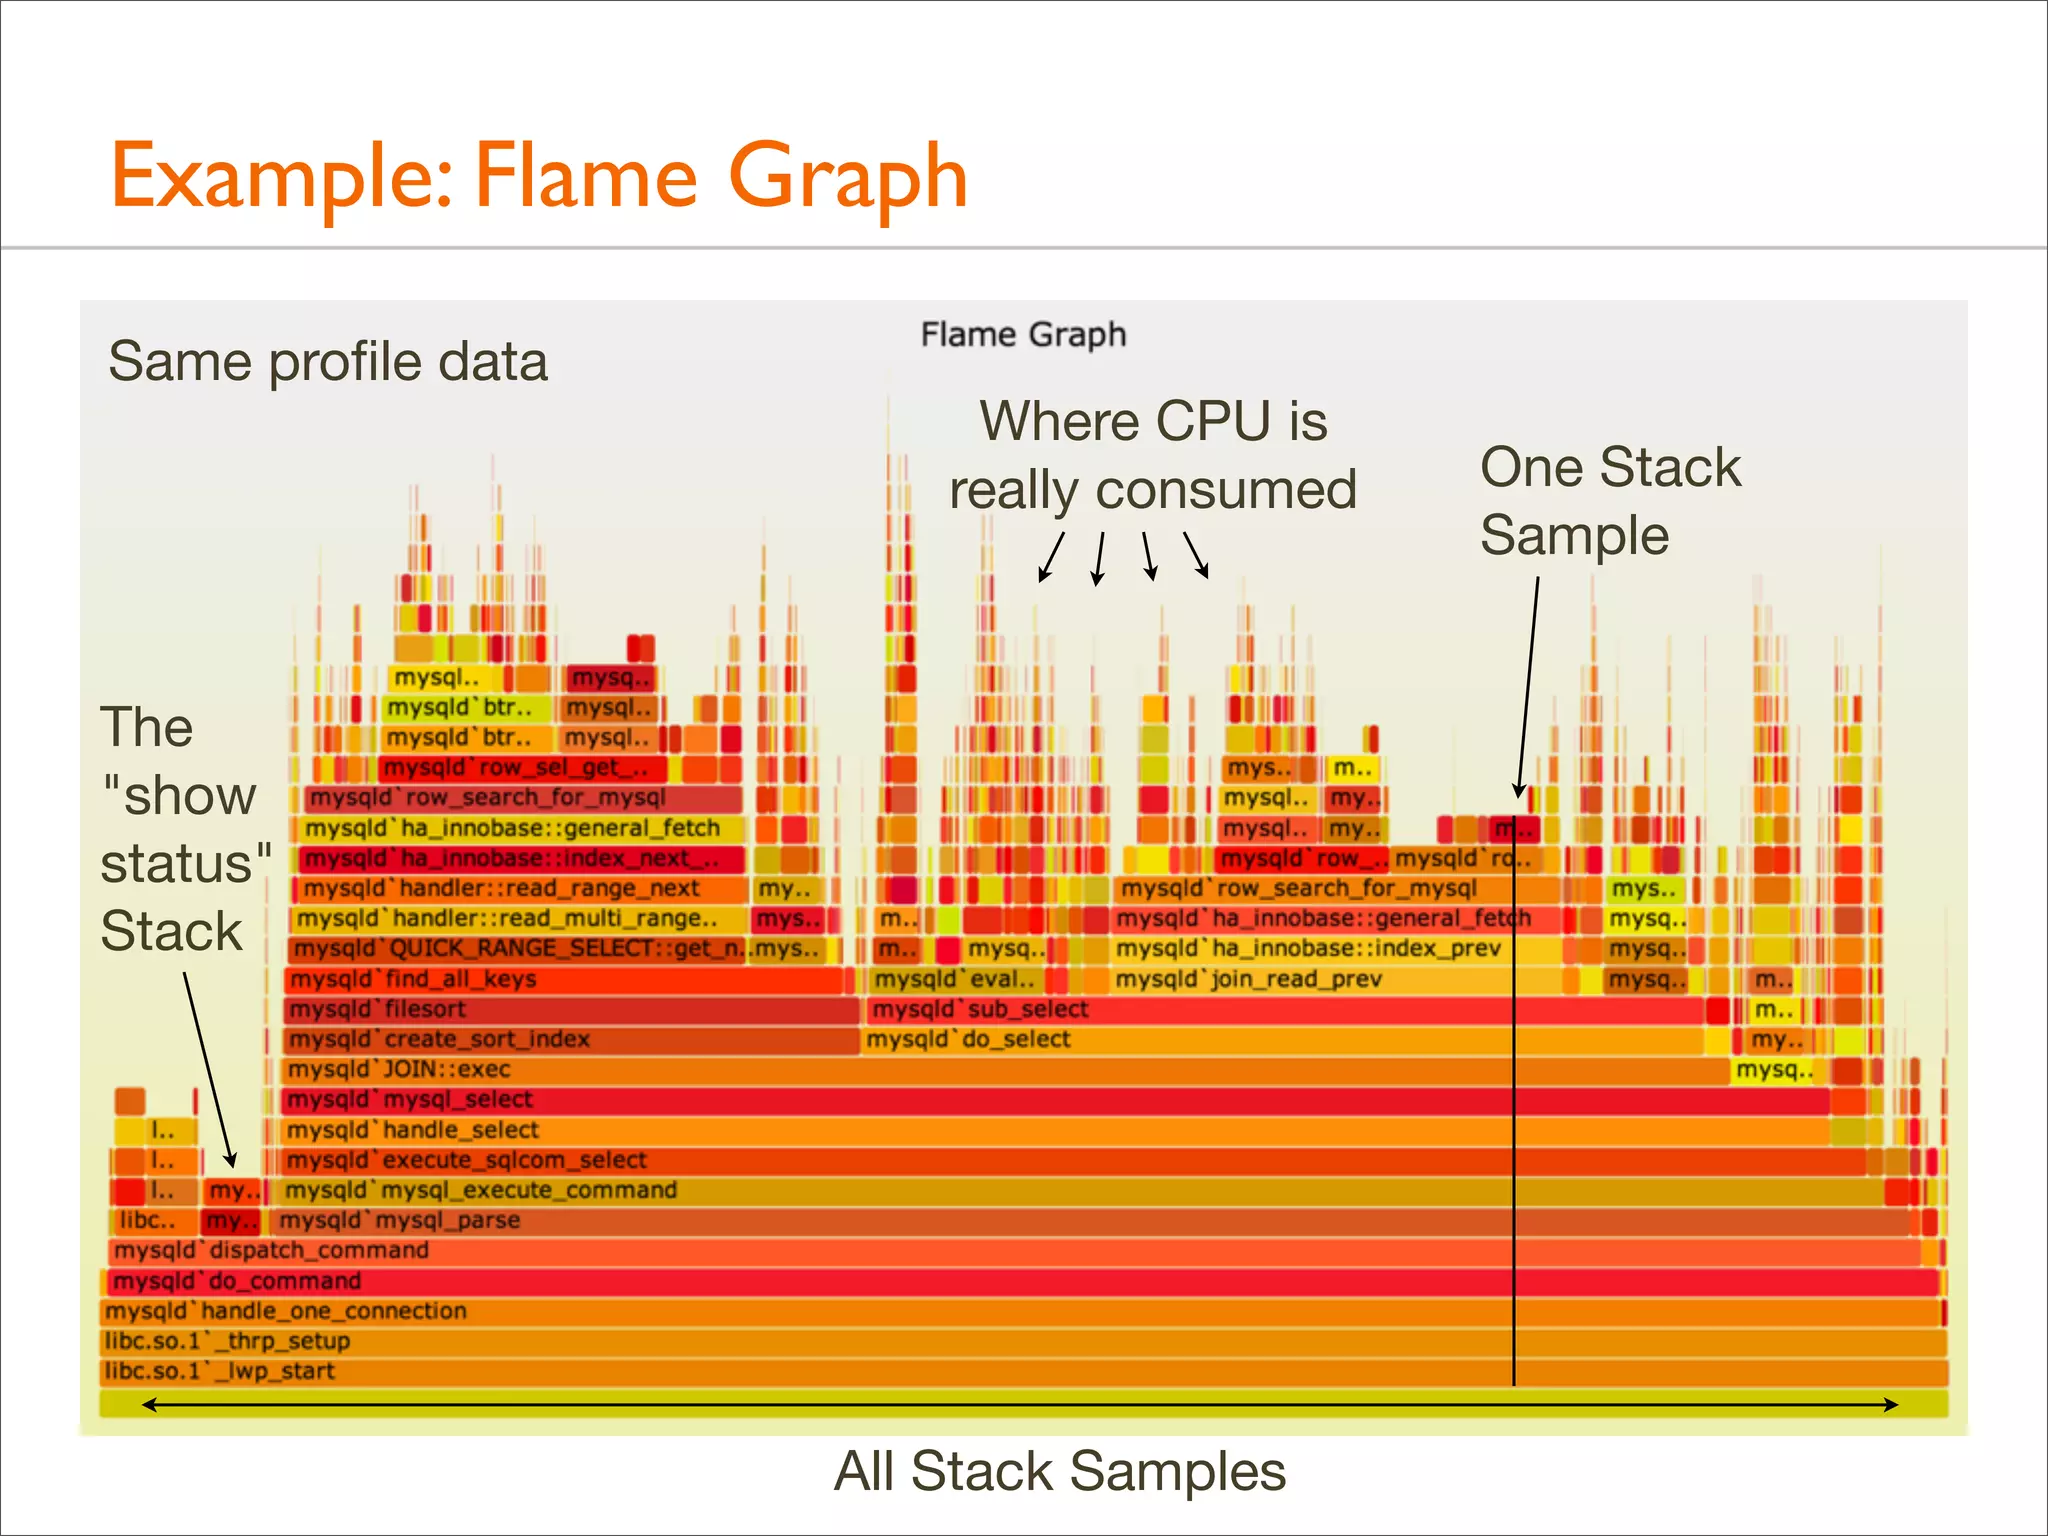
The document presents Brendan Gregg's work on flame graphs, an interactive visualization technique for analyzing stack traces, particularly in performance profiling for software. It details the creation and utility of CPU flame graphs, showcasing their ability to simplify the understanding of performance issues in applications like MySQL, where previous complex outputs can be distilled into a concise visual representation. Additionally, the document covers the different types of flame graphs, including advanced variations for memory and I/O profiles, emphasizing their importance for developers and performance engineers in diagnosing and improving application performance.


![[232] 성능어디까지쥐어짜봤니 송태웅](https://cdn.slidesharecdn.com/ss_thumbnails/232-161025013504-thumbnail.jpg?width=640&height=640&fit=bounds)

![[NDC 2018] 신입 개발자가 알아야 할 윈도우 메모리릭 디버깅](https://cdn.slidesharecdn.com/ss_thumbnails/v7-180427162920-thumbnail.jpg?width=640&height=640&fit=bounds)


![The power of linux advanced tracer [POUG18]](https://cdn.slidesharecdn.com/ss_thumbnails/thepoweroflinuxadvancedtracer-180909125236-thumbnail.jpg?width=640&height=640&fit=bounds)


![Vibe Coding vs. Spec-Driven Development [Free Meetup]](https://cdn.slidesharecdn.com/ss_thumbnails/vibecodingvsspecdrivendevelopment-251209105622-43f455e7-thumbnail.jpg?width=640&height=640&fit=bounds)


