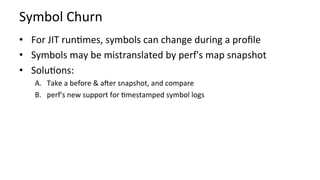
Download as PDF, PPTX
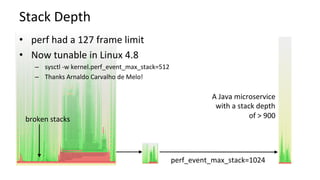
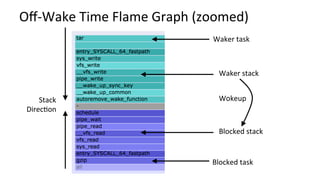
![Stack Traces
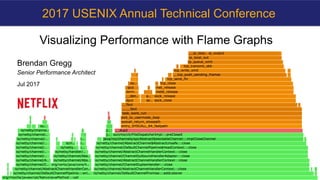
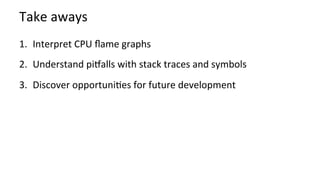
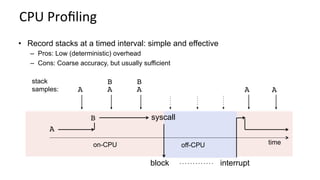
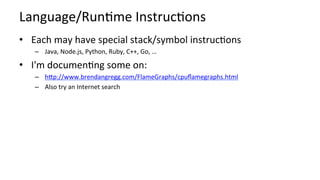
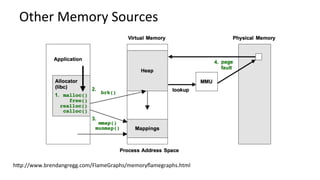
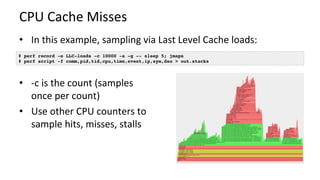
• A code path snapshot. e.g., from jstack(1):
$ jstack 1819
[…]
"main" prio=10 tid=0x00007ff304009000 nid=0x7361
runnable [0x00007ff30d4f9000]
java.lang.Thread.State: RUNNABLE
at Func_abc.func_c(Func_abc.java:6)
at Func_abc.func_b(Func_abc.java:16)
at Func_abc.func_a(Func_abc.java:23)
at Func_abc.main(Func_abc.java:27)
running
parent
g.parent
g.g.parent](https://image.slidesharecdn.com/usenixatc2017flamegraphs-170713224624/85/USENIX-ATC-2017-Visualizing-Performance-with-Flame-Graphs-9-320.jpg)
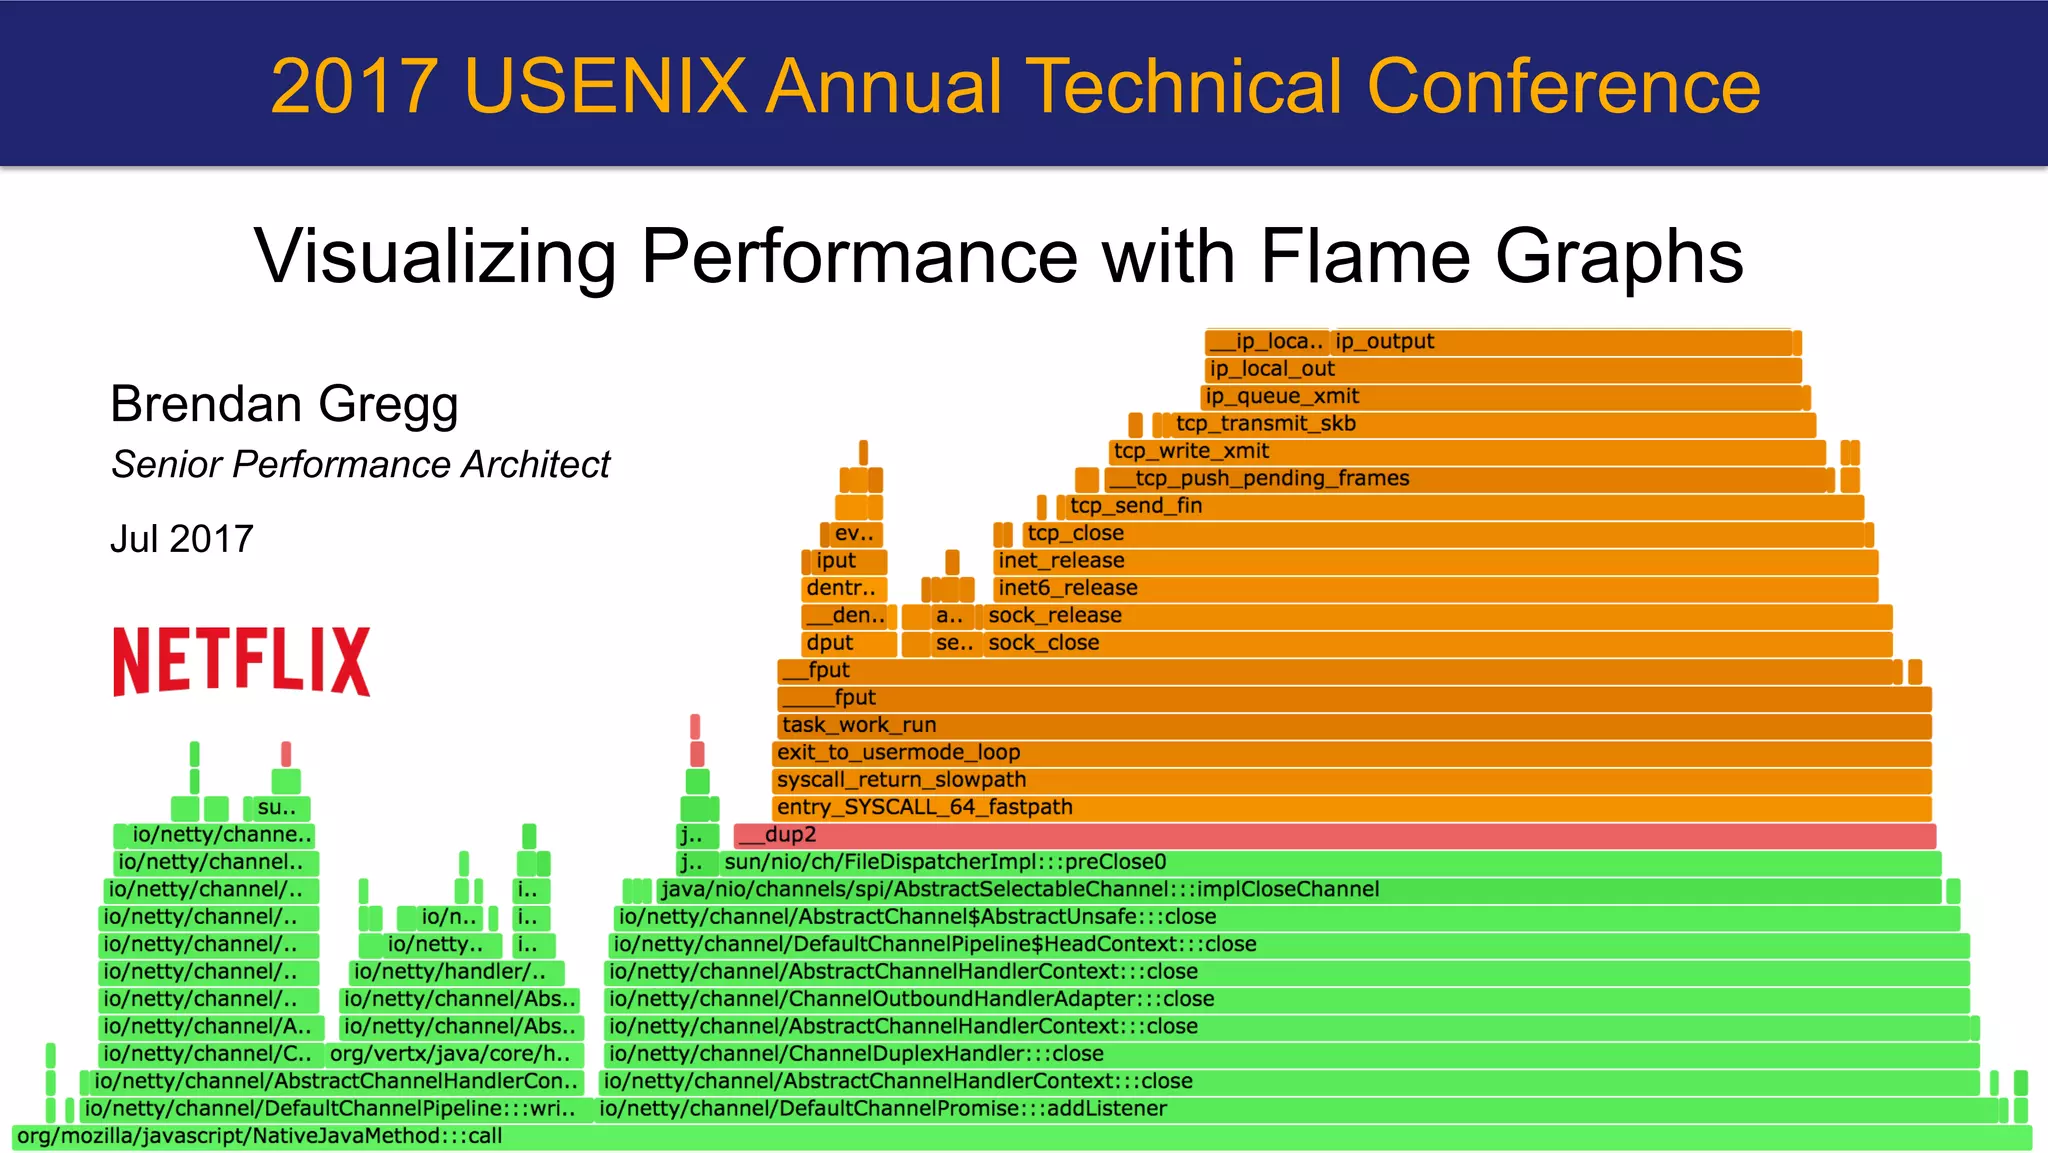
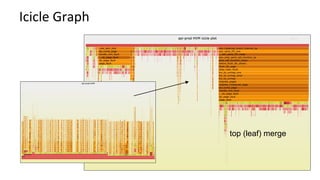
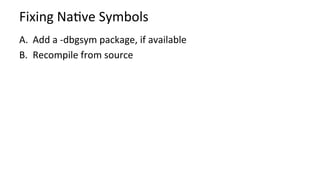
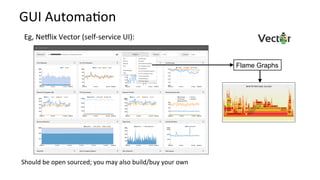
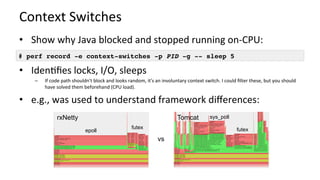
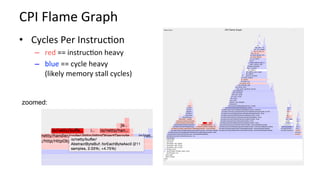
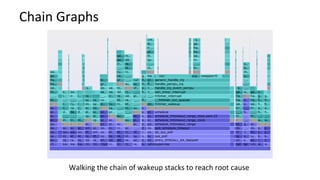
![perf Profiling
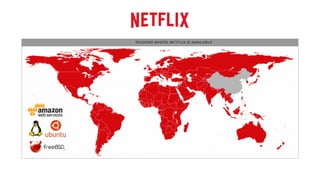
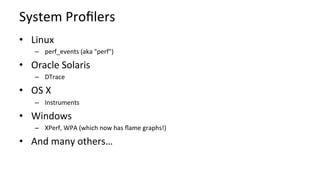
# perf record -F 99 -ag -- sleep 30
[ perf record: Woken up 9 times to write data ]
[ perf record: Captured and wrote 2.745 MB perf.data (~119930 samples) ]
# perf report -n -stdio
[…]
# Overhead Samples Command Shared Object Symbol
# ........ ............ ....... ................. .............................
#
20.42% 605 bash [kernel.kallsyms] [k] xen_hypercall_xen_version
|
--- xen_hypercall_xen_version
check_events
|
|--44.13%-- syscall_trace_enter
| tracesys
| |
| |--35.58%-- __GI___libc_fcntl
| | |
| | |--65.26%-- do_redirection_internal
| | | do_redirections
| | | execute_builtin_or_function
| | | execute_simple_command
[… ~13,000 lines truncated …]
call tree
summary](https://image.slidesharecdn.com/usenixatc2017flamegraphs-170713224624/85/USENIX-ATC-2017-Visualizing-Performance-with-Flame-Graphs-12-320.jpg)
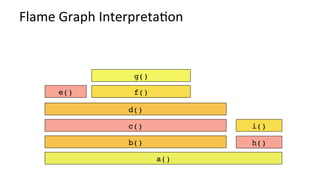
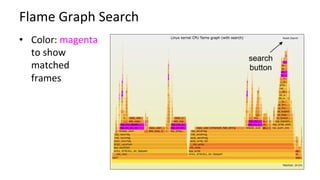
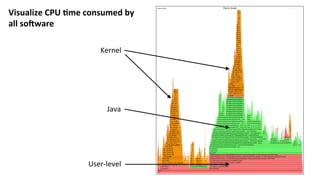
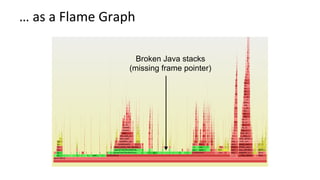
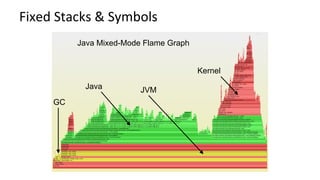
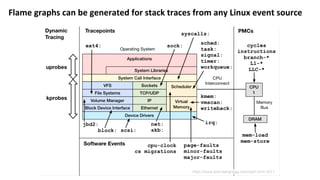
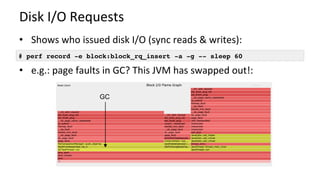
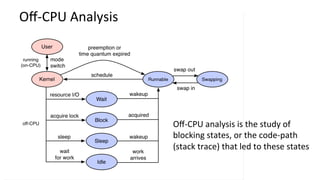
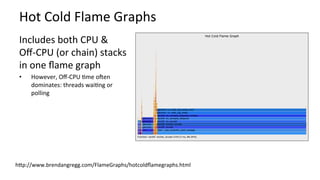
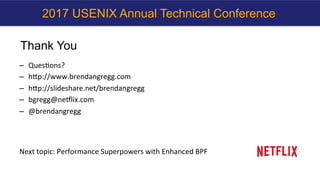
![Broken Stack Traces are Common
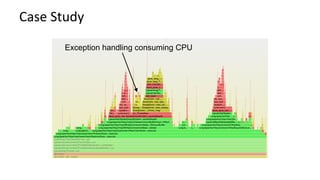
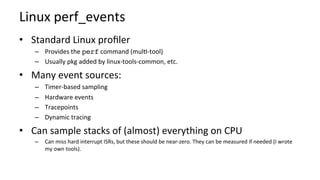
Because:
A. Profilers use frame pointer walking by default
B. Compilers reuse the frame pointer register as a general purpose register: a
(usually very small) performance opKmizaKon.
# perf record –F 99 –a –g – sleep 30
# perf script
[…]
java 4579 cpu-clock:
7f417908c10b [unknown] (/tmp/perf-4458.map)
java 4579 cpu-clock:
7f41792fc65f [unknown] (/tmp/perf-4458.map)
a2d53351ff7da603 [unknown] ([unknown])
[…]](https://image.slidesharecdn.com/usenixatc2017flamegraphs-170713224624/85/USENIX-ATC-2017-Visualizing-Performance-with-Flame-Graphs-26-320.jpg)
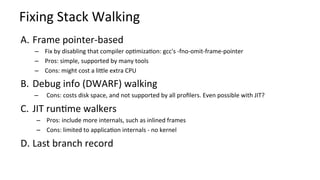
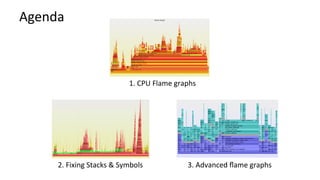
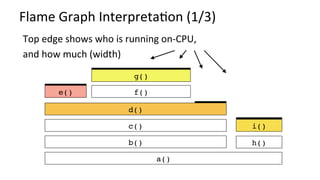
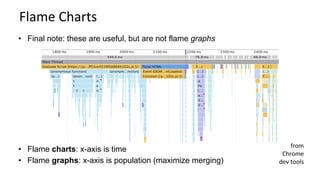
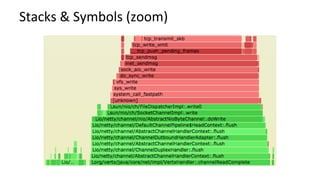
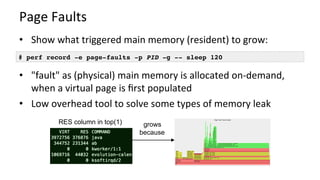
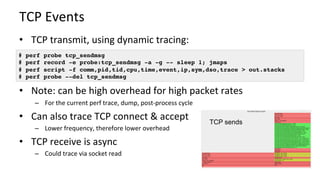
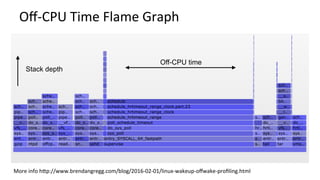
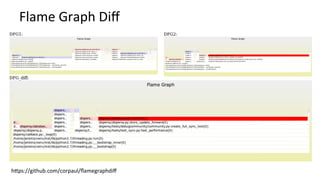
![Fixing Java Stack Traces
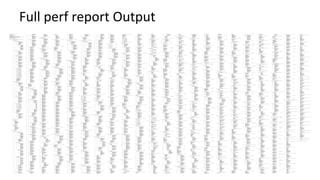
# perf script
[…]
java 8131 cpu-clock:
7fff76f2dce1 [unknown] ([vdso])
7fd3173f7a93 os::javaTimeMillis() (/usr/lib/jvm…
7fd301861e46 [unknown] (/tmp/perf-8131.map)
7fd30184def8 [unknown] (/tmp/perf-8131.map)
7fd30174f544 [unknown] (/tmp/perf-8131.map)
7fd30175d3a8 [unknown] (/tmp/perf-8131.map)
7fd30166d51c [unknown] (/tmp/perf-8131.map)
7fd301750f34 [unknown] (/tmp/perf-8131.map)
7fd3016c2280 [unknown] (/tmp/perf-8131.map)
7fd301b02ec0 [unknown] (/tmp/perf-8131.map)
7fd3016f9888 [unknown] (/tmp/perf-8131.map)
7fd3016ece04 [unknown] (/tmp/perf-8131.map)
7fd30177783c [unknown] (/tmp/perf-8131.map)
7fd301600aa8 [unknown] (/tmp/perf-8131.map)
7fd301a4484c [unknown] (/tmp/perf-8131.map)
7fd3010072e0 [unknown] (/tmp/perf-8131.map)
7fd301007325 [unknown] (/tmp/perf-8131.map)
7fd301007325 [unknown] (/tmp/perf-8131.map)
7fd3010004e7 [unknown] (/tmp/perf-8131.map)
7fd3171df76a JavaCalls::call_helper(JavaValue*,…
7fd3171dce44 JavaCalls::call_virtual(JavaValue*…
7fd3171dd43a JavaCalls::call_virtual(JavaValue*…
7fd31721b6ce thread_entry(JavaThread*, Thread*)…
7fd3175389e0 JavaThread::thread_main_inner() (/…
7fd317538cb2 JavaThread::run() (/usr/lib/jvm/nf…
7fd3173f6f52 java_start(Thread*) (/usr/lib/jvm/…
7fd317a7e182 start_thread (/lib/x86_64-linux-gn…
# perf script
[…]
java 4579 cpu-clock:
7f417908c10b [unknown] (/tmp/…
java 4579 cpu-clock:
7f41792fc65f [unknown] (/tmp/…
a2d53351ff7da603 [unknown] ([unkn…
[…]
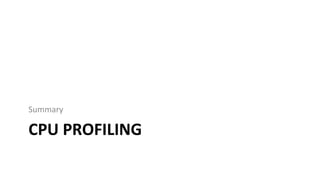
I prototyped JVM frame
pointers. Oracle rewrote it
and added it to Java as
-XX:+PreserveFramePointer
(JDK 8 u60b19)](https://image.slidesharecdn.com/usenixatc2017flamegraphs-170713224624/85/USENIX-ATC-2017-Visualizing-Performance-with-Flame-Graphs-29-320.jpg)

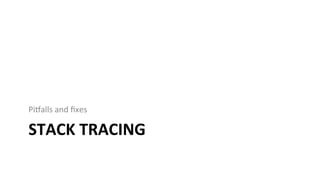
![Fixing JIT Symbols (Java, Node.js, …)
• Just-in-Kme runKmes don't have a pre-compiled symbol table
• So Linux perf looks for an externally provided JIT symbol
file: /tmp/perf-PID.map
• This can be created by runKmes; eg, Java's perf-map-agent
# perf script
Failed to open /tmp/perf-8131.map, continuing without symbols
[…]
java 8131 cpu-clock:
7fff76f2dce1 [unknown] ([vdso])
7fd3173f7a93 os::javaTimeMillis() (/usr/lib/jvm…
7fd301861e46 [unknown] (/tmp/perf-8131.map)
[…]](https://image.slidesharecdn.com/usenixatc2017flamegraphs-170713224624/85/USENIX-ATC-2017-Visualizing-Performance-with-Flame-Graphs-35-320.jpg)
![Containers
• perf can't find any symbol sources
– Unless you copy them into the host
• I'm tesKng Krister Johansen's fix, hopefully for Linux 4.13
– lkml: "[PATCH Kp/perf/core 0/7] namespace tracing improvements"](https://image.slidesharecdn.com/usenixatc2017flamegraphs-170713224624/85/USENIX-ATC-2017-Visualizing-Performance-with-Flame-Graphs-39-320.jpg)

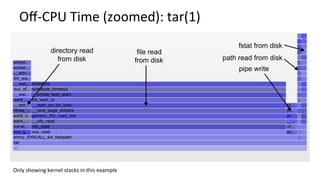
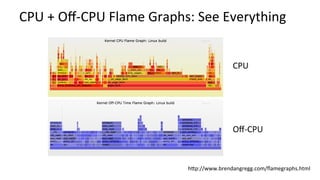
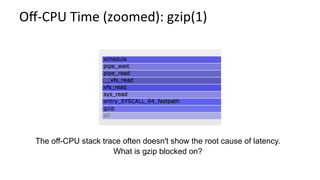
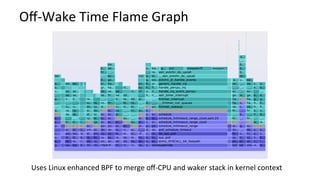

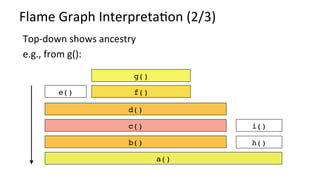
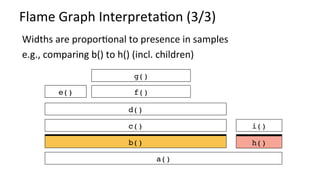
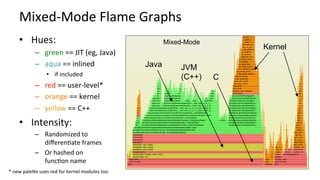
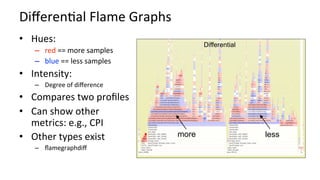
The document discusses the visualization of CPU performance using flame graphs, presenting techniques for profiling CPU usage and interpreting the visualized data. It emphasizes the importance of capturing accurate stack traces and symbols for effective analysis while providing instructions for generating flame graphs using various profilers on different operating systems. Additionally, it includes advanced techniques like mixed-mode flame graphs and the use of BPF for improved performance analysis.


![[232] 성능어디까지쥐어짜봤니 송태웅](https://cdn.slidesharecdn.com/ss_thumbnails/232-161025013504-thumbnail.jpg?width=640&height=640&fit=bounds)