Download as PDF, PPTX
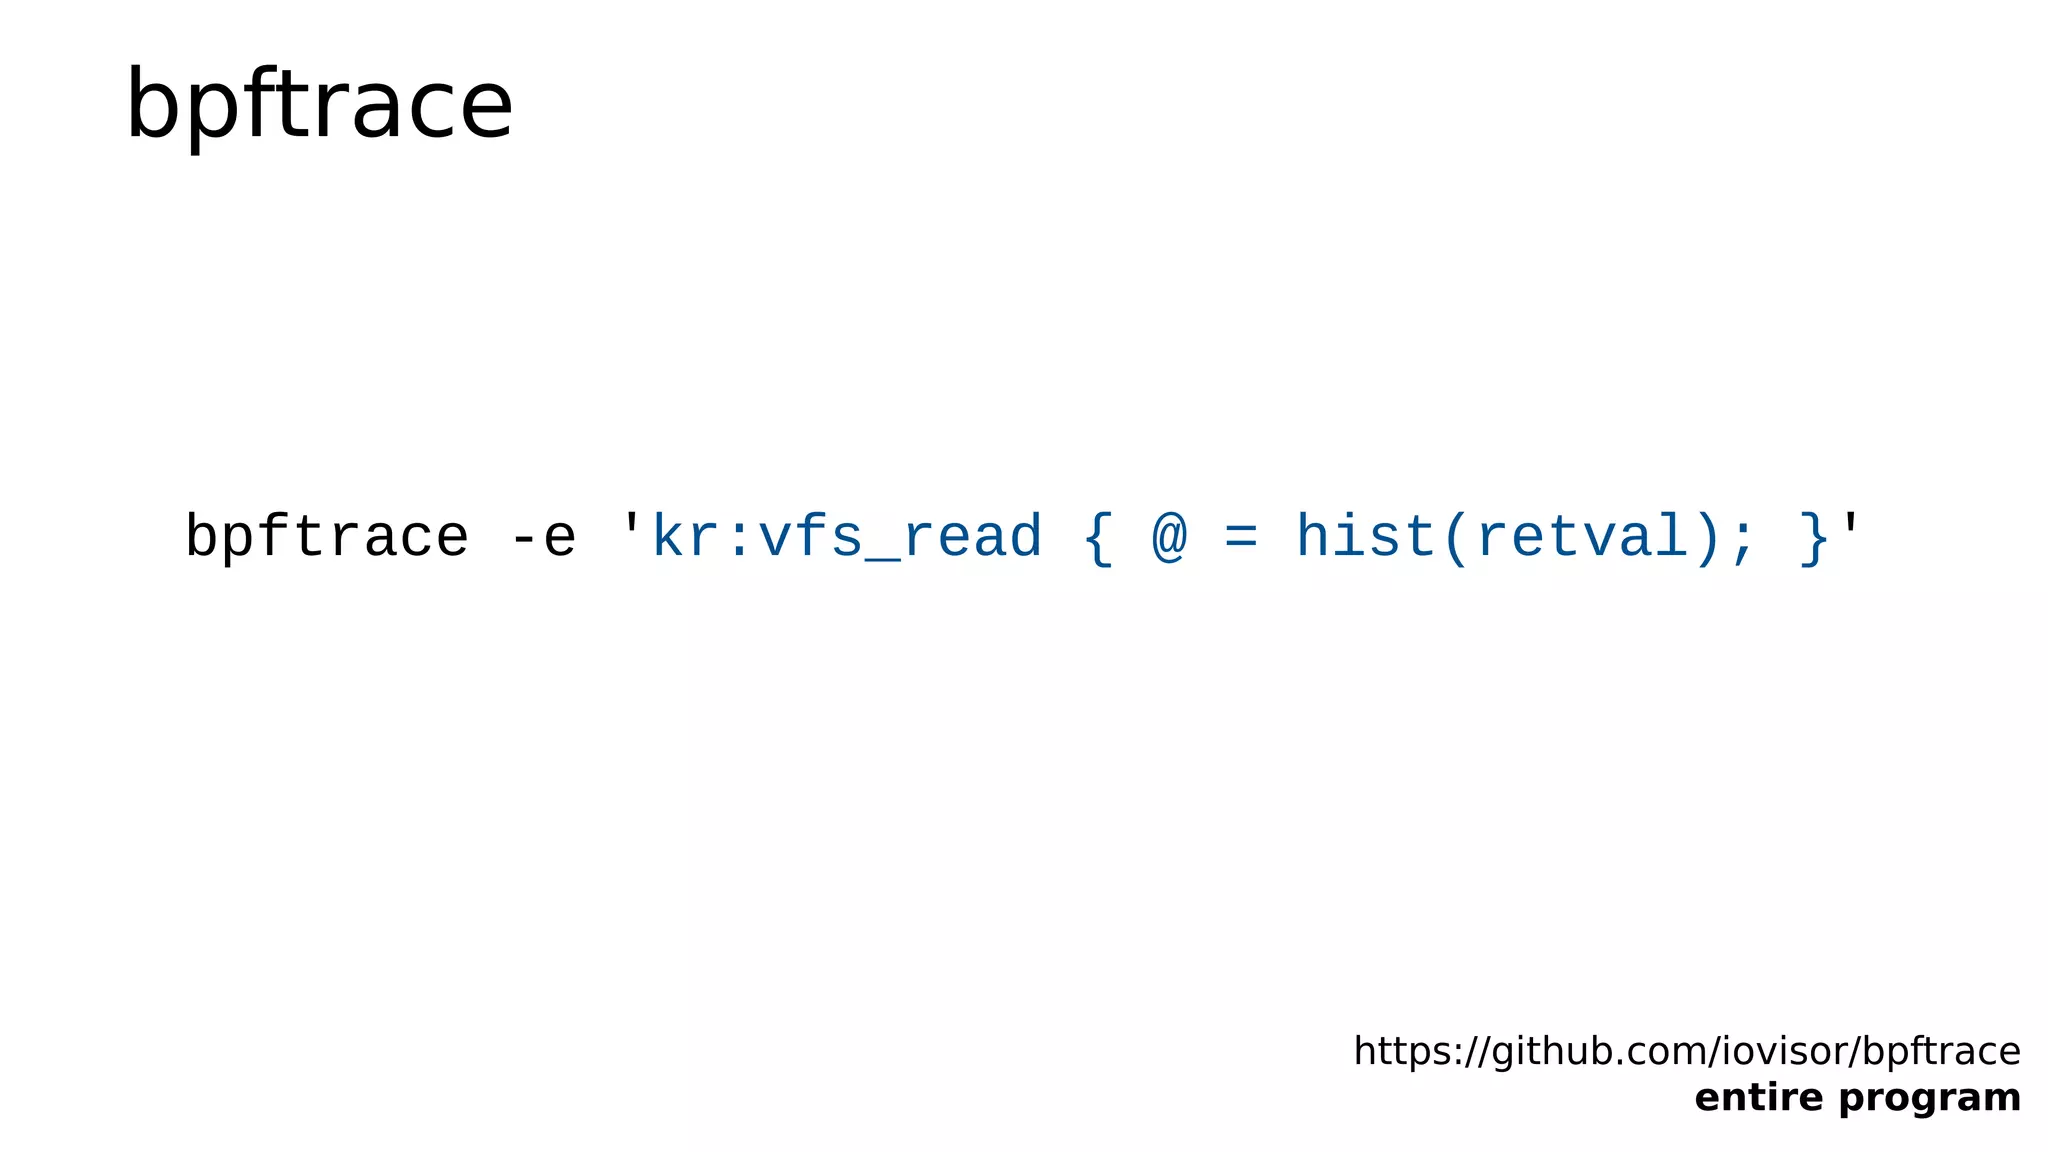
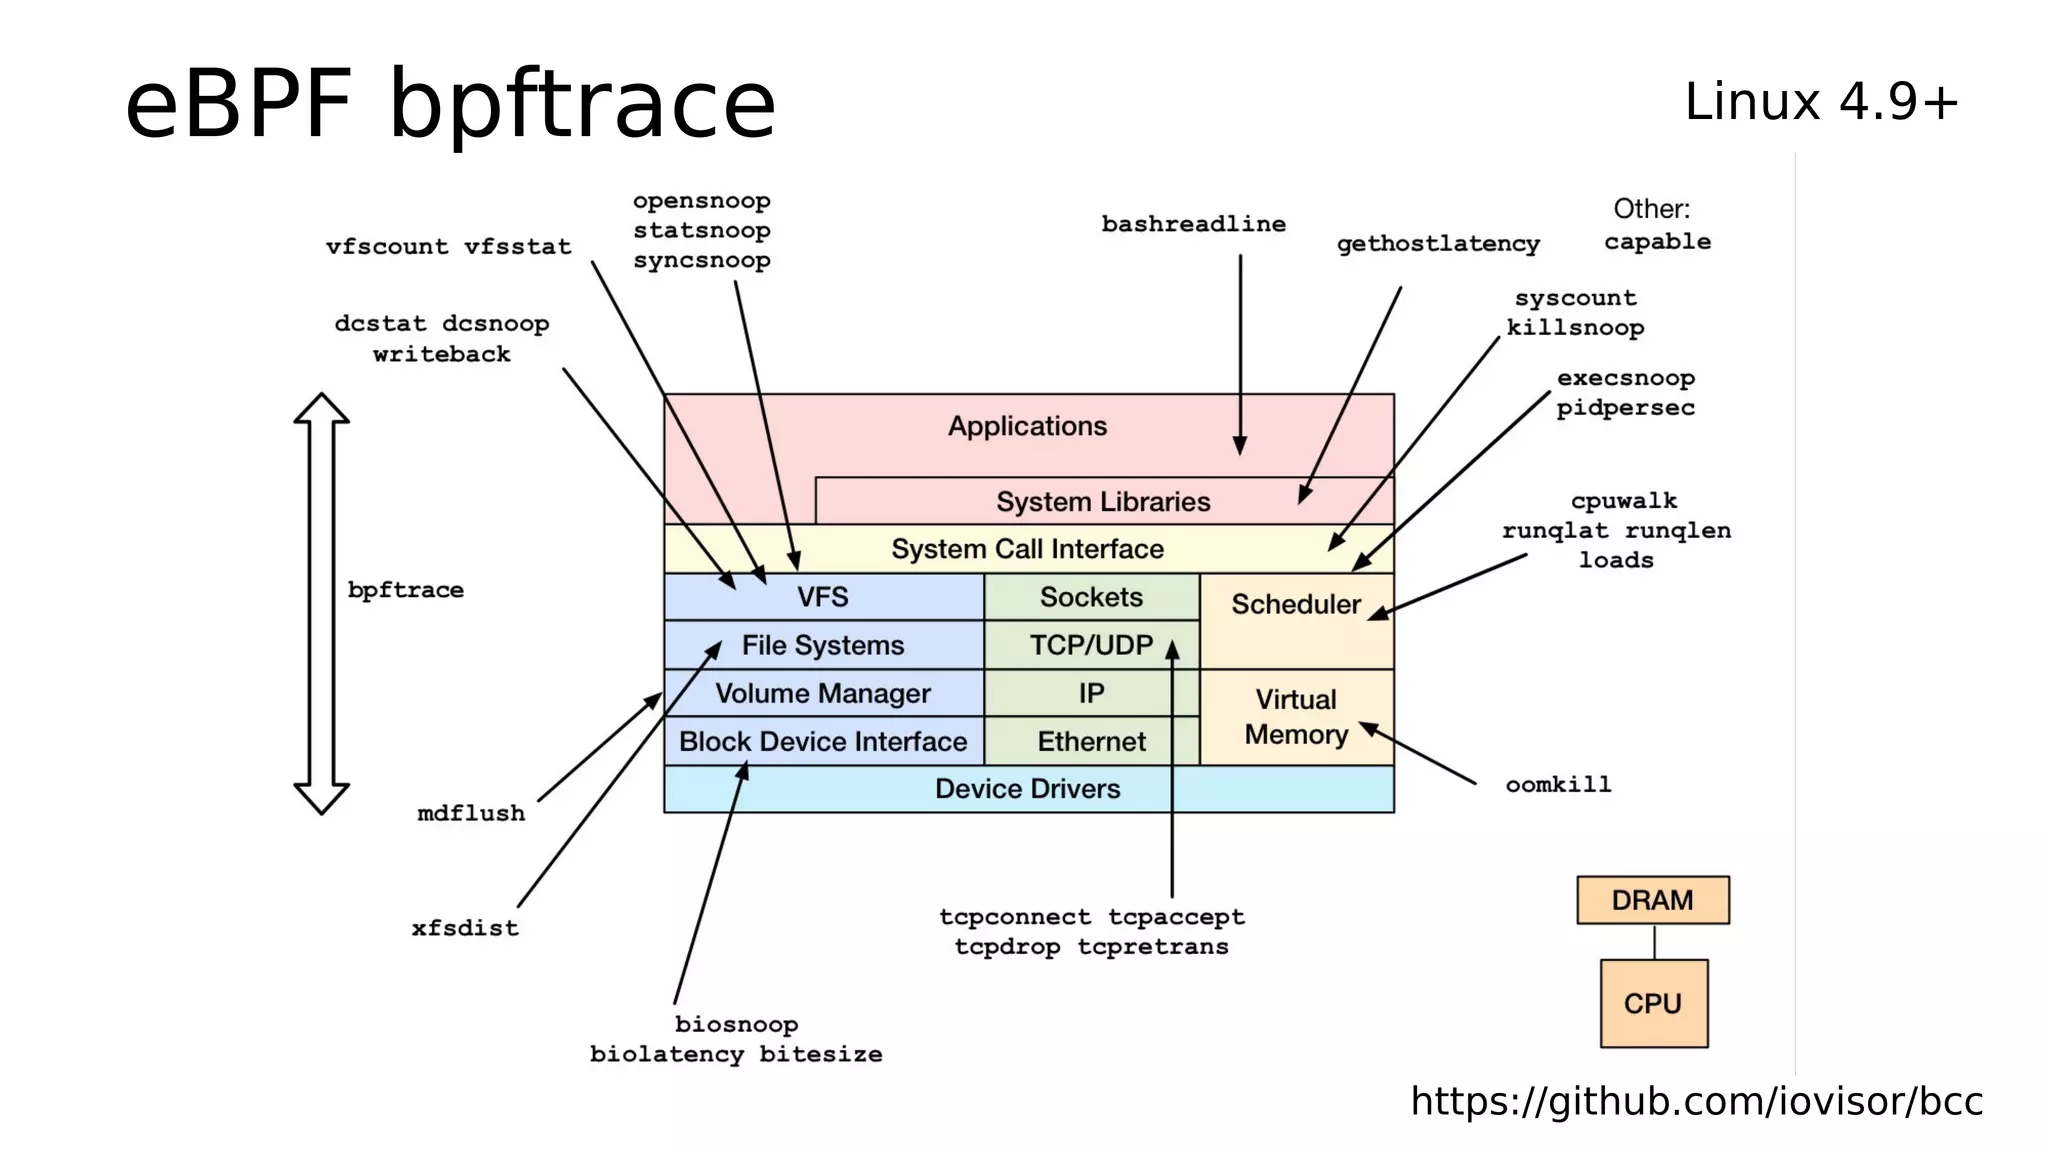
![eBPF bpftrace (aka BPFtrace) Linux 4.9+
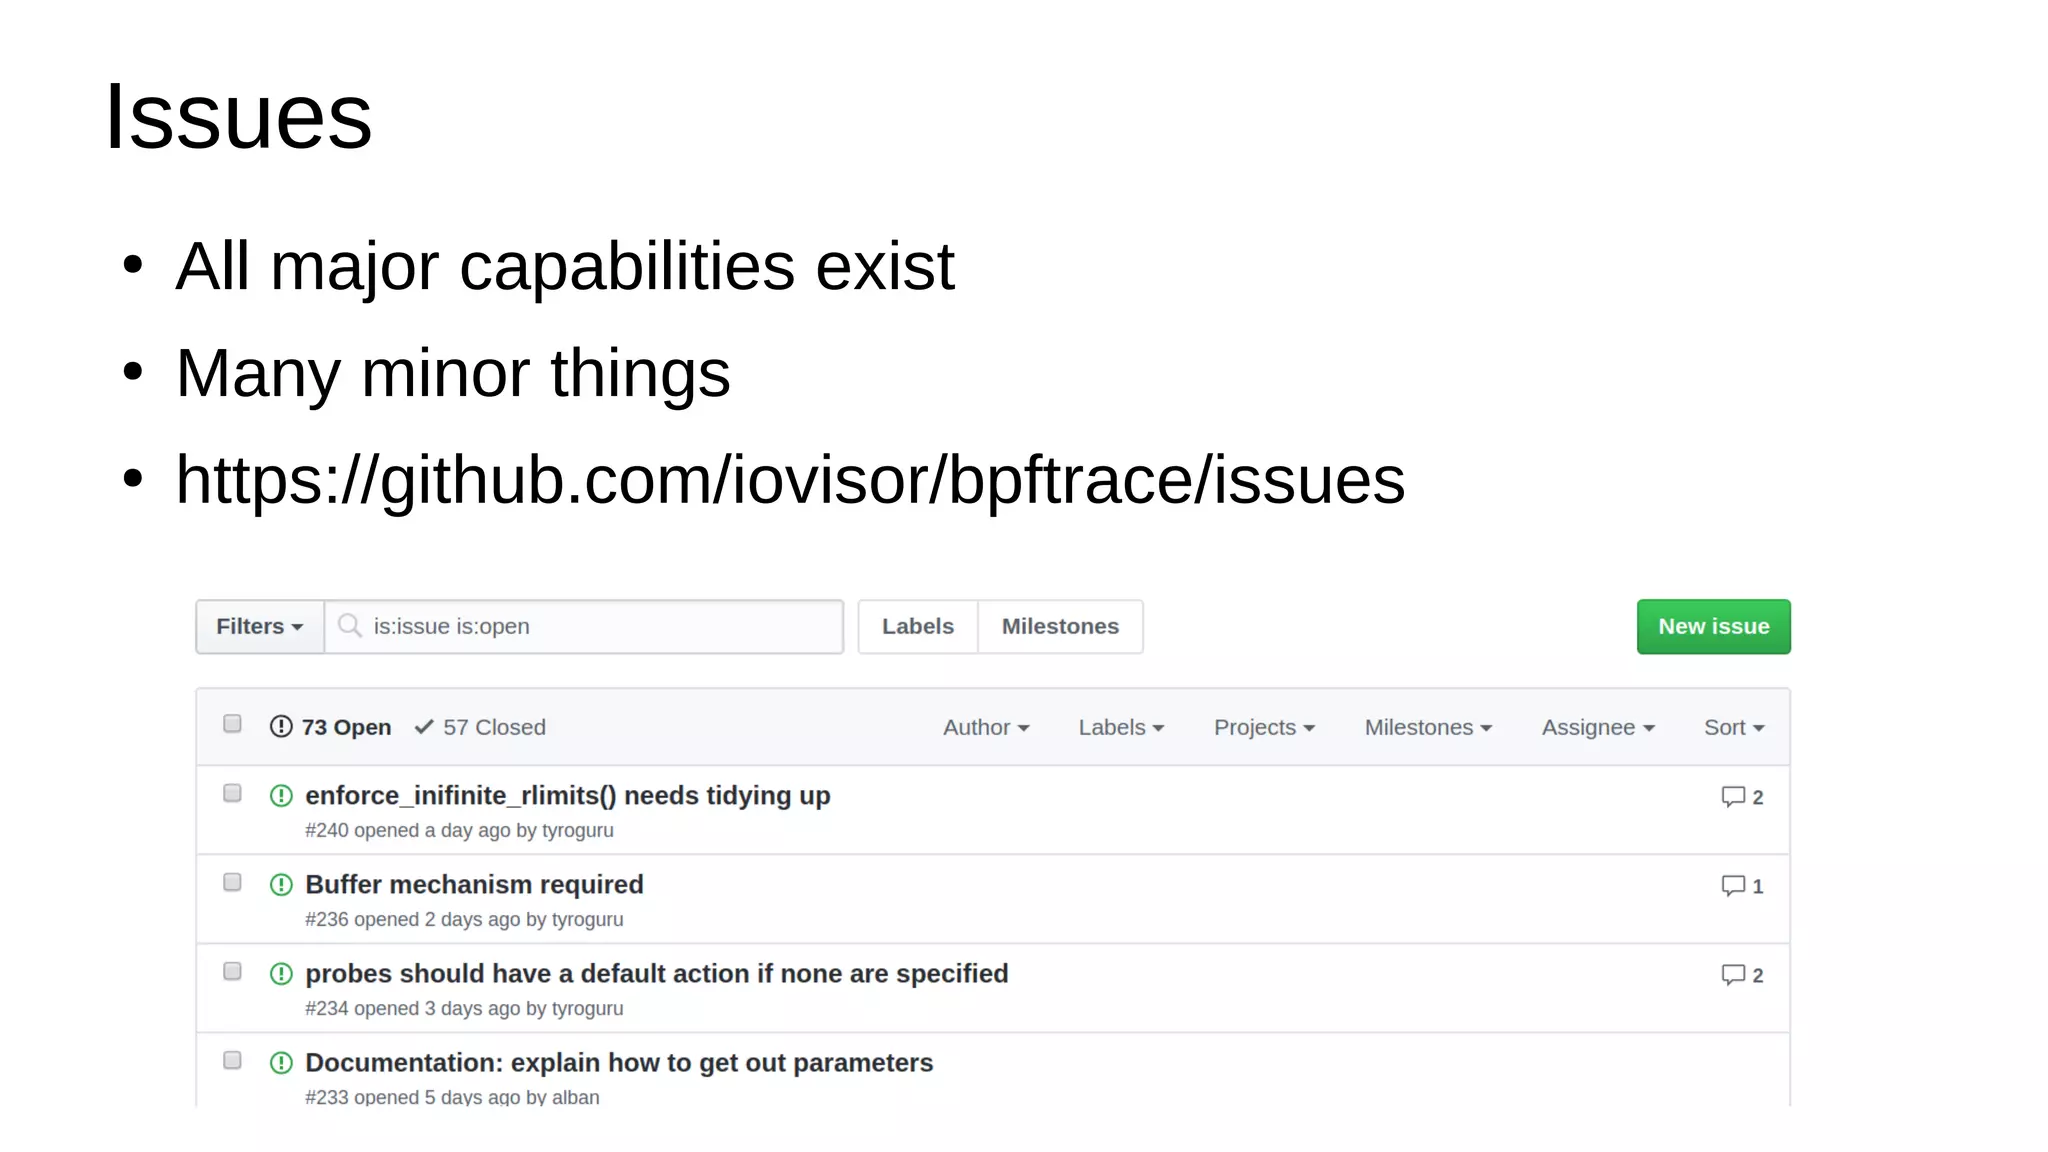
https://github.com/iovisor/bpftrace
# Files opened by process
bpftrace -e 't:syscalls:sys_enter_open { printf("%s %sn", comm,
str(args->filename)) }'
# Read size distribution by process
bpftrace -e 't:syscalls:sys_exit_read { @[comm] = hist(args->ret) }'
# Count VFS calls
bpftrace -e 'kprobe:vfs_* { @[func]++ }'
# Show vfs_read latency as a histogram
bpftrace -e 'k:vfs_read { @[tid] = nsecs }
kr:vfs_read /@[tid]/ { @ns = hist(nsecs - @[tid]); delete(@tid) }’
# Trace user-level function
Bpftrace -e 'uretprobe:bash:readline { printf(“%sn”, str(retval)) }’
…](https://image.slidesharecdn.com/ebpfperftools2019-190310010642/75/eBPF-Perf-Tools-2019-5-2048.jpg)
![e.g., identify multimodal disk I/O latency and outliers
with bcc/eBPF biolatency
# biolatency -mT 10
Tracing block device I/O... Hit Ctrl-C to end.
19:19:04
msecs : count distribution
0 -> 1 : 238 |********* |
2 -> 3 : 424 |***************** |
4 -> 7 : 834 |********************************* |
8 -> 15 : 506 |******************** |
16 -> 31 : 986 |****************************************|
32 -> 63 : 97 |*** |
64 -> 127 : 7 | |
128 -> 255 : 27 |* |
19:19:14
msecs : count distribution
0 -> 1 : 427 |******************* |
2 -> 3 : 424 |****************** |
[…]](https://image.slidesharecdn.com/ebpfperftools2019-190310010642/75/eBPF-Perf-Tools-2019-12-2048.jpg)
![bcc/eBPF programs can be laborious: biolatency
# define BPF program
bpf_text = """
#include <uapi/linux/ptrace.h>
#include <linux/blkdev.h>
typedef struct disk_key {
char disk[DISK_NAME_LEN];
u64 slot;
} disk_key_t;
BPF_HASH(start, struct request *);
STORAGE
// time block I/O
int trace_req_start(struct pt_regs *ctx, struct request *req)
{
u64 ts = bpf_ktime_get_ns();
start.update(&req, &ts);
return 0;
}
// output
int trace_req_completion(struct pt_regs *ctx, struct request *req)
{
u64 *tsp, delta;
// fetch timestamp and calculate delta
tsp = start.lookup(&req);
if (tsp == 0) {
return 0; // missed issue
}
delta = bpf_ktime_get_ns() - *tsp;
FACTOR
// store as histogram
STORE
start.delete(&req);
return 0;
}
"""
# code substitutions
if args.milliseconds:
bpf_text = bpf_text.replace('FACTOR', 'delta /= 1000000;')
label = "msecs"
else:
bpf_text = bpf_text.replace('FACTOR', 'delta /= 1000;')
label = "usecs"
if args.disks:
bpf_text = bpf_text.replace('STORAGE',
'BPF_HISTOGRAM(dist, disk_key_t);')
bpf_text = bpf_text.replace('STORE',
'disk_key_t key = {.slot = bpf_log2l(delta)}; ' +
'void *__tmp = (void *)req->rq_disk->disk_name; ' +
'bpf_probe_read(&key.disk, sizeof(key.disk), __tmp); ' +
'dist.increment(key);')
else:
bpf_text = bpf_text.replace('STORAGE', 'BPF_HISTOGRAM(dist);')
bpf_text = bpf_text.replace('STORE',
'dist.increment(bpf_log2l(delta));')
if debug or args.ebpf:
print(bpf_text)
if args.ebpf:
exit()
# load BPF program
b = BPF(text=bpf_text)
if args.queued:
b.attach_kprobe(event="blk_account_io_start", fn_name="trace_req_start")
else:
b.attach_kprobe(event="blk_start_request", fn_name="trace_req_start")
b.attach_kprobe(event="blk_mq_start_request", fn_name="trace_req_start")
b.attach_kprobe(event="blk_account_io_completion",
fn_name="trace_req_completion")
print("Tracing block device I/O... Hit Ctrl-C to end.")
# output
exiting = 0 if args.interval else 1
dist = b.get_table("dist")
while (1):
try:
sleep(int(args.interval))
except KeyboardInterrupt:
exiting = 1
print()
if args.timestamp:
print("%-8sn" % strftime("%H:%M:%S"), end="")
dist.print_log2_hist(label, "disk")
dist.clear()
countdown -= 1
if exiting or countdown == 0:
exit()](https://image.slidesharecdn.com/ebpfperftools2019-190310010642/75/eBPF-Perf-Tools-2019-13-2048.jpg)
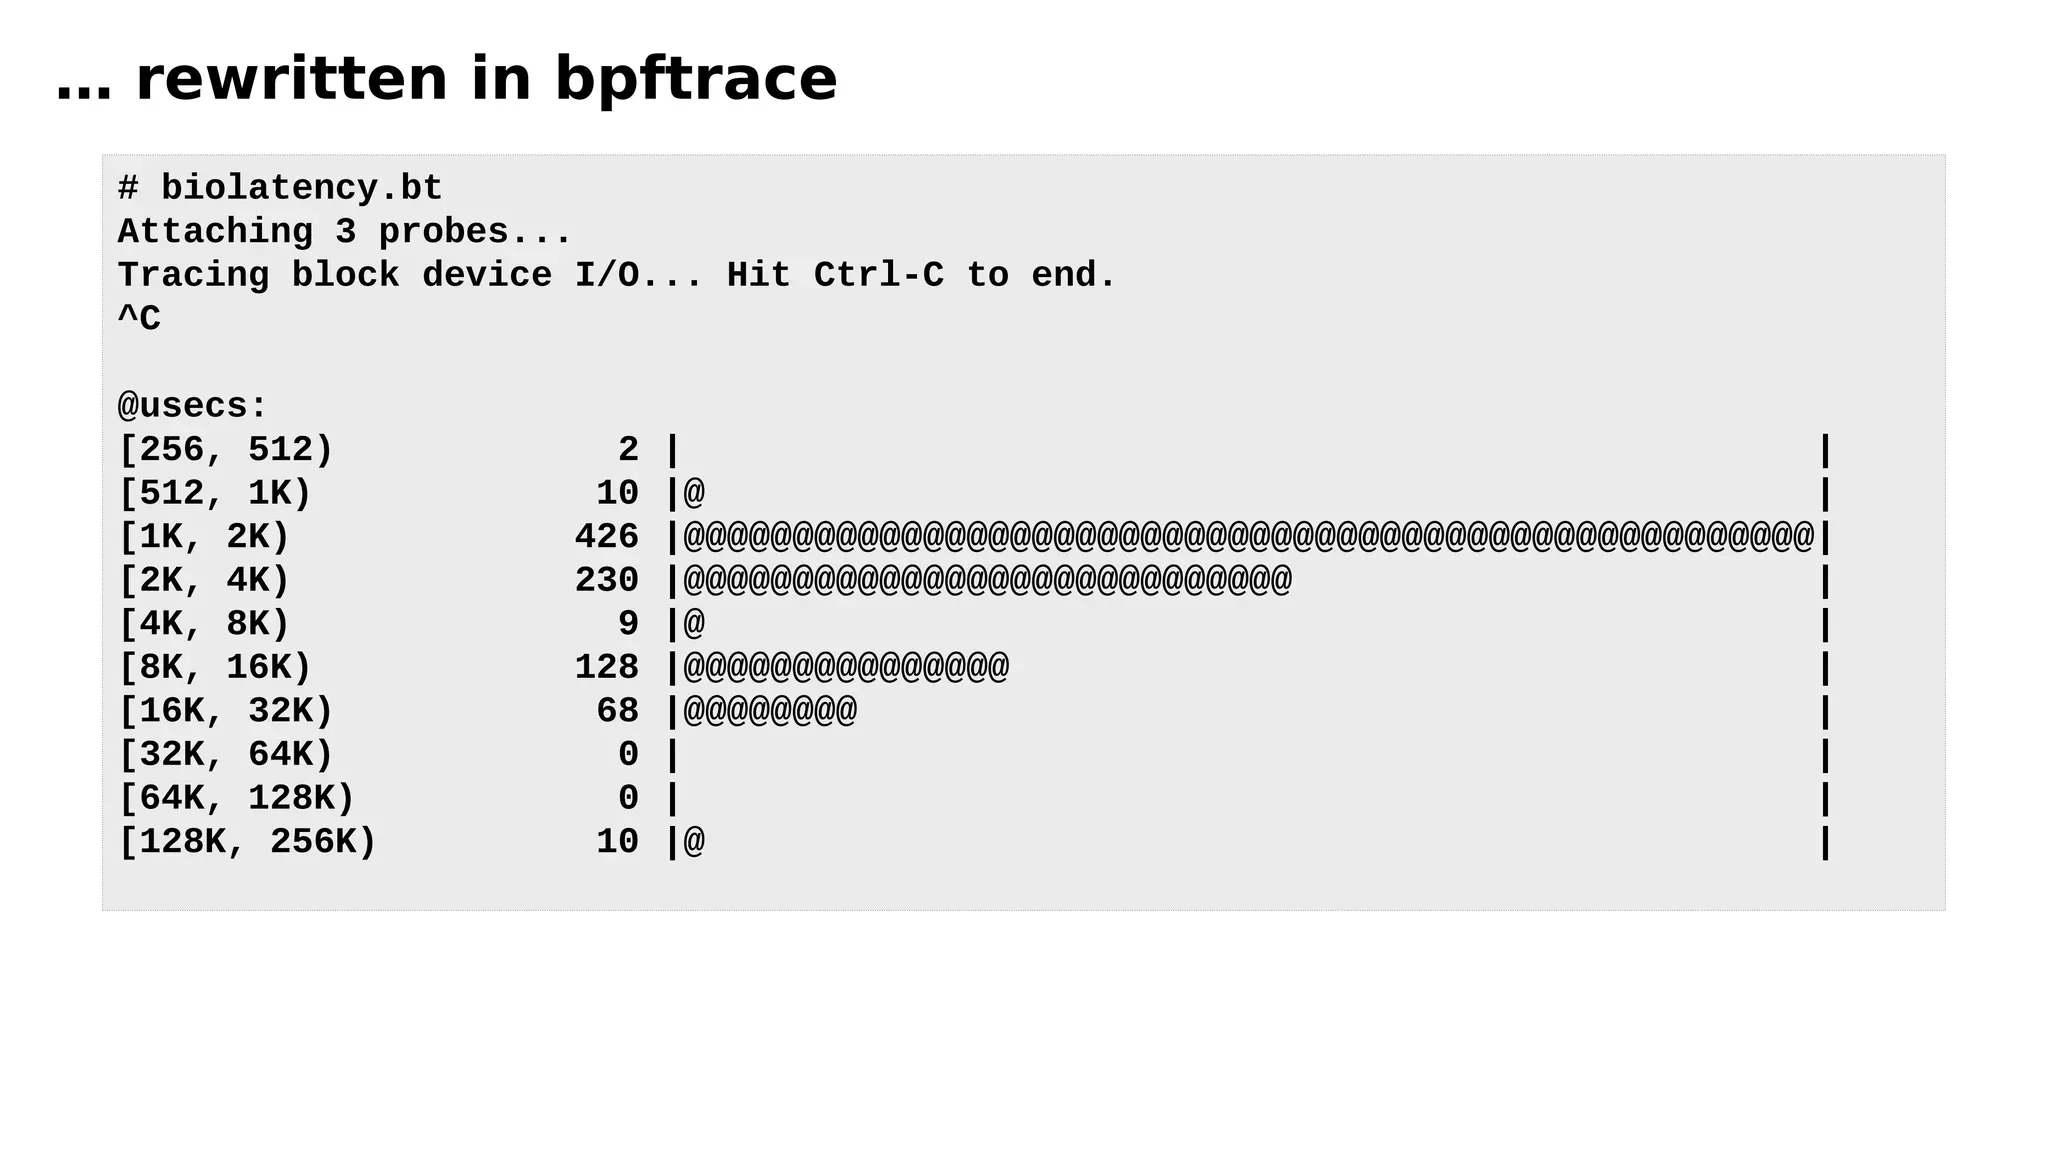
![… rewritten in bpftrace (launched Oct 2018)!
#!/usr/local/bin/bpftrace
BEGIN
{
printf("Tracing block device I/O... Hit Ctrl-C to end.n");
}
kprobe:blk_account_io_start
{
@start[arg0] = nsecs;
}
kprobe:blk_account_io_completion
/@start[arg0]/
{
@usecs = hist((nsecs - @start[arg0]) / 1000);
delete(@start[arg0]);
}](https://image.slidesharecdn.com/ebpfperftools2019-190310010642/75/eBPF-Perf-Tools-2019-14-2048.jpg)


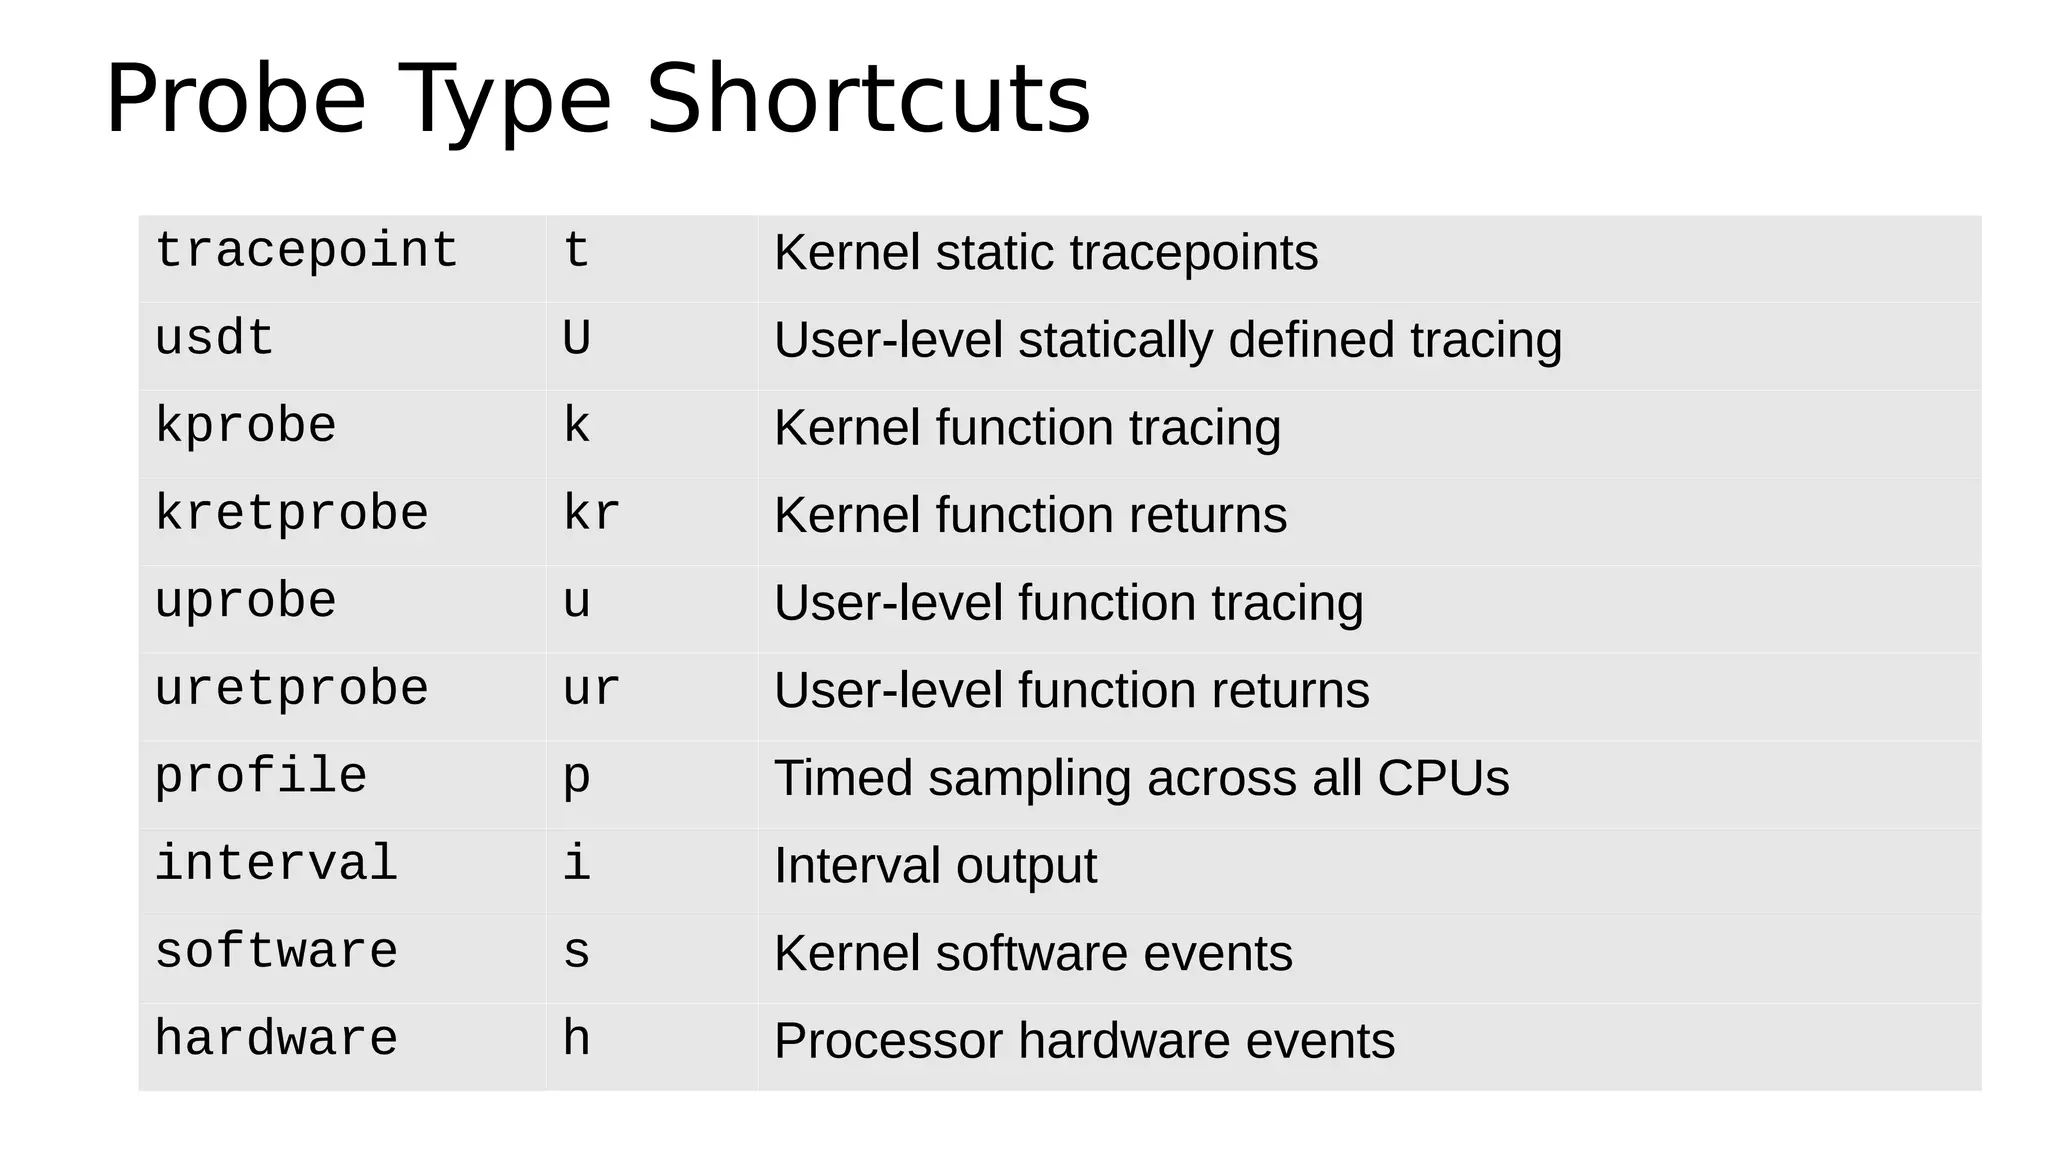
![bpftrace Syntax
bpftrace -e ‘k:do_nanosleep /pid > 100/ { @[comm]++ }’
Probe
Filter
(optional)
Action](https://image.slidesharecdn.com/ebpfperftools2019-190310010642/75/eBPF-Perf-Tools-2019-22-2048.jpg)
![Filters
● /pid == 181/
● /comm != “sshd”/
● /@ts[tid]/](https://image.slidesharecdn.com/ebpfperftools2019-190310010642/75/eBPF-Perf-Tools-2019-25-2048.jpg)
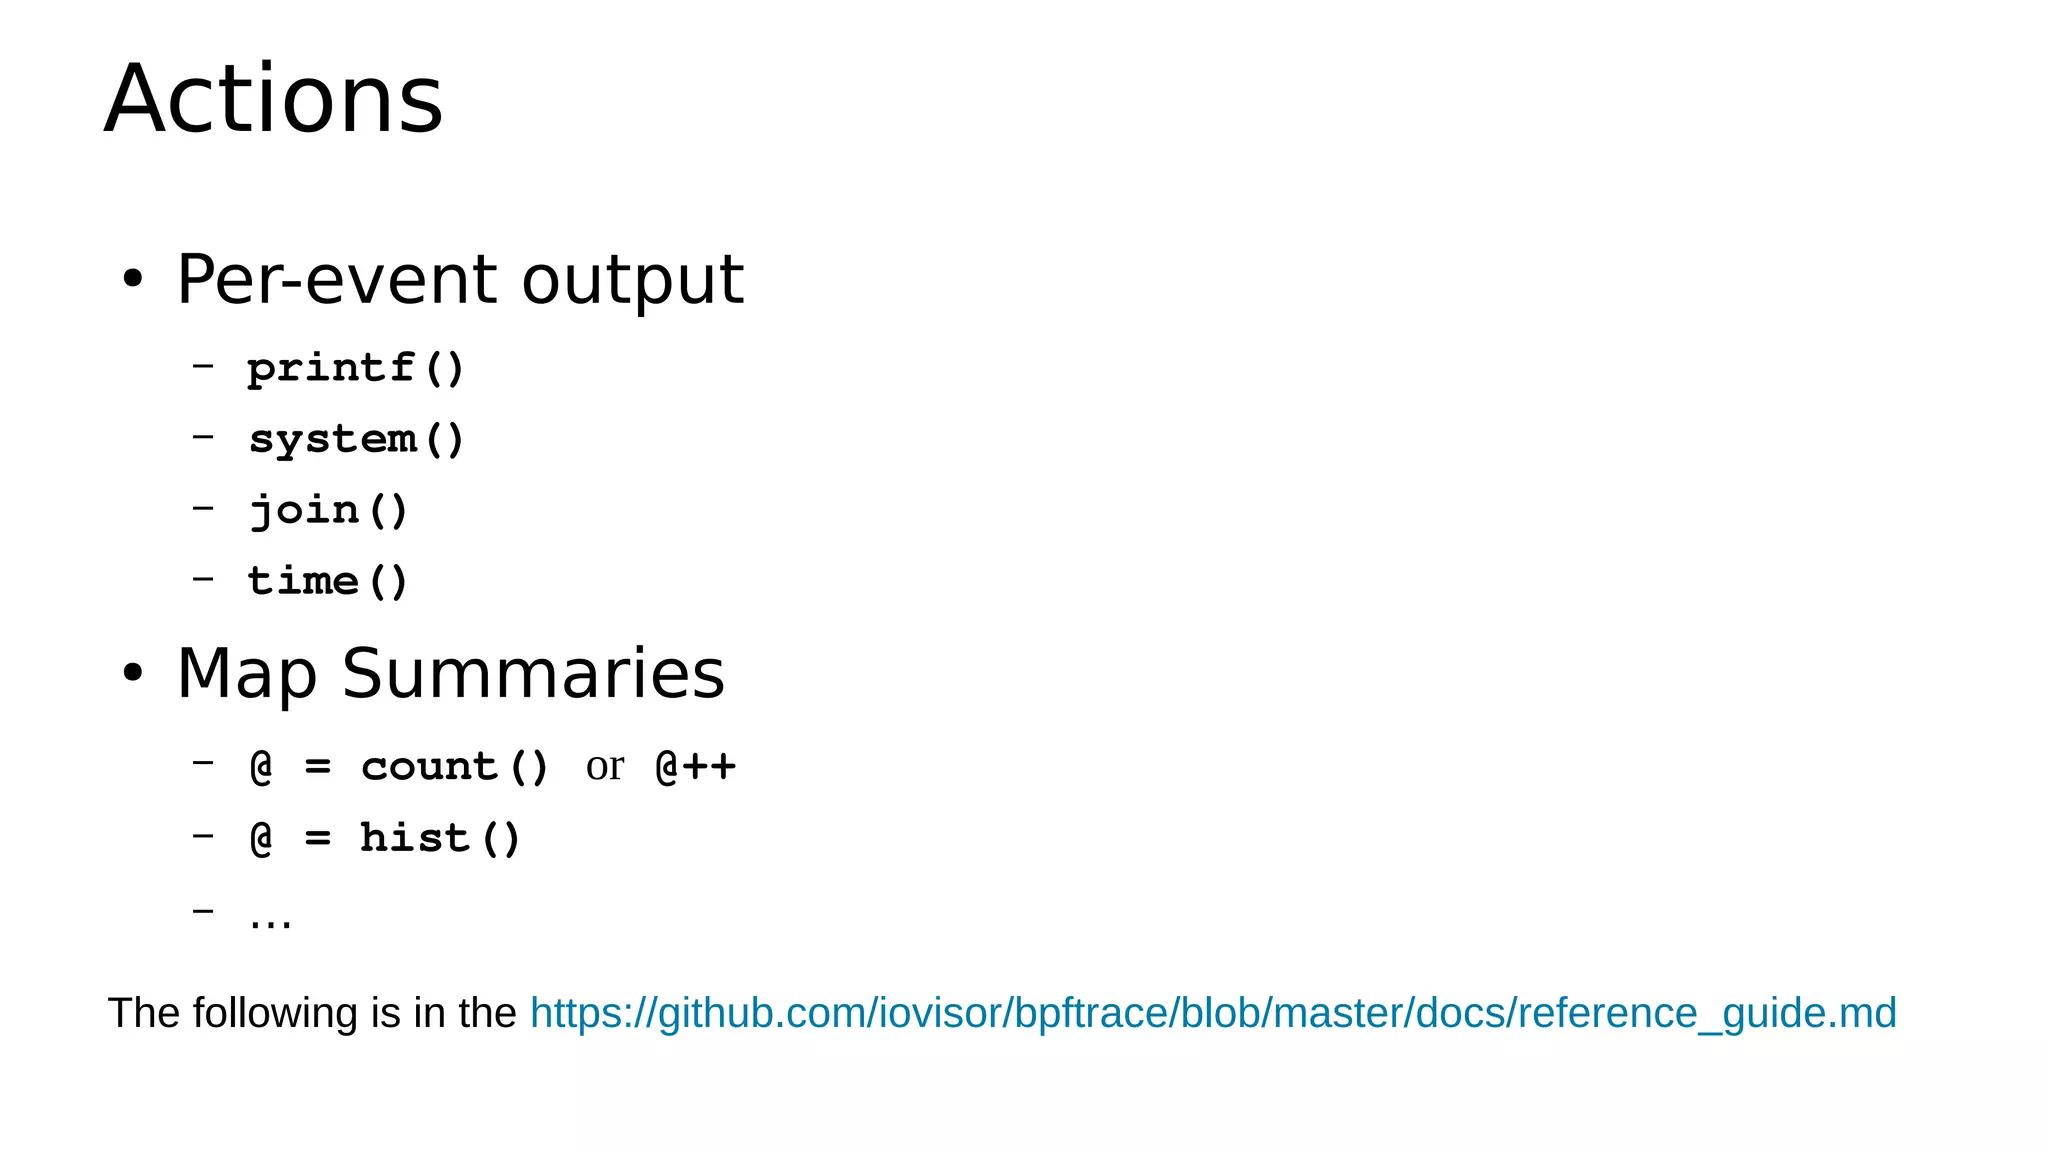
![Functions
●
hist(n) Log2 histogram
●
lhist(n, min, max, step) Linear hist.
●
count() Count events
●
sum(n) Sum value
●
min(n) Minimum value
●
max(n) Maximum value
●
avg(n) Average value
●
stats(n) Statistics
●
str(s) String
●
sym(p) Resolve kernel addr
●
usym(p) Resolve user addr
●
kaddr(n) Resolve kernel symbol
●
uaddr(n) Resolve user symbol
●
printf(fmt, ...) Print formatted
●
print(@x[, top[, div]]) Print map
●
delete(@x) Delete map element
●
clear(@x) Delete all keys/values
●
reg(n) Register lookup
●
join(a) Join string array
●
time(fmt) Print formatted time
●
system(fmt) Run shell command
●
exit() Quit bpftrace](https://image.slidesharecdn.com/ebpfperftools2019-190310010642/75/eBPF-Perf-Tools-2019-27-2048.jpg)
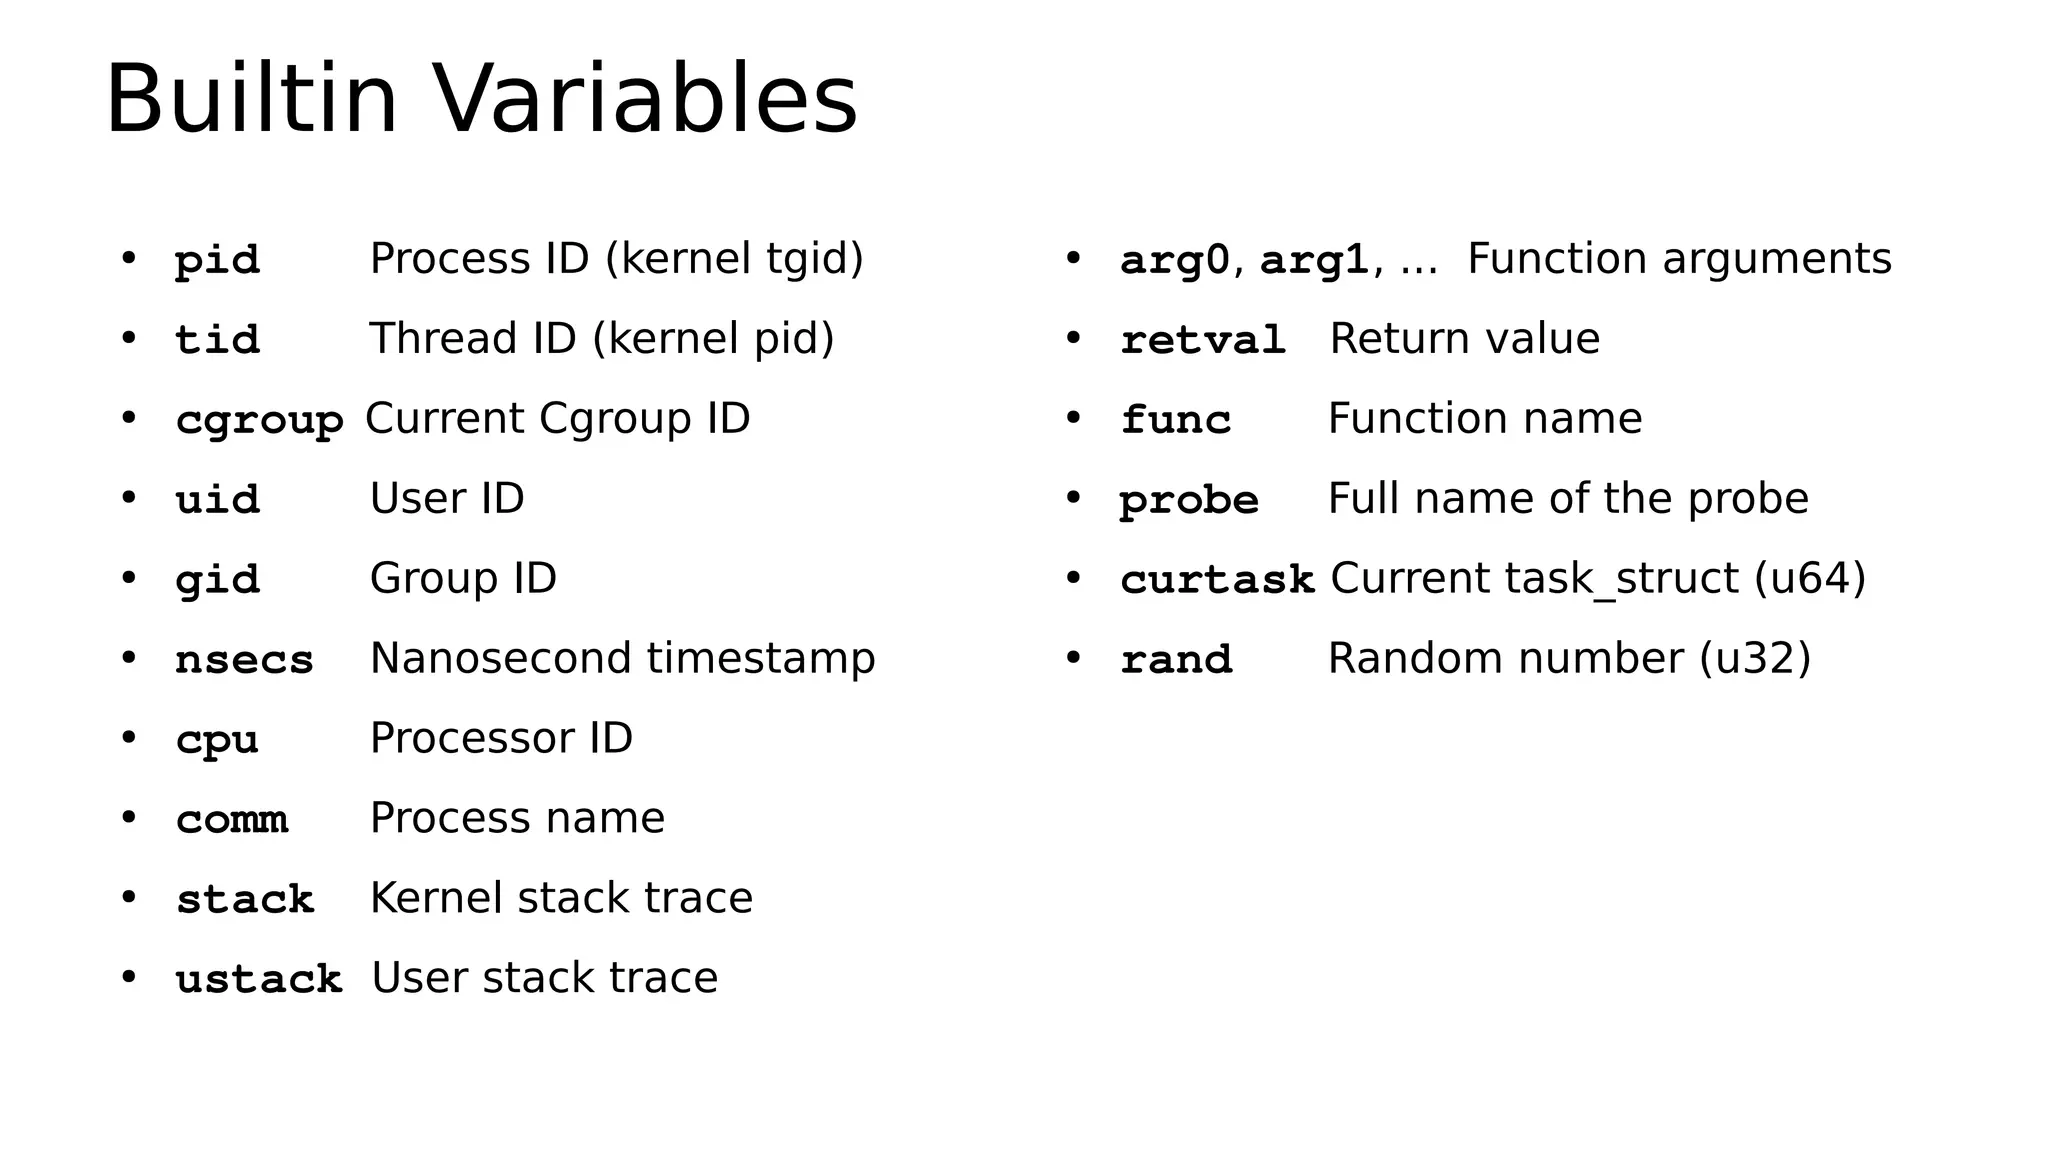
![Variable Types
●
Basic Variables
– @global
– @thread_local[tid]
– $scratch
●
Associative Arrays
– @array[key] = value
●
Buitins
– pid
– ...](https://image.slidesharecdn.com/ebpfperftools2019-190310010642/75/eBPF-Perf-Tools-2019-28-2048.jpg)
![biolatency (again)
#!/usr/local/bin/bpftrace
BEGIN
{
printf("Tracing block device I/O... Hit Ctrl-C to end.n");
}
kprobe:blk_account_io_start
{
@start[arg0] = nsecs;
}
kprobe:blk_account_io_completion
/@start[arg0]/
{
@usecs = hist((nsecs - @start[arg0]) / 1000);
delete(@start[arg0]);
}](https://image.slidesharecdn.com/ebpfperftools2019-190310010642/75/eBPF-Perf-Tools-2019-30-2048.jpg)


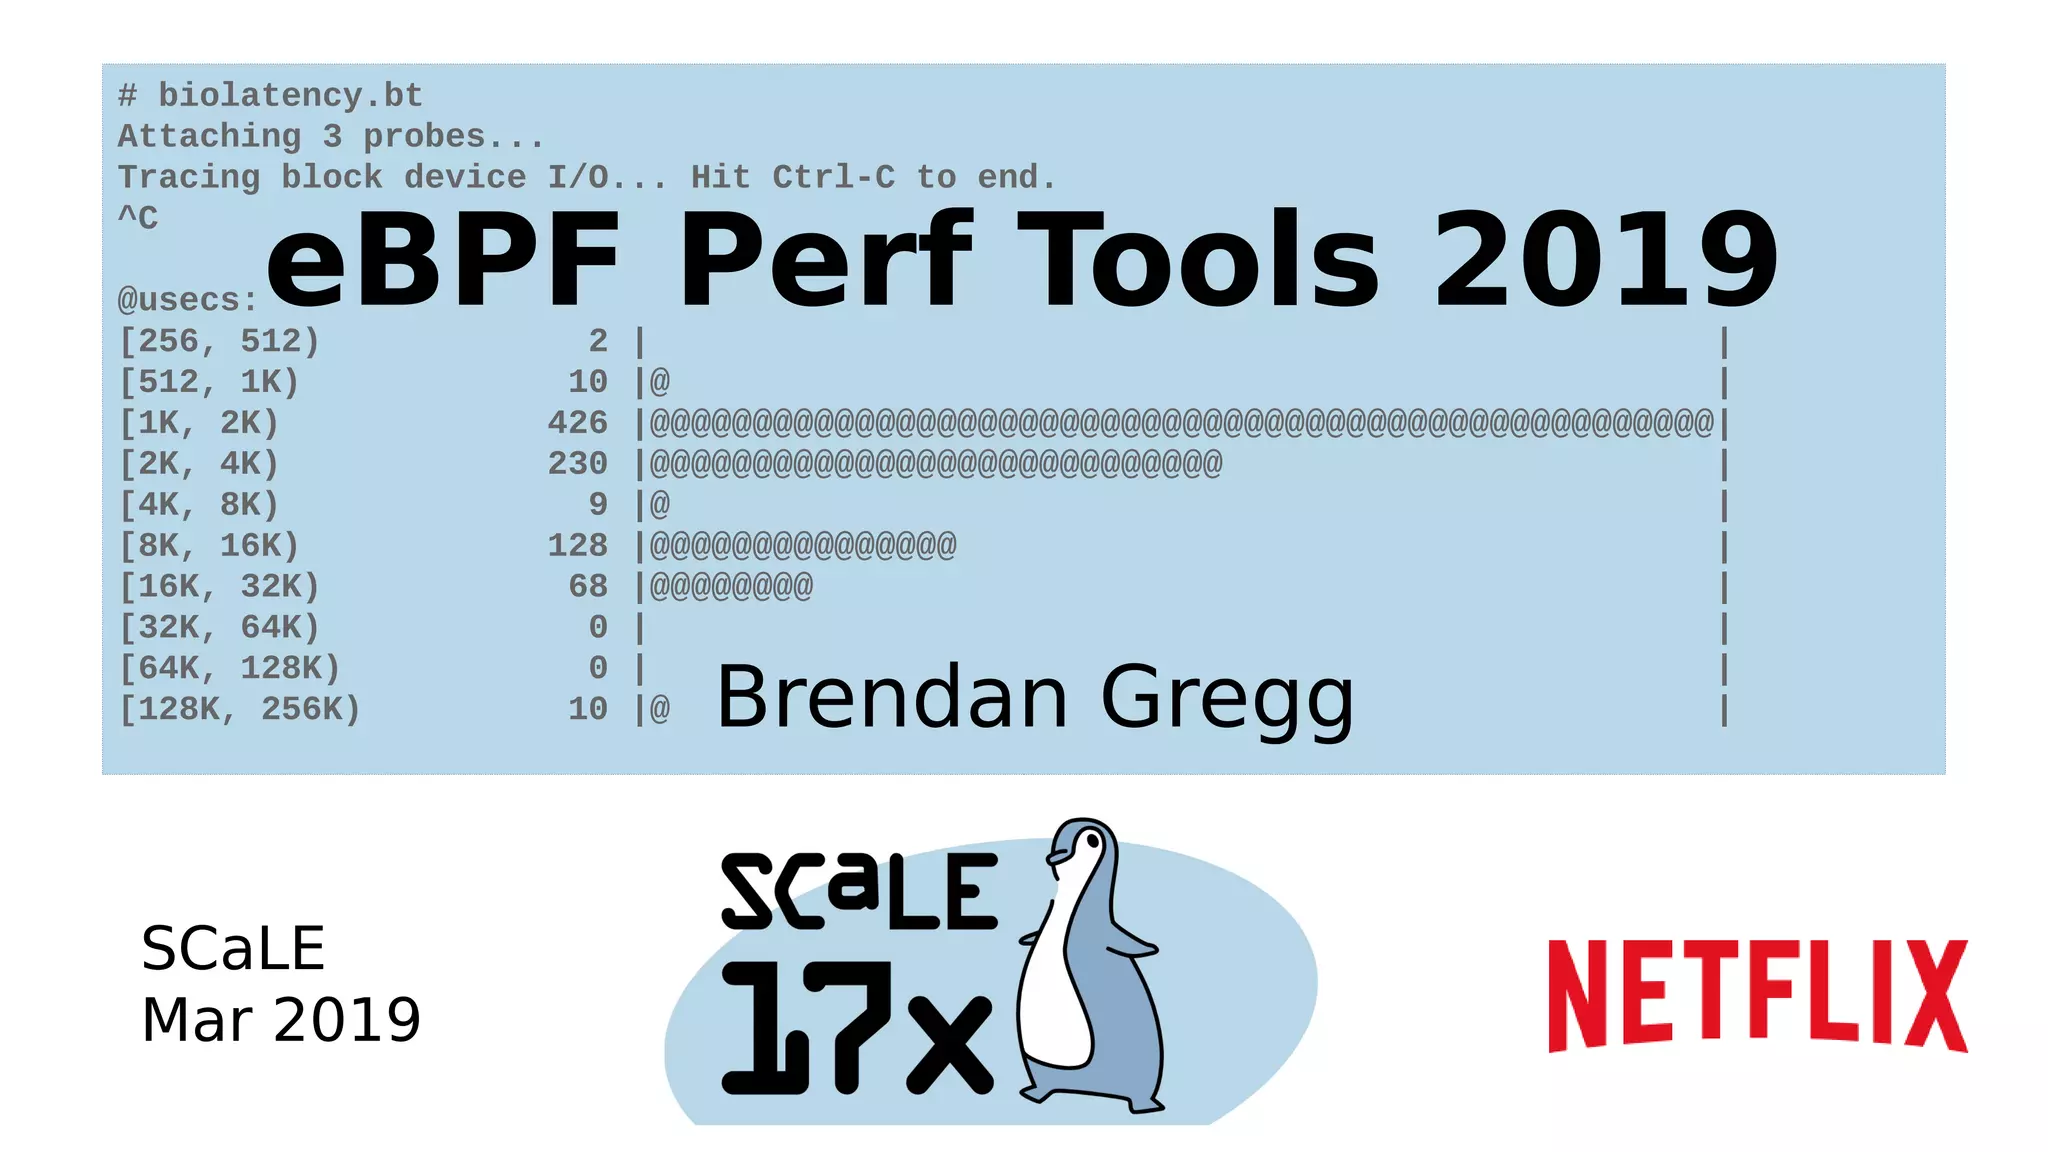
The document describes a biolatency tool that traces block device I/O latency using eBPF. It discusses how the tool was originally written in the bcc framework using C/BPF, but has since been rewritten in the bpftrace framework using a simpler one-liner script. It provides examples of the bcc and bpftrace implementations of biolatency.


![[232] 성능어디까지쥐어짜봤니 송태웅](https://cdn.slidesharecdn.com/ss_thumbnails/232-161025013504-thumbnail.jpg?width=640&height=640&fit=bounds)