Downloaded 619 times
![CALCULATING THE HPI -1
The formula to calculate the HPI-1 is as
follows :
HPI -1 = [1/3 ( P1 α + P2 α + P3 α )]1/α
Where
P1 = Probability at birth not surviving to age 40
P2 = Adult Illiteracy rate
P3 = Under weighted average of population not
using an improved water source and children
under weight –for-age.
α = 3](https://image.slidesharecdn.com/humandevelopmentindicators-131025085833-phpapp01/75/Human-development-indicators-15-2048.jpg)

![CALCULATING THE HPI -2
The formula used to calculate the HPI-2 is as
follows:
HPI-2 = [1/4(P1α +P2α+P3α+P4α]1/α
Where
P1 = Probability at birth not surviving to age 60.
P2 = Percentage of adult lacking functional
literacy skills
P3 = Percentage of population below income
poverty line .
P4 = Rate of long term unemployment (lasting 12
months or more)
α = 3](https://image.slidesharecdn.com/humandevelopmentindicators-131025085833-phpapp01/75/Human-development-indicators-17-2048.jpg)


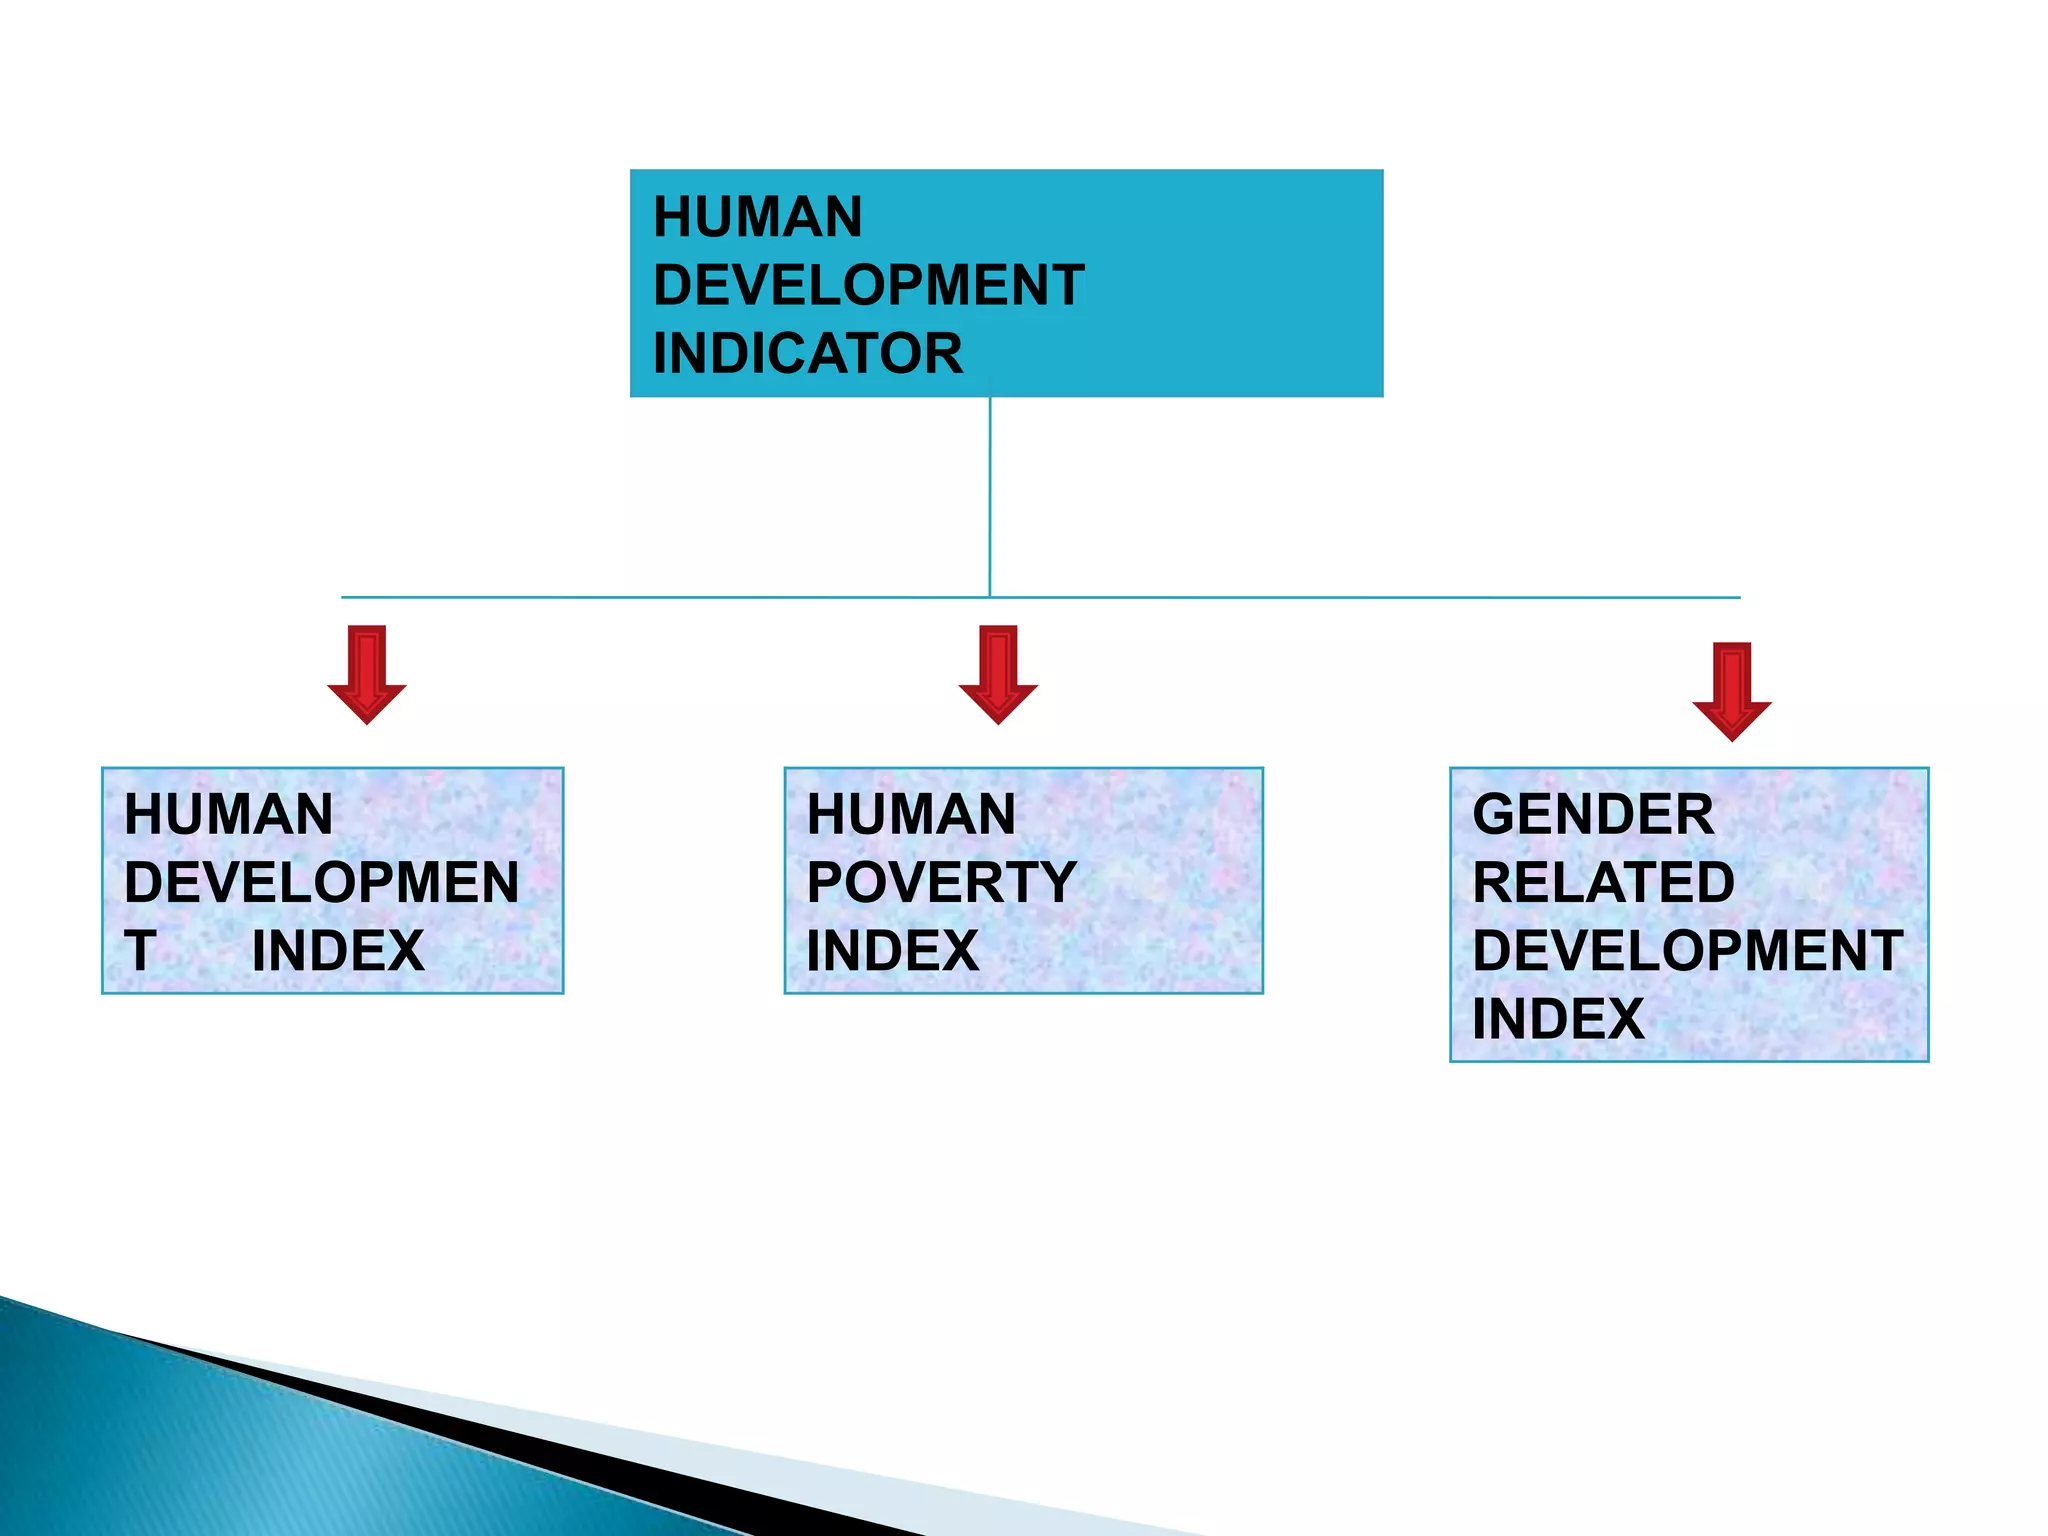
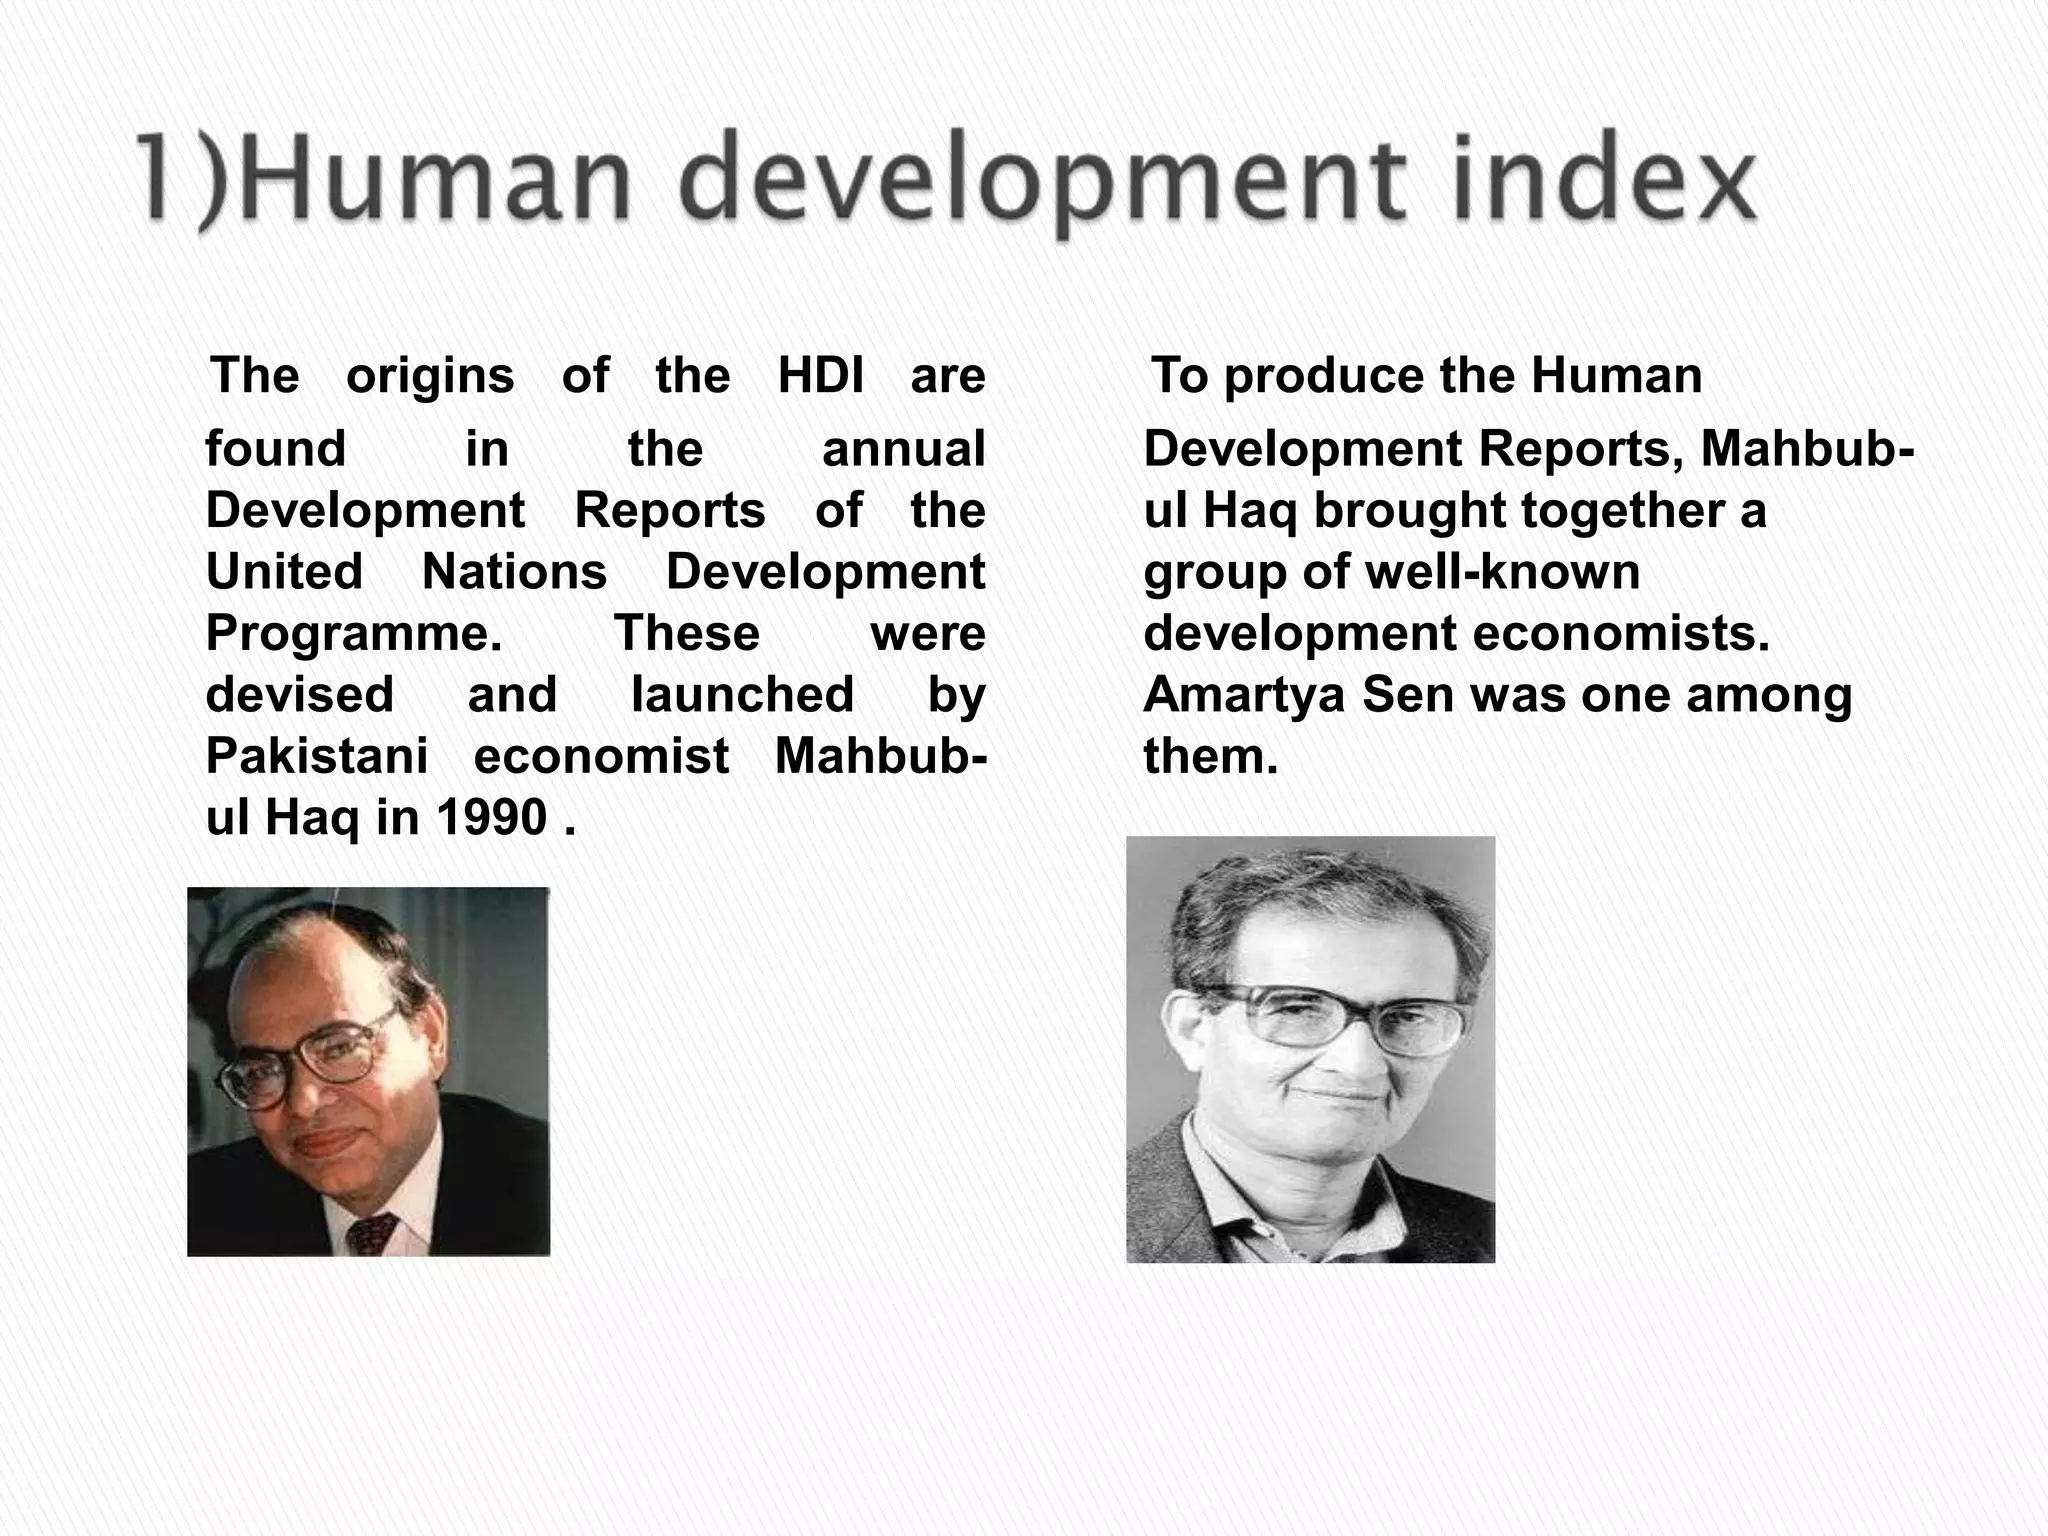
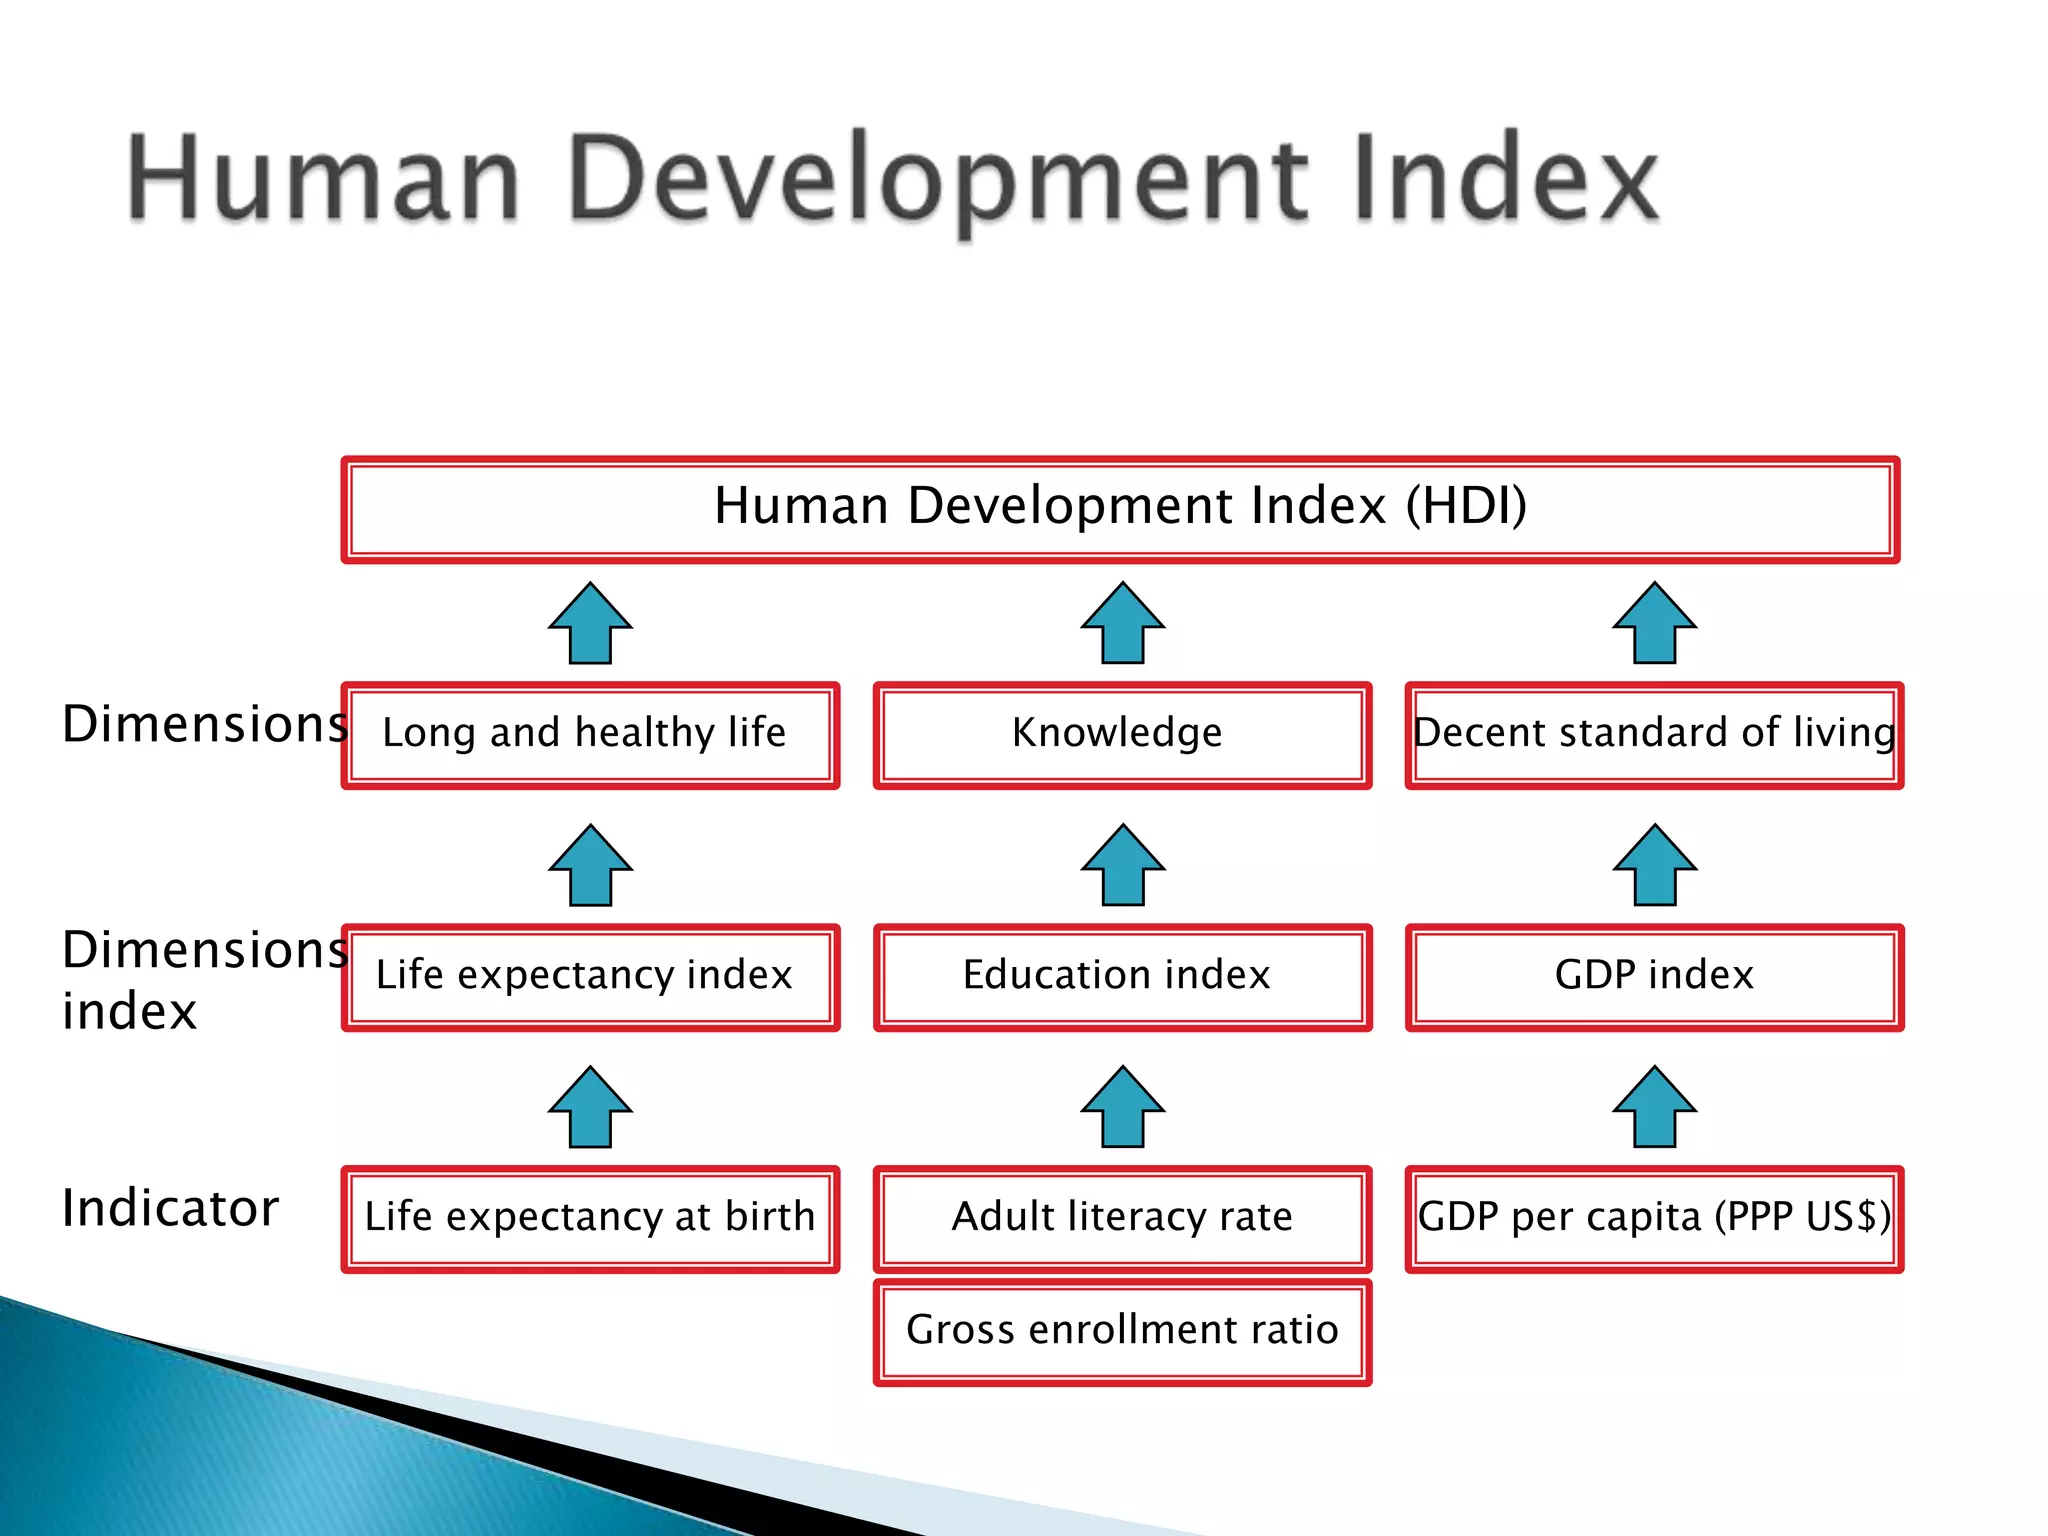
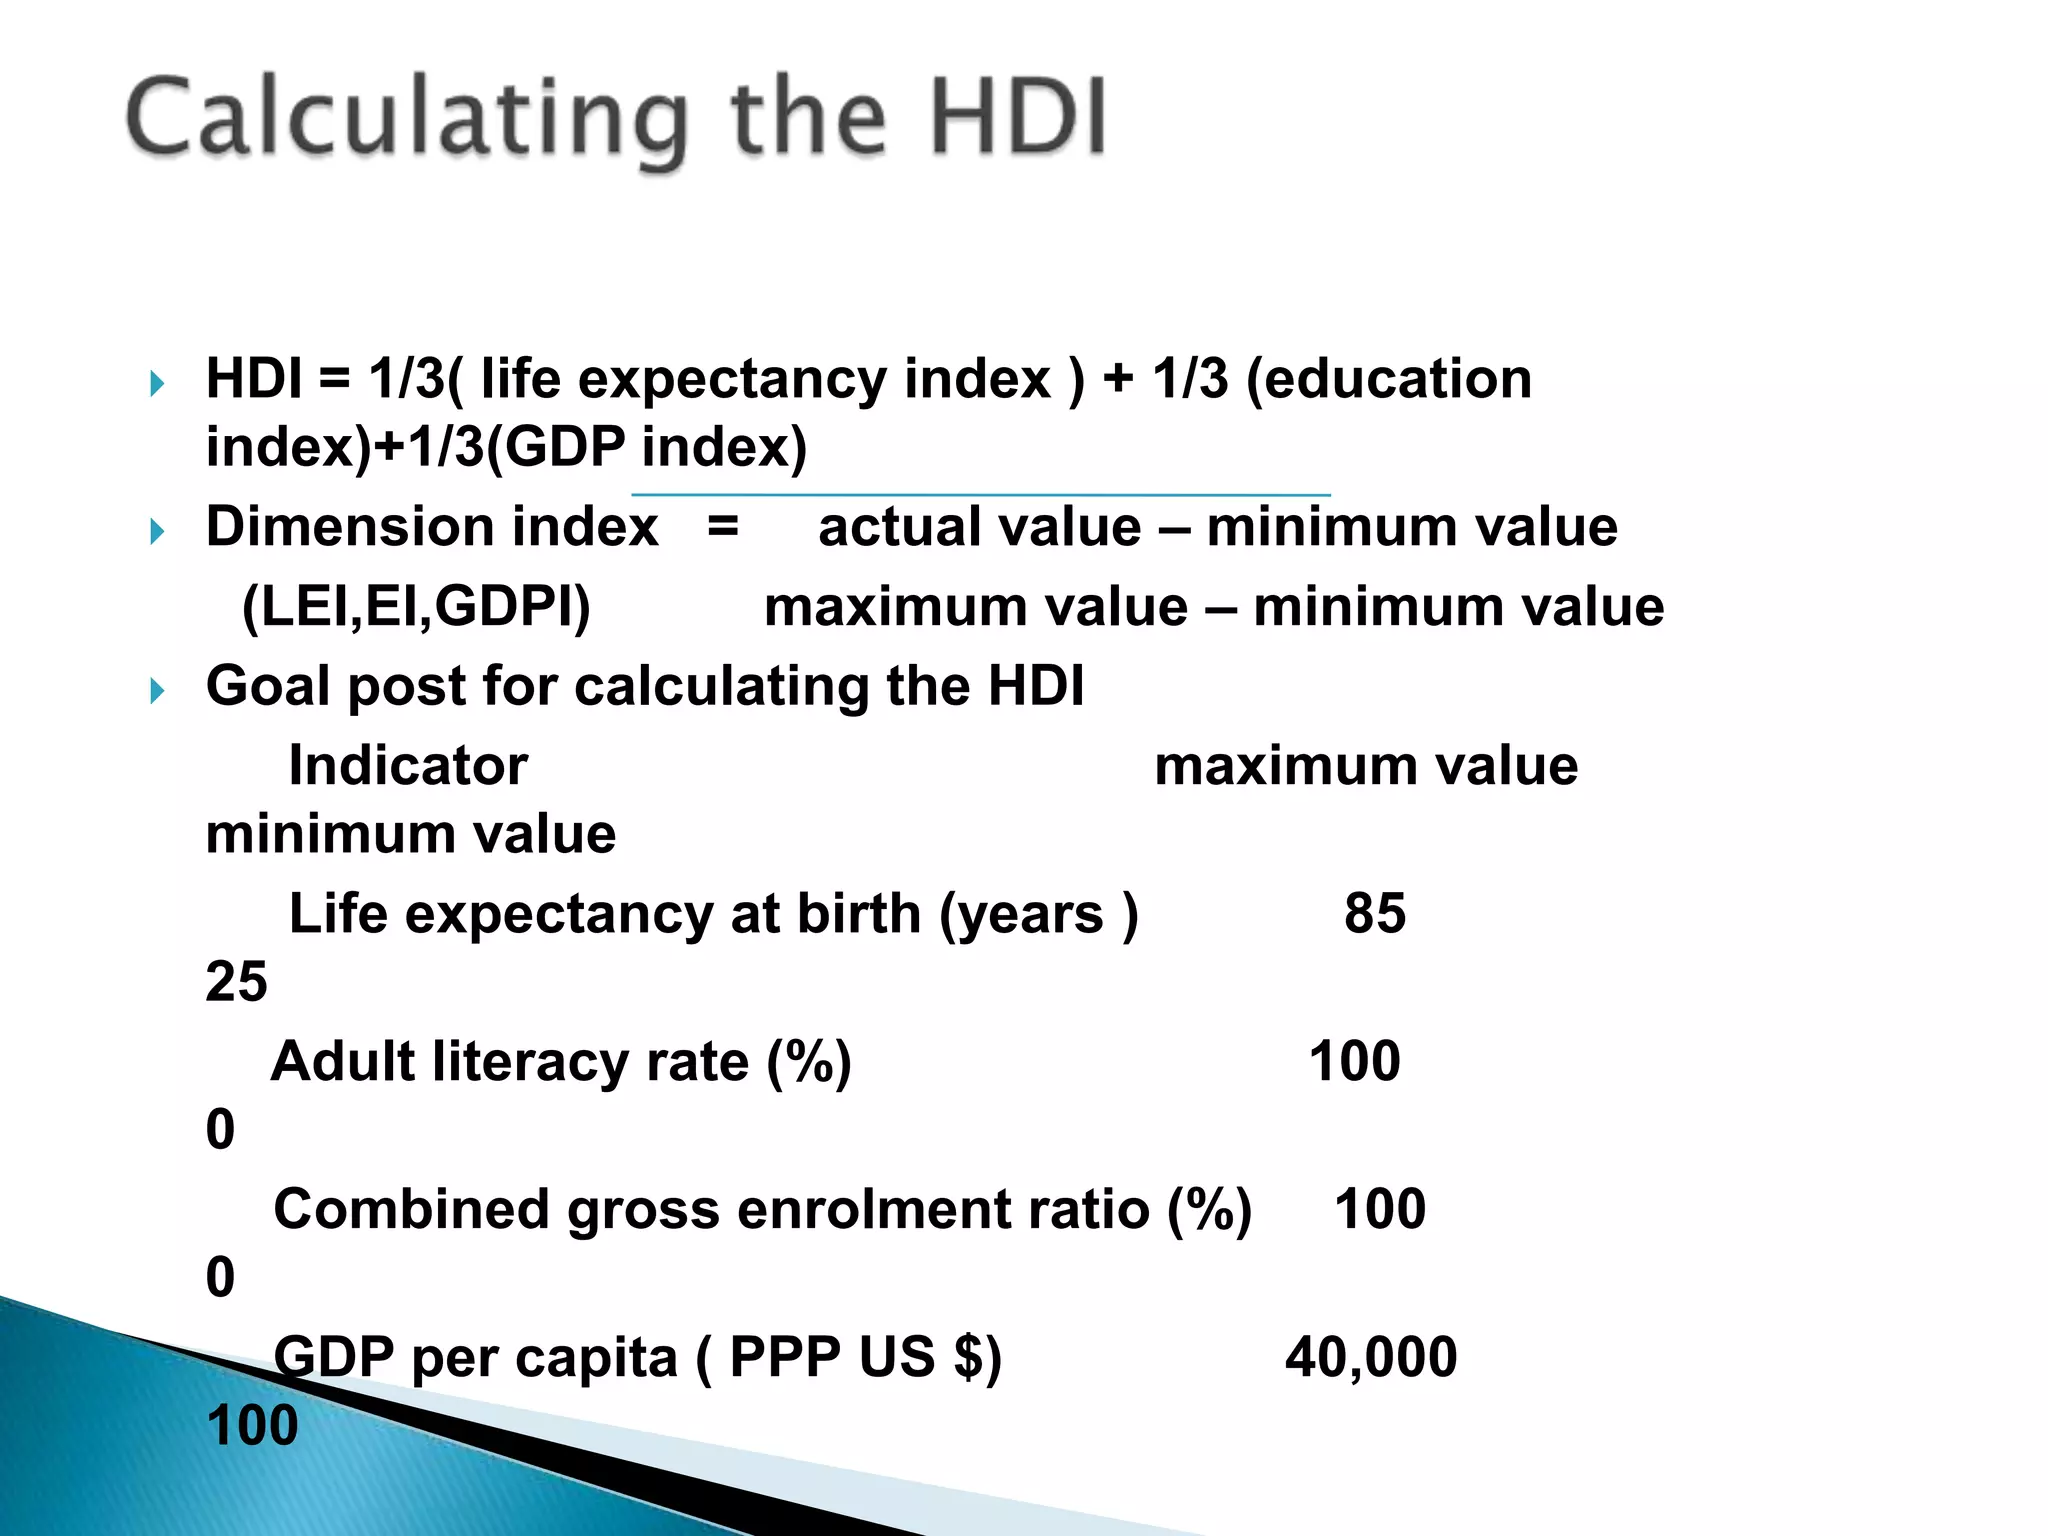
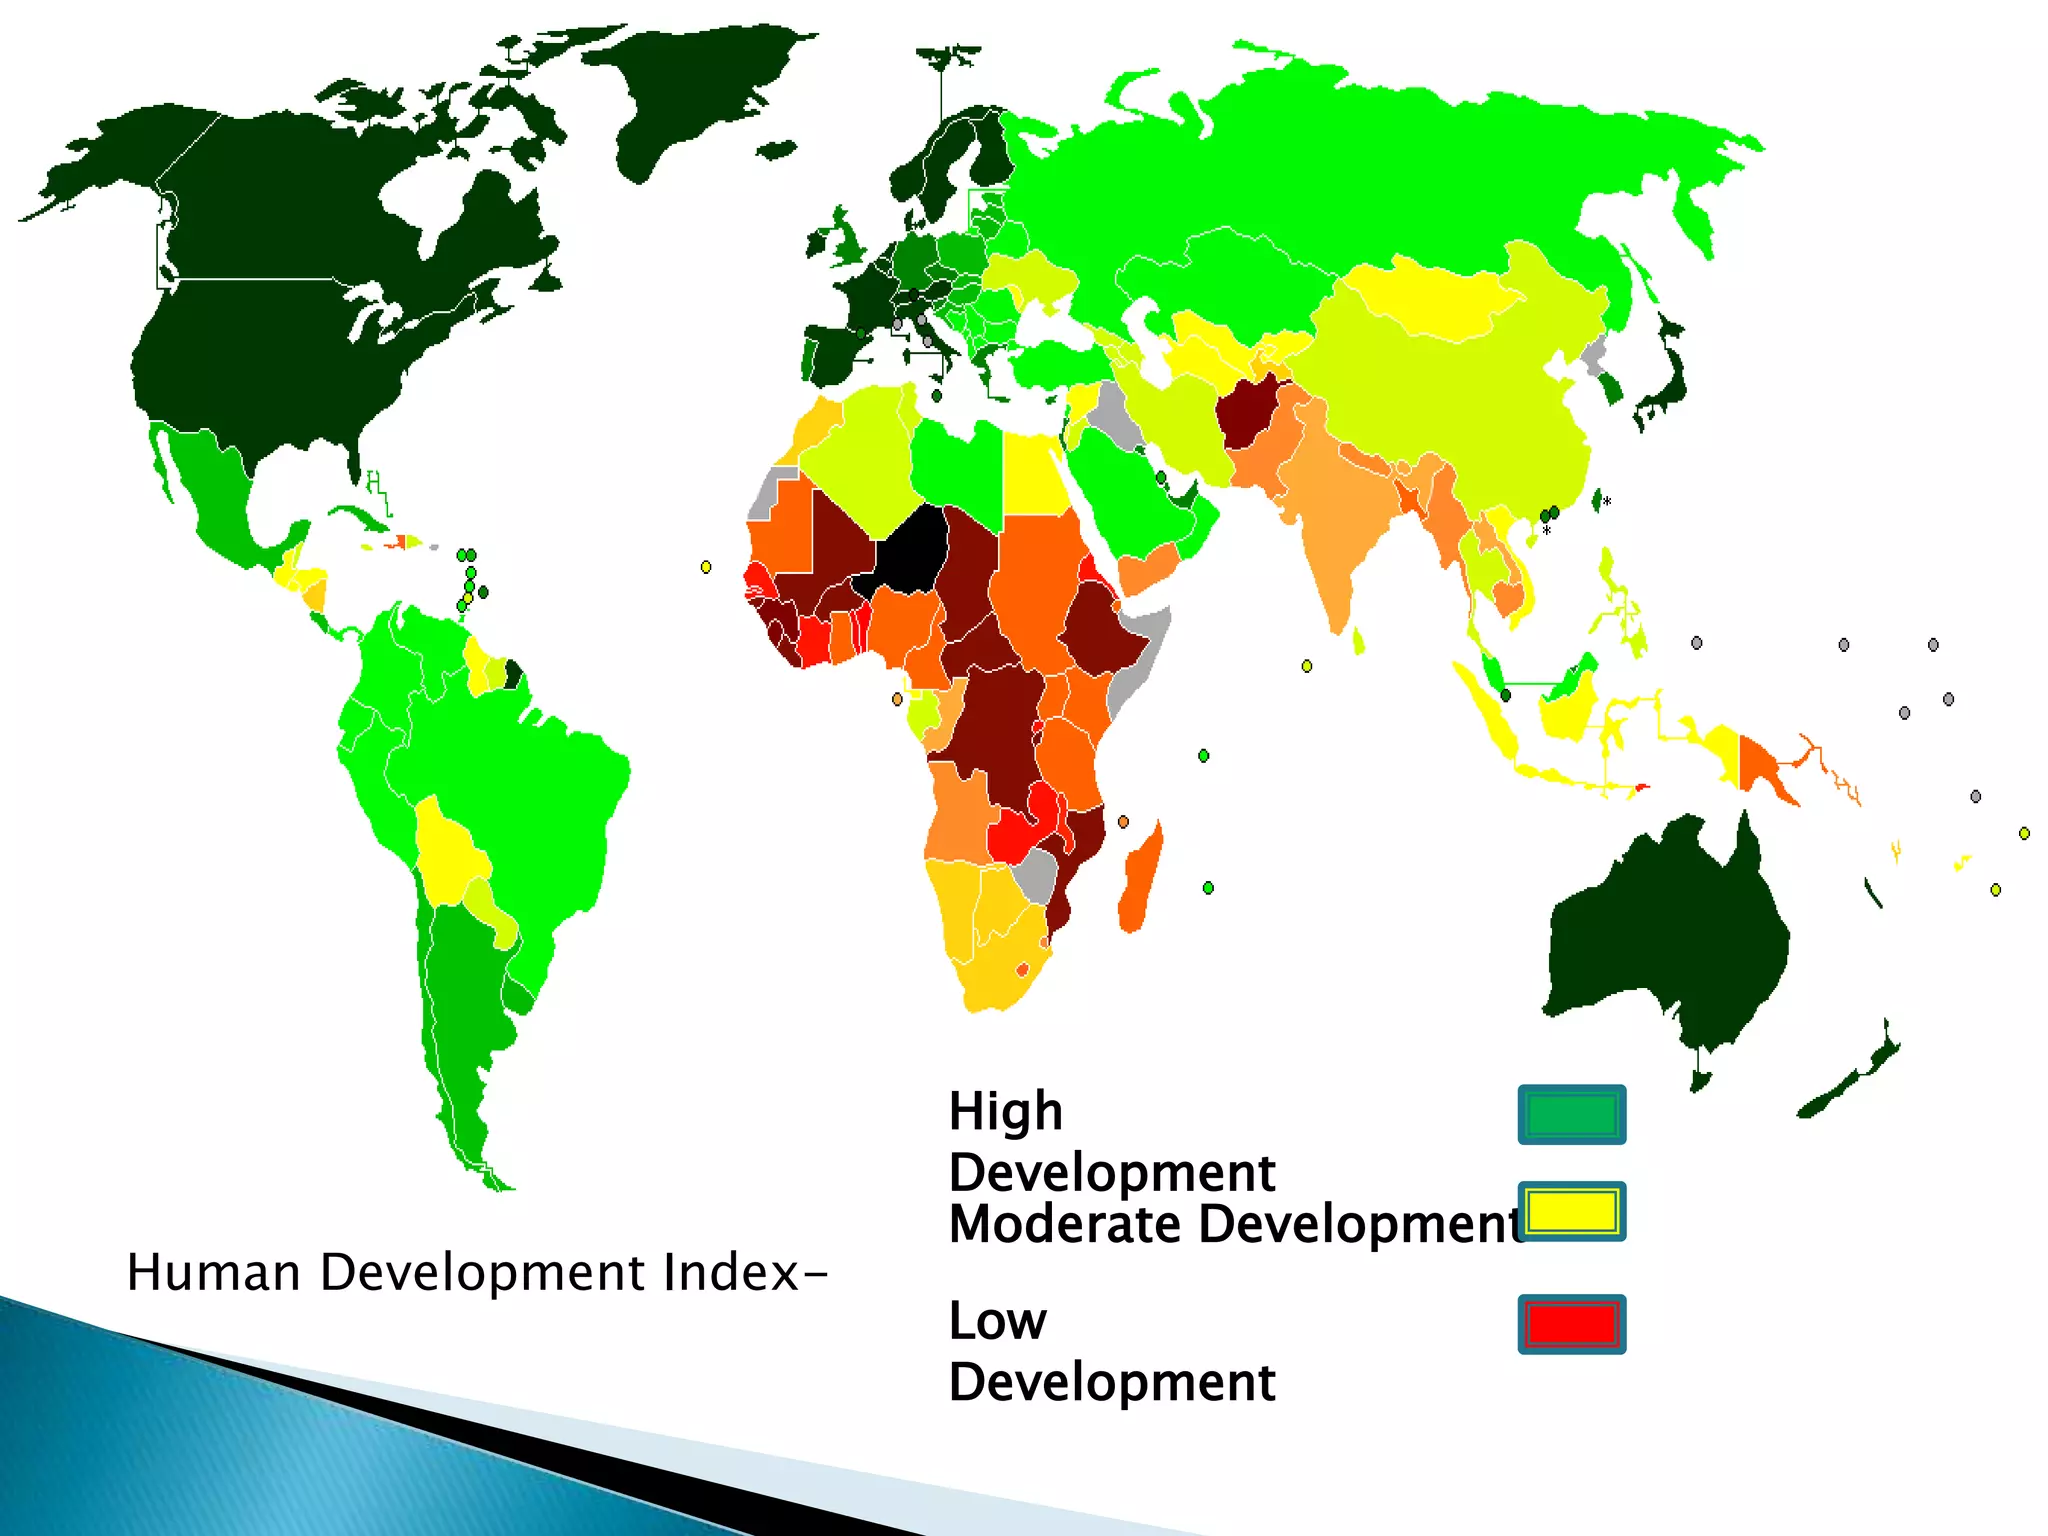
This document discusses several key human development indicators used by the United Nations Development Programme (UNDP) to measure and analyze development. It introduces the Human Development Index (HDI), Human Poverty Index (HPI), and Gender-Related Development Index (GDI). The HDI measures overall development based on health, education, and income indicators. The HPI measures deprivation in these areas. The GDI adjusts the HDI to account for inequalities between men and women. The document provides details on how each index is calculated and examples of country rankings. It also discusses some challenges and factors influencing human development progress in India.