The document discusses various economic, social, and environmental indicators used to assess development. For economic indicators, it examines GDP, GNP, economic growth rates, and economic structure. Social indicators discussed include poverty rates, health factors like malnutrition, women's empowerment, education levels, and political representation. Environmental indicators discussed are forest area, air pollution levels, and marine protected areas. The document notes that while GDP is commonly used, development requires availability of opportunities for people to flourish.
Geographic Regions: by definition There three types of regions Formal regions are areas where a certain characteristic is found throughout. Functional regions consist of a central place and the surrounding places affected by it. Perceptual regions are defined by people’s attitudes and feelings about areas. 4.
Theories and models for Regional planning and developmentKamlesh Kumar
This is a work on the major theories of Regional planning mainly consisting the work of Francois Perroux, Gunnar Myrdal, Albert O. Hirschman, Walter Whitman Rostow and John Friedman.
This slide discusses about the core-periphery model given by John Friedmann. This model is basically a model of regional Development. You will able to learn about the core-periphery model very easily by this slide.
Definition,meaning, scope,approach, and aim of urban-geographyKamrul Islam Karim
What is Urban Geography?
It can be considered a sub-discipline of the larger field of human geography with overlaps of content with that of Cultural Geography
Definition of Urban Geography.
Urban geography is the study of urban places with reference to their geographical environment.
Urban geography is the sub discipline of geography which concentrates on those parts of the Earth's surface that have a high concentration of buildings and infrastructure
.
It is that branch of science, which deals with the study of urban areas, in terms of concentration, infrastructure, economy, and environmental impacts.
Griffith Taylor- Urban Geography includes the site revolution pattern and classification of towns.
Dudley Stamp- Urban Geography is infecting the intensive study of town and their development in all their geographical aspects.
Meaning of an Urban Place
UN Demographic Year Book concludes: “There is no point in the continuum from large agglomerations to small clusters or scattered dwellings where urbanity disappears and rurality begins the division between urban and rural populations is necessarily arbitrary.”
A review of the problems of rural and urban centres as revealed by the Census Reports of various countries identifies a few bases for reckoning a place as urban.
Difference between rural and urban depends upon their nature of work – the former being engaged in agricultural operations and the latter in non-agricultural activities.
Criteria of an Urban Place
(1) A place designated by administrative status;
(2) A minimum population;
(3) A minimum population density;
(4) A concept of contiguity to include or exclude under suburban area or loosely scattered settlement;
(5) A proportion engaged in non-agricultural occupations; and
(6) A functional character.
Attributes of Urban Geography
Scope/nature/theme of Urban Geography
Methods or Approaches of Urban Places
Aim of urban geography
It described, how do we measure development. Various development indicators. HDI, GDP, GNP etc. Where India stands in HDI. the comparison among developed nations and among SAARC nations.
This notes about Introduction to Economic Geography. Which helped to Geography & Environmental Science department students.
In this note I will discourse about:
1) The concept of Economic Geography
2) Historical Vs Modern economic geography
I’m professional presentation maker . These presentations are for sale for 20$ each, if required you can contact me on my gmail id bestpptmaker@gmail.com and you can also suggest me topics for your required presentations
The economy of the world is fast changing during the recent years.
The changes in primary, secondary and tertiary stages are dynamic in nature.
In view of this, the objectives of studying economic geography are to integrate several factors of economic development to acquaint with the dynamic aspects of the Scenario. This module is about basics of economic geography.
IFPRI Policy Seminar presentation on Inclusive Growth and Policy Relevance for Asia and the Pacific by Asian Development Bank VP Dr. Ursula Schaefer-Preuss. Remarks delivered at IFPRI on 28 September 2010.
Body Code Animation Visualizing the Code of LifeBya.docxjasoninnes20
Body Code Animation:
Visualizing the Code of Life
By
asdf
The Millennium Development Goals Report
2015
UNITED NATIONS
Cover Inside
This report is based on a master set of data that has been compiled by the Inter-Agency and Expert
Group on MDG Indicators led by the Department of Economic and Social Affairs of the United nations
Secretariat, in response to the wishes of the General Assembly for periodic assessment of progress
towards the MDGs. The Group comprises representatives of the international organizations whose
activities include the preparation of one or more of the series of statistical indicators that were identified as
appropriate for monitoring progress towards the MDGs, as reflected in the list below. A number of national
statisticians and outside expert advisers also contributed.
ECOnOMIC AnD SOCIAL COMMISSIOn FOR ASIA AnD THE PACIFIC
ECOnOMIC AnD SOCIAL COMMISSIOn FOR WESTERn ASIA
ECOnOMIC COMMISSIOn FOR AFRICA
ECOnOMIC COMMISSIOn FOR EUROPE
ECOnOMIC COMMISSIOn FOR LATIn AMERICA AnD THE CARIBBEAn
FOOD AnD AGRICULTURE ORGAnIZATIOn OF THE UnITED nATIOnS
InTERnATIOnAL LABOUR ORGAnIZATIOn
InTERnATIOnAL MOnETARY FUnD
InTERnATIOnAL TELECOMMUnICATIOn UnIOn
InTERnATIOnAL TRADE CEnTRE
InTER-PARLIAMEnTARY UnIOn
JOInT UnITED nATIOnS PROGRAMME On HIV/AIDS
ORGAnISATIOn FOR ECOnOMIC CO-OPERATIOn AnD DEVELOPMEnT
SECRETARIAT OF THE PACIFIC COMMUnITY
THE WORLD BAnK
UnITED nATIOnS CHILDREn’S FUnD
UnITED nATIOnS COnFEREnCE On TRADE AnD DEVELOPMEnT
UnITED nATIOnS DEVELOPMEnT PROGRAMME
UnITED nATIOnS EDUCATIOnAL, SCIEnTIFIC AnD CULTURAL ORGAnIZATIOn
UnITED nATIOnS EnTITY FOR GEnDER EQUALITY AnD THE EMPOWERMEnT OF WOMEn - Un WOMEn
UnITED nATIOnS EnVIROnMEnT PROGRAMME
UnITED nATIOnS FRAMEWORK COnVEnTIOn On CLIMATE CHAnGE
UnITED nATIOnS HIGH COMMISSIOnER FOR REFUGEES
UnITED nATIOnS HUMAn SETTLEMEnTS PROGRAMME
UnITED nATIOnS InDUSTRIAL DEVELOPMEnT ORGAnIZATIOn
UnITED nATIOnS POPULATIOn FUnD
WORLD HEALTH ORGAnIZATIOn
WORLD TRADE ORGAnIZATIOn
The Millennium Development Goals Report
2015
asdf
United nations
new York, 2015
Foreword | 3
Foreword
The global mobilization behind the Millennium
Development Goals has produced the most successful
anti-poverty movement in history. The landmark
commitment entered into by world leaders in the year
2000—to “spare no effort to free our fellow men,
women and children from the abject and dehumanizing
conditions of extreme poverty”—was translated into
an inspiring framework of eight goals and, then, into
wide-ranging practical steps that have enabled people
across the world to improve their lives and their future
prospects. The MDGs helped to lift more than one billion
people out of extreme poverty, to make inroads against
hunger, to enable more girls to attend school than ever
before and to protect our planet. They generated new
and innovative partnerships, galvanized public opinion
and showed the immense value of setting ambitious ...
On 1 January 2016, the world officially began implementation
of the 2030 Agenda for Sustainable Development—the
transformative plan of action based on 17 Sustainable
Development Goals—to address urgent global challenges
over the next 15 years.
This agenda is a road map for people and the planet that will
build on the success of the Millennium Development Goals
and ensure sustainable social and economic progress worldwide.
It seeks not only to eradicate extreme poverty, but also
to integrate and balance the three dimensions of sustainable
development—economic, social and environmental—in a
comprehensive global vision.
The Sustainable Development Goals Report 2016Peerasak C.
Foreword
On 1 January 2016, the world officially began implementation of the 2030 Agenda for Sustainable Development—the transformative plan of action based on 17 Sustainable Development Goals—to address urgent global challenges over the next 15 years.
This agenda is a road map for people and the planet that will build on the success of the Millennium Development Goals and ensure sustainable social and economic progress worldwide. It seeks not only to eradicate extreme poverty, but also to integrate and balance the three dimensions of sustainable development—economic, social and environmental—in a comprehensive global vision.
It is vital that we begin implementation with a sense of opportunity and purpose based on an accurate evaluation of where the world stands now.
That is the aim of this report. It presents an overview of the 17 Goals using data currently available to highlight the most significant gaps and challenges.
The latest data show that about one in eight people still lived in extreme poverty, nearly 800 million people suffered from hunger, the births of nearly a quarter of children under 5 had not been recorded, 1.1 billion people were living without electricity, and water scarcity affected more than 2 billion people.
These statistics show how important coordinated global data-generation efforts will be in supplying reliable and timely data for systematic follow-up and progress reviews.
The Goals apply to all societies. Even the wealthiest countries have yet to fully empower women or eliminate discrimination.All nations will need to build the Sustainable Development Goals into their national policies and plans if we are to achieve them.
This first report is a starting point. With collective global action, we can seize the opportunities before us and, together,fulfill the pledge of the 2030 Agenda to leave no one behind.
BAN Ki-Moon
Secretary-General, United Nations "The new agenda is a promise by leaders to all people everywhere. It is a universal, integrated and transformative vision for a better world. It is an agenda for people, to end poverty in all its forms. An agenda for the planet, our common home. An agenda for shared prosperity, peace and partnership. It conveys the urgency of climate action. It is rooted in gender equality and respect for the rights of all. Above all, it pledges to leave no one behind."
BAN Ki-Moon
Secretary-General, United Nations
The new agenda is a promise by leaders to all people everywhere. It is a universal, integrated and transformative vision for a better world. It is an agenda for people, to end poverty in all its forms. An agenda for the planet, our common home. An agenda for shared prosperity, peace and partnership. It conveys the urgency of climate action. It is rooted in gender equality and respect for the rights of all. Above all, it pledges to leave no one behind.
BAN Ki-Moon
Secretary-General, United Nations
Migration Profile of Odisha with focus on BhubaneswarKamlesh Kumar
Migration is one the most important demographic component to determine the size, growth and structure of population of a particular region, besides fertility and mortality. For a large country like India, the study of movement of population in different parts of the country helps in understanding the dynamics of the society and societal change better. Bhubaneswar is one of the magnets for migrants in east India attributing to its exponential growth rates. This is an attempt to map the migration pattern in the city and the state.
Population Projection of Khordha District, ODISHA 2021-51Kamlesh Kumar
Work is based on Walter Isard's methods in a simplistic manner.
1. ARITHMATICAL INCREASE METHOD OF PROJECTION
2. GEOMETRIC INCREASE METHOD
3. INCREMENTAL INCREASE METHOD
DEMOGRAPHIC PROFILE OF CONTINENTAL ODISHAKamlesh Kumar
Although the state is endowed with vast natural resources it has remained on the bottom of the developmental chart of the nation. With such a reserve of natural resources and human resource potential, it is like a hibernating beast which must awake for good. Stealing the limelight of the most favourable smart city, the capital is growing like never before along with a few more cities. Yet the state remains mostly rural and lagging in most aspects except for the coastal regions. My analysis is that the state has not been given its due attention in planning which is the reason for its present backwardness.
‘Fashion’ is a notoriously difficult term to pin down, and it is extremely doubtful whether it is possible to come up with necessary and sufficient conditions for something justifiably to be called ‘fashionable’. Generally speaking, we can distinguish between two main categories in our notion of fashion: one that fashion refers to clothing or that fashion is a general mechanism, logic or ideology that, among other things, applies to the area of clothing.
Adam Smith , who was among the first philosophers to give fashion a central role in his anthropology, claims that fashion applies first and foremost to areas in which taste is
a central concept. This applies in particular to clothes and furniture, but also to music, poetry and architecture. Immanuel Kant provides a description of fashion that focuses on general changes in human lifestyles: ‘All fashions are, by their very concept, mutable ways of living.’
However, trends die quickly and with that comes waste. Clothing produced by fast fashion brands are oftentimes made from cheap materials, like polyester and acrylic, and not built to last: The average American throws away 80 pounds of clothing every year. We’ve been conditioned to believe that buying a garment and wearing it once is justifiable. It’s not. Due to the growing demand in the fast fashion industry, we see a vast overproduction of clothing; for example, the Copenhagen Fashion Summit reports that fashion is responsible for 92 million tons of solid waste dumped in landfills each year. This cultural shift on how we consume clothing is leaving a huge mark on the planet. Fashion has become much more than representation and being covered.
COMMUNAL HARMONY: PUNJABI & TIBETANS IN DELHIKamlesh Kumar
LANDSCAPE AS TEXT
Delhi, the majestic, cosmopolitan, sprawling capital of the nation viewed as one of the global nodes bustling with life in haste. It has maintained its identity as a pluralistic amalgamation with myriads of ethno-religious groups and minority communities. Such is the very famous, our own ‘little Tibet’- Majnu Ka Tila situated at a stone’s throw from the Delhi University North Campus. Officially known as Aruna Nagar Colony is the universal gathering place
for Tibetans living around Delhi and a transit point for the people of the trans-Himalayan range and conversely a gateway to Tibet for the Indians and foreign tourists alike as the capital city enjoys a status of a flourishing educational and political hub.
Tall buildings on either side make the narrow alley so dark it’s as if the sun never makes it here. Shops on either side sell only exotic Tibetan jewellery, Buddhist artefacts and crockery. In this labyrinth of a colony, the stalls are full of copies of branded shoes and clothes, reflecting the latest in fashion trends across Asia. Many of the tiny outlets sell Buddhist curios and Tibetan literature. Ahead, the alley opens into a bright courtyard facing the monastery. Old ladies sit in the sun, making fresh momos and laphing, pancakes rolled with chilli paste. Besides MKT is a Foodie's paradise, the eateries here are not only popular for its momos, but one can also enjoy authentic Tibetan, Chinese and Korean delicacies along with the yummiest of the English pastries.
Majnu Ka Tila not only is limited to Tibetan community but constituted by the Punjabi community as well which has a historical context.
The area provides a microcosm of diversified India where there is invisible transition and diffusion of identity, culture of distinct communities and Indianisation of Tibetan lifestyle.
For instance, many Tibetans who cannot afford the rising rents of the Tibetan enclave (due to hotels and tourist activities) are forced to live in the Punjabi Basti where renting an apartment is cheaper comparatively. Living in Punjabi zone is seen influencing a cultural and identity loss. To diffuse with the Punjabi population is perceived as a risk “of identity loss”, and forgetting your Tibetan culture. These frontiers are mental, social and religious. Nonetheless, the ethnic groups interacting and sharing a space is a matter of pride as community harmony.
An overlay operation is much more than a simple merging of linework; all the attributes of the features taking part in the overlay are carried through. In general, there are two methods for performing overlay analysis—feature overlay (overlaying points, lines, or polygons) and raster overlay. Some types of overlay analysis lend themselves to one or the other of these methods. Overlay analysis to find locations meeting certain criteria is often best done using raster overlay (although you can do it with feature data). Of course, this also depends on whether your data is already stored as features or raster. It may be worthwhile to convert the data from one format to the other to perform the analysis.
Weighted Overlay
Overlays several raster files using a common measurement scale and weights each according to its importance.
The weighted overlay table allows the calculation of a multiple criteria analysis between several raster files.
Raster- The raster of the criteria being weighted.
Influence- The influence of the raster compared to the other criteria as a percentage of 100.
Field- The field of the criteria raster to use for weighting.
Remap- The scaled weights for the criterion.
In addition to numerical values for the scaled weights in Remap, the following options are available:
Restricted- Assigns the restricted value (the minimum value of the evaluation scale set, minus one) to cells in the output, regardless of whether other input raster files have a different scale value set for that cell.
No data - Assigns No Data to cells in the output, regardless of whether other input raster files have a different scale value set for that cell.
THIS PRESENTATION IS TO HELP YOU PERFORM THE TASK STEP BY STEP.
In the context of remote sensing, change detection refers to the process of identifying differences in the state of land features by observing them at different times. This process can be accomplished either manually (i.e., by hand) or with the aid of remote sensing software. Manual interpretation of change from satellite images or aerial photos involves an observer or analyst defining areas of interest and comparing them between images from two dates. This may be accomplished either on-screen (such as in a GIS) or on paper. When analyzing aerial photographs, a stereoscope which allows for two spatially-overlapping photos to be displayed in 3D, can aid photo interpretation. Manual image interpretation works well when assessing change between discrete classes (forest openings, land use and land cover maps) or when changes are large (e.g., heavy mechanized maneuver damage, engineering training impacts). Manual image interpretation is also an option when trying to determine change using images or photos from different sources (comparing historic aerial photographs to current satellite imagery).
Automated methods of remote sensing change detection usually are of two forms: post-classification change detection and image differencing using band ratios. In post-classification change detection, the images from each time period are classified using the same classification scheme into a number of discrete categories like land cover types. The two (or more) classifications are compared and the area that is classified the same or different is tallied. With image differencing, a band ratio such as NDVI is constructed from each input image, and the difference is taken between the band ratios of different times. In the case of differencing NDVI images, positive output values may indicate an increase in vegetation, negative values a decrease in vegetation, and values near zero no change. With either post-classification or image differencing change detection, it is necessary to specify a threshold below which differences between the two images is considered to be non-significant. The specification of thresholds is critical to the results of change detection analysis and usually must be found through an iterative process.
THIS PRESENTATION IS TO HELP YOU PERFORM THE TASK STEP BY STEP.
Accuracy assessment is an important part of any classification project. It compares the classified image to another data source that is considered to be accurate or ground truth data. Ground truth can be collected in the field; however, this is time consuming and expensive. Ground truth data can also be derived from interpreting high-resolution imagery, existing classified imagery, or GIS data layers.
The most common way to assess the accuracy of a classified map is to create a set of random points from the ground truth data and compare that to the classified data in a confusion matrix. Although this is a two-step process, you may need to compare the results of different classification methods or training sites, or you may not have ground truth data and are relying on the same imagery that you used to create the classification. To accommodate these other workflows, this process uses three geoprocessing tools: Create Accuracy Assessment Points, Update Accuracy Assessment Points, and Compute Confusion Matrix.
Thresholding
Thresholding is the process of identifying the pixels in a classified image that are the most likely to be classified incorrectly. These pixels are put into another class (usually class 0). These pixels are identified statistically, based upon the distance measures
that were used in the classification decision rule.
Accuracy Assessment : Error Matrix
Accuracy assessment is a general term for comparing the classification to geographical data that are assumed
to be true, in order to determine the accuracy of the classification process. Usually, the assumed-true data are derived from ground truth data. It is usually not practical to ground truth or otherwise test every pixel of a classified image. Therefore, a set of reference pixels is usually used. Reference pixels are points on the classified image for which actual data are (or will be) known. The reference pixels are randomly selected.
Overall accuracy: Overall accuracy is used to indicate the accuracy of whole classification (i.e. number of correctly classifier pixels divided by the total number of pixels in the error matrix)
User’s accuracy(commission error): User’s accuracy is regarded as the probability that a pixel classified on map actually represents that
class on the ground or reference data
Producer’s accuracy(omission error): Producer’s accuracy represents the probability of reference pixel being correctly classified
THIS PRESENTATION IS TO HELP YOU PERFORM THE TASK STEP BY STEP.
The objective of image classification is to classify each pixel into only one class (crisp or hard classification) or to associate the pixel with many classes (fuzzy or soft classification). The classification techniques may be categorized either on the basis of training process (supervised and unsupervised) or on the basis of theoretical model (parametric and non-parametric).
Unsupervised classification is where the groupings of pixels with common characteristics are based on the software analysis of an image without the user providing sample classes. The computer uses techniques to determine which pixels are related and groups them into classes. The user can specify which algorism the software will use and the desired number of output classes but otherwise does not aid in the classification process. However, the user must have knowledge of the area being classified when the groupings of pixels with common characteristics produced by the computer have to be related to actual features on the ground (such as waterbodies, developed areas, forests, etc.).
Supervised classification is based on the idea that a user can select sample pixels in an image that are representative of specific classes and then direct the image processing software to use these training sites as references for the classification of all other pixels in the image. Input classes are selected based on the knowledge of the user. The user also sets the bounds for how similar other pixels must be to group them together. These bounds are often set based on the spectral characteristics of the input classes (AOI), plus or minus a certain increment (often based on “brightness” or strength of reflection in specific spectral bands). The user also designates the number of classes that the image is classified into.
THIS PRESENTATION IS TO HELP YOU PERFORM THE TASK STEP BY STEP.
Interpolation is the process of using points with known values to estimate values at other unknown points. It can be used to predict unknown values for any geographic point data, such as elevation, rainfall, noise levels, atmospheric components and so on.
The Inverse Distance Weighting (IDW) assumes each input point to have a local influence that diminishes with distance. It assumes that closer things are more alike than those that are farther apart. It weights the points closer to the processing cell greater than those further away. A specified number of points, or all points within a specified radius can be used to determine the output value of each location. To predict a value for any unmeasured location, IDW will use the measured values surrounding the prediction location. Those measured values closest to the prediction location will have more influence on the predicted value than those farther away.
Spline estimates values using a mathematical function that minimizes overall surface curvature, resulting in a smooth surface that passes exactly through the input points. This method is best for gently varying surfaces, such as elevation, water table heights, or pollution concentrations. A Regularized method creates a smooth, gradually changing surface with values that may lie outside the sample data range.
Kriging is a geostatistical interpolation technique that considers both the distance and the degree of variation between known data points when estimating values in unknown areas. Kriging assumes that the distance or direction between sample points reflects a spatial correlation that can be used to explain variation in the surface. The Kriging tool fits a mathematical function to a specified number of points, or all points within a specified radius, to determine the output value for each location. Kriging is a multistep process; it includes exploratory statistical analysis of the data, variogram modeling, creating the surface, and (optionally) exploring a variance surface. Kriging is most appropriate when you know there is a spatially correlated distance or directional bias in the data. It is often used in soil science and geology.
Trend is a statistical method that finds the surface that fits the sample points using a least-square regression fit. It fits one polynomial equation to the entire surface. This results in a surface that minimizes surface variance in relation to the input values. The surface is constructed so that for every input point, the total of the differences between the actual values and the estimated values (i.e., the variance) will be as small as possible.
THIS PRESENTATION IS TO HELP YOU PERFORM THE TASK STEP BY STEP.
Raster data is commonly obtained by scanning maps or collecting aerial photographs and satellite images. Scanned map datasets don't normally contain spatial reference information (either embedded in the file or as a separate file). With aerial photography and satellite imagery, sometimes the location information delivered with them is inadequate, and the data does not align properly with other data one has. Thus, to use some raster datasets in conjunction with other spatial data, we need to align or georeference them to a map coordinate system. A map coordinate system is defined using a map projection (a method by which the curved surface of the earth is portrayed on a flat surface). Georeferencing a raster data defines its location using map coordinates and assigns the coordinate system of the data frame. Georeferencing raster data allows it to be viewed, queried, and analyzed with other geographic data.
Generally, we georeference raster data using existing spatial data (target data)—such as georeferenced rasters or a vector feature class—that resides in the desired map coordinate system. The process involves identifying a series of ground control points—known x,y coordinates—that link locations on the raster dataset with locations in the spatially referenced data (target data). Control points are locations that can be accurately identified on the raster dataset and in real-world coordinates. Many different types of features can be used as identifiable locations, such as road or stream intersections, the mouth of a stream, rock outcrops, the end of a jetty of land, the corner of an established field, street corners, or the intersection of two hedgerows. The control points are used to build a polynomial transformation that will shift the raster dataset from its existing location to the spatially correct location. The connection between one control point on the raster dataset (the from point) and the corresponding control point on the aligned target data (the to point) is a link.
Finally, the georeferenced raster file can be exported for further usage.
THIS PRESENTATION IS TO HELP YOU PERFORM THE TASK STEP BY STEP.
With increasing use of remote sensing, the need for crispier, accurate and enhanced precision has deemed to the improvement in the spectral and spatial resolution of remotely sensed imagery. For most of the systems, panchromatic images typically have higher resolution, while multispectral images offer information in several spectral channels. Resolution merge (also called pan-sharpening) allows us to combine advantages of both kinds of images by merging them into one.
The resolution merge or pan sharpening is the technique used to obtain high resolution multi-spectral images. The color information is collected from the coarse resolution satellite data and the intensity from the high resolution satellite data.
The main constraint is to preserve the spectral information for aspects like land use. Saving theimage from distortion of the spectral characteristics is important in the merged dataset.
The most common techniques for spatial enhancement of low-resolution imagery combining high and low resolution data can be used are: Intensity-Hue-Saturation, Principal Component, Multiplicative and Brovey Transform.
THIS PRESENTATION IS TO HELP YOU PERFORM THE TASK STEP BY STEP.
Remote Sensing: Normalized Difference Vegetation Index (NDVI)Kamlesh Kumar
The Normalized Difference Vegetation Index (NDVI) is a numerical indicator that uses the visible and near-infrared (NIR) bands of the electromagnetic spectrum to analyze whether the target (image) being observed contains green vegetation or not. Healthy vegetation (chlorophyll) reflects more near-infrared (NIR) and green light compared to other wavelengths. But it absorbs more red and blue light. This is why our eyes see vegetation as the colour green. If we could see near-infrared, then it would be strong for vegetation too.
It is basically measured through the use of Intensity, Hue and saturation of an image and through pixels as well.
The density of vegetation (NDVI) at a certain point on the image is equal to the difference in the intensities of reflected light in the red and infrared range divided by the sum of these intensities.
푁퐷푉퐼=((푁퐼푅−푅퐸퐷))/((푁퐼푅+푅퐸퐷))
The result of this formula generates a value between -1 and +1. If you have low reflectance (low values) in the red band and high reflectance in the NIR, this will yield a high NDVI value. And vice versa.
Remote Sensing: Principal Component AnalysisKamlesh Kumar
Principal components analysis is a orthogonal transformational technique (preserving the symmetry between vectors and angles) to reveal new set of data arguably better from the original data set and better capture the essential information as well. It happens often that some variables are highly correlated with a lot of duplication. Instead of discarding the redundant data, principal components analysis condenses the info. in inter-correlated variables into a few variables, called principal components.
The main idea of Principal Component Analysis (PCA) is to reduce the dimensionality of a data set consisting of many variables correlated with each other, either heavily or lightly, while retaining the variation present in the dataset, up to the maximum extent.
THIS PRESENTATION IS TO HELP YOU PERFORM THE TASK STEP BY STEP.
The advantage of digital imagery is that it allows us to manipulate the digital pixel values in the image. Even after the radiometric corrections image may still not be optimized for visual interpretation. An image 'enhancement' is basically anything that makes it easier or better to visually interpret. An enhancement is performed for a specific application as well. This enhancement may be inappropriate for another purpose, which would demand a different type of enhancement.
Filtering is used to enhance the appearance of an image. Spatial filters are designed to highlight or suppress specific features in an image based on their spatial frequency. ‘Rough’ textured areas of an image, where the changes in tone are abrupt, have high spatial frequencies, while ‘smooth’ areas with little variation have low spatial frequencies. A common filtering procedure involves moving a ‘matrix' of a few pixels in dimension (ie. 3x3, 5x5, etc.) over each pixel in the image, using mathematical calculation and replacing the central pixel with the new value.
A low-pass filter is designed to emphasize larger, homogeneous areas of similar tone and reduce the smaller detail in an image. Thus, low-pass filters generally serve to smooth the appearance of an image. In some cases, like 'low-pass filtering', the enhanced image can actually look worse than the original, but such an enhancement was likely performed to help the interpreter see low spatial frequency features among the usual high frequency clutter found in an image. High-pass filters do the opposite and serve to sharpen the appearance of fine detail in an image. Directional, or edge detection filters are designed to highlight linear features, such as roads or field boundaries. These filters can also be designed to enhance features which are oriented in specific directions.
THIS PRESENTATION IS TO HELP YOU PERFORM THE TASK STEP BY STEP.
Mountainous regions occupy one-fourth of the world’s terrestrial surface, most rich in diverse landscapes and hold on to the biodiversity and cultural diversity along with supporting 10% of humankind with their direct life support base. Most mountainous regions have been at the far periphery of mainstream societal concerns for a long time. Remote, relatively inaccessible, they were generally pictured as difficulty, unyielding and unprofitable environments. Very less have focused attention on mountainous people and cultures, primitive religion, marginal survival, unusual adaptation to very high altitude, fraternal polyandry to obliterate informed communication and more meaningful analysis in practical sense. Early research concentrated mainly on specialised studies with little cross disciplinary endeavour. During the last few decades there have been spasmodic accounts of the highland and lowland mainly induced by events of great economic or political significance and due to the degradation of highlands which are potential threats to subjacent lowland population centre. Recent developments, expanding highland research and awareness spread by institutions and governments have shone a new ray of light towards the bright future. However, increased awareness with political advocacy must be pursued further.
Water is hydrosphere is made up of all the water on Earth. This includes all of the rivers, lakes, streams, oceans, groundwater, polar ice caps, glaciers and moisture in the air (like rain and snow). The hydrosphere is found on the surface of Earth, but also extends down several miles below, as well as several miles up into the atmosphere. So, there is a need for study of water as a scarce resource.
WHAT IS HYDROLOGICAL CYCLE
SYSTEM APPROACH IN HYDROLOGY
HYDROLOGIC INPUT & OUTPUT
VARIATION IN HYDROLOGICAL CYCLE
COMPONENTS
EVAPORATION
EVAPOTRANSPIRATION
PRECIPITATION
INTERCEPTION
INFILTRATION
GROUND WATER
RUN-OFF
HUMAN IMPACT
EARTH SURFACE
CLIMATE CHANGE
ATMOSPHERIC POLLUTION
MULTI PURPOSE PROJECTS
WATER WITHDRAWAL
MANAGEMENT AND CONTROL
An assessment on the temperate ecosystem with the following sub headings:
Geological evolution: Location and Extent
Atmospheric changes
Hydrological Changes
Land Degradation
Biodiversity Loss
Challenges to Human Community
Geosystem Approach: El Nino Southern Oscillation EffectsKamlesh Kumar
Earth system as a whole is very complex and dynamic, for that matter we prepare models to represent the functioning linkages and processes for better understanding. However, the geo-systems can not be summed up in just one model. Hence, we use system analysis approach, if we see Earth as a giant system, there're many sub-systems for better comprehension representing only a particular component of the system.
Here, I've tried to cover the geo-system approach siting a globe affecting example of the El Nino Southern Oscillation (ENSO) phenomena.
This report is detailed study of the research conducted in Kirori Mal College. The basic objective of this report is to get a tough insight in the use of research techniques. Geography, being a field science, a geographical enquiry always need to been supplemented through well planned Research. Research is an essential component of geographic enquire. It is a basic procedure to understand the earth as a home of humankind. Disaster management is an inseparable part of the discipline especially which deals with the study of natural phenomena. This research focuses upon the FIRE safety plan of the institution. It is carried out through observation, sketching, measurement, interviews, etc. The Research facilitate the collection of local level information that is not available through secondary sources.
In this report, various methodologies have been employed such as my, measurement and interviewing, photographing, examining, the collection and gathering of information at different corners of the institution and later, tabulating and computing them is an important part of the field work.
Furthermore, the research report has been prepared in concise form alongside with maps and diagrams for giving visual impressions. Moreover, it contains all the details of the procedures followed, methods, tools and techniques employed.
Ethnobotany and Ethnopharmacology:
Ethnobotany in herbal drug evaluation,
Impact of Ethnobotany in traditional medicine,
New development in herbals,
Bio-prospecting tools for drug discovery,
Role of Ethnopharmacology in drug evaluation,
Reverse Pharmacology.
Synthetic Fiber Construction in lab .pptxPavel ( NSTU)
Synthetic fiber production is a fascinating and complex field that blends chemistry, engineering, and environmental science. By understanding these aspects, students can gain a comprehensive view of synthetic fiber production, its impact on society and the environment, and the potential for future innovations. Synthetic fibers play a crucial role in modern society, impacting various aspects of daily life, industry, and the environment. ynthetic fibers are integral to modern life, offering a range of benefits from cost-effectiveness and versatility to innovative applications and performance characteristics. While they pose environmental challenges, ongoing research and development aim to create more sustainable and eco-friendly alternatives. Understanding the importance of synthetic fibers helps in appreciating their role in the economy, industry, and daily life, while also emphasizing the need for sustainable practices and innovation.
Welcome to TechSoup New Member Orientation and Q&A (May 2024).pdfTechSoup
In this webinar you will learn how your organization can access TechSoup's wide variety of product discount and donation programs. From hardware to software, we'll give you a tour of the tools available to help your nonprofit with productivity, collaboration, financial management, donor tracking, security, and more.
Model Attribute Check Company Auto PropertyCeline George
In Odoo, the multi-company feature allows you to manage multiple companies within a single Odoo database instance. Each company can have its own configurations while still sharing common resources such as products, customers, and suppliers.
How to Make a Field invisible in Odoo 17Celine George
It is possible to hide or invisible some fields in odoo. Commonly using “invisible” attribute in the field definition to invisible the fields. This slide will show how to make a field invisible in odoo 17.
The Roman Empire A Historical Colossus.pdfkaushalkr1407
The Roman Empire, a vast and enduring power, stands as one of history's most remarkable civilizations, leaving an indelible imprint on the world. It emerged from the Roman Republic, transitioning into an imperial powerhouse under the leadership of Augustus Caesar in 27 BCE. This transformation marked the beginning of an era defined by unprecedented territorial expansion, architectural marvels, and profound cultural influence.
The empire's roots lie in the city of Rome, founded, according to legend, by Romulus in 753 BCE. Over centuries, Rome evolved from a small settlement to a formidable republic, characterized by a complex political system with elected officials and checks on power. However, internal strife, class conflicts, and military ambitions paved the way for the end of the Republic. Julius Caesar’s dictatorship and subsequent assassination in 44 BCE created a power vacuum, leading to a civil war. Octavian, later Augustus, emerged victorious, heralding the Roman Empire’s birth.
Under Augustus, the empire experienced the Pax Romana, a 200-year period of relative peace and stability. Augustus reformed the military, established efficient administrative systems, and initiated grand construction projects. The empire's borders expanded, encompassing territories from Britain to Egypt and from Spain to the Euphrates. Roman legions, renowned for their discipline and engineering prowess, secured and maintained these vast territories, building roads, fortifications, and cities that facilitated control and integration.
The Roman Empire’s society was hierarchical, with a rigid class system. At the top were the patricians, wealthy elites who held significant political power. Below them were the plebeians, free citizens with limited political influence, and the vast numbers of slaves who formed the backbone of the economy. The family unit was central, governed by the paterfamilias, the male head who held absolute authority.
Culturally, the Romans were eclectic, absorbing and adapting elements from the civilizations they encountered, particularly the Greeks. Roman art, literature, and philosophy reflected this synthesis, creating a rich cultural tapestry. Latin, the Roman language, became the lingua franca of the Western world, influencing numerous modern languages.
Roman architecture and engineering achievements were monumental. They perfected the arch, vault, and dome, constructing enduring structures like the Colosseum, Pantheon, and aqueducts. These engineering marvels not only showcased Roman ingenuity but also served practical purposes, from public entertainment to water supply.
This is a presentation by Dada Robert in a Your Skill Boost masterclass organised by the Excellence Foundation for South Sudan (EFSS) on Saturday, the 25th and Sunday, the 26th of May 2024.
He discussed the concept of quality improvement, emphasizing its applicability to various aspects of life, including personal, project, and program improvements. He defined quality as doing the right thing at the right time in the right way to achieve the best possible results and discussed the concept of the "gap" between what we know and what we do, and how this gap represents the areas we need to improve. He explained the scientific approach to quality improvement, which involves systematic performance analysis, testing and learning, and implementing change ideas. He also highlighted the importance of client focus and a team approach to quality improvement.
The Art Pastor's Guide to Sabbath | Steve ThomasonSteve Thomason
What is the purpose of the Sabbath Law in the Torah. It is interesting to compare how the context of the law shifts from Exodus to Deuteronomy. Who gets to rest, and why?
Palestine last event orientationfvgnh .pptxRaedMohamed3
An EFL lesson about the current events in Palestine. It is intended to be for intermediate students who wish to increase their listening skills through a short lesson in power point.
The French Revolution, which began in 1789, was a period of radical social and political upheaval in France. It marked the decline of absolute monarchies, the rise of secular and democratic republics, and the eventual rise of Napoleon Bonaparte. This revolutionary period is crucial in understanding the transition from feudalism to modernity in Europe.
For more information, visit-www.vavaclasses.com
The Indian economy is classified into different sectors to simplify the analysis and understanding of economic activities. For Class 10, it's essential to grasp the sectors of the Indian economy, understand their characteristics, and recognize their importance. This guide will provide detailed notes on the Sectors of the Indian Economy Class 10, using specific long-tail keywords to enhance comprehension.
For more information, visit-www.vavaclasses.com
Unit 8 - Information and Communication Technology (Paper I).pdfThiyagu K
This slides describes the basic concepts of ICT, basics of Email, Emerging Technology and Digital Initiatives in Education. This presentations aligns with the UGC Paper I syllabus.
TESDA TM1 REVIEWER FOR NATIONAL ASSESSMENT WRITTEN AND ORAL QUESTIONS WITH A...
Indicators of Development (Economic, Social and Environmental)
1. INDICATORS OF DEVELOPMENT
(Economic, Social &Environmental)
The UNDP (UN development Programme) describes development as: ‘the three essentials of
development include the ability to lead a long and healthy life, to acquire knowledge, and to have
a decent standard of life’. We map development through certain indicators but there is no
universally acceptable definition of the term ‘indicator’. This simply reflects the fact that
purpose, scope, and methodology can vary greatly from one indicator or set of indicators to the
next. Most indicators are developed to describe important features of a large system. They are
‘succinct measures that aim to describe as much about a system as possible in as few points as
possible’ and which ‘helps us understand a system, compare it and improve it’.
OECD defines an indicator as ‘a parameter or value derived from parameters, which provides
information about and describes the state of a phenomena/environment/area with a significance
extending beyond that directly associated with a parameter value’.
The following are the major indicators too assess the development of a region:
ECONOMIC INDICATORS OF DEVELOPMENT
The world economy grew 2.3 % in 2012, to reach $71 trillion, and the share from developing
economies grew to 34.3%. Growth is expected to remain around 2.4 % in 2013. Low- and
middle-income economies, estimated to have grown 5.1 % in 2012, are projected to expand 5.5
% in 2013. Growth in high income economies has been downgraded from earlier forecasts to 1.3
% in 2012 and 2013.
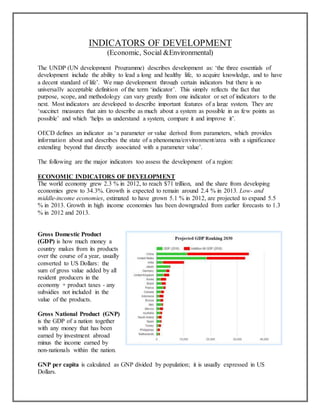
Gross Domestic Product
(GDP) is how much money a
country makes from its products
over the course of a year, usually
converted to US Dollars: the
sum of gross value added by all
resident producers in the
economy + product taxes - any
subsidies not included in the
value of the products.
Gross National Product (GNP)
is the GDP of a nation together
with any money that has been
earned by investment abroad
minus the income earned by
non-nationals within the nation.
GNP per capita is calculated as GNP divided by population; it is usually expressed in US
Dollars.
2. Economic growth measures the annual increase in GDP, GNP, GDP per capita, or GNP per
capita. It indicates whether there are persistent economic problems or if the nation has an
opportunity for a steady economic advancement. Parts of Central Asian and sub-Saharan nations
are going a little off the track as of now in
achieving the goal of reducing poverty
while North African, Middle Eastern and
South Asian nations have achieved a great
deal in reducing the level of poverty.
Economic structure shows the division
of a country's economy between primary,
secondary and tertiary industries. The
developed nations tend to have more
share of working population engaged in
tertiary sector.
Based on current trend GDP growth in
Latin America and the Caribbean fell 1.7
%age points from 2011 to 3.0 % in 2012,
the second largest drop among developing country regions after Europe and Central Asia, where
growth fell 2.8 %age points. The region’s GDP growth fiscal, monetary, and credit policy
tightening to contain inflation risks had a large impact, decelerated due to slowing domestic
demand and a weak external environment. The slowdown was particularly severe in Brazil, the
region’s largest economy, where global uncertainties and earlier especially on private
investment. In Chile growth remained buoyant and continued to expand briskly, if slightly
slower than in 2011. Growth in Central America and the Caribbean slowed modestly, while
growth in Mexico rose slightly in 2012, to 4%, benefiting from the fairly strong recovery in U.S.
manufacturing. Developing economies are expected to maintain GDP growth of 6.6–6.8 %, with
growth of GDP per capita around 5.5 %. Growth will be fastest in East Asia and Pacific and
South Asia, which still contain more than half the world’s poorest people. Growth will be slower
in Sub-Saharan Africa, the poorest region in the world, but faster than in the preceding years,
quickening the pace of poverty reduction
SOCIAL INDICATORS OF DEVELOPMENT
Poverty rate:
The proportion of people living on less than $1.25 a day fell from 43.1% in 1990 to 22.7 % in
2008, reaching new lows in all the six developing country regions. How fast poverty reduction
will proceed depends not just on the growth of GDP but also on its distribution. To speed
progress toward eliminating extreme poverty, development strategies should attempt to increase
not just the mean rate of growth but also the share of income going to the poorest part of the
population.
3. Health Factors: Malnourishment and under-
nourishment are two significant factors to
track down the health status of the
population. Malnutrition rates have dropped
substantially since 1990, from 28 % of
children under age 5 in developing countries
to 17 % in 2011. Every developing region
except Sub-Saharan Africa is on track to cut
child malnutrition rates in half soon.
After steady declines in most regions from
1991 to 2005, further improvements in
under-nourishment have stalled, leaving 13 %
of the world’s population, almost 900 million
people, without adequate daily food intake.
While the condition in East Asia, South Asia,
Pacific and Latin America have improved the
scenario of sub Saharan Africa.
Women empowerment
Women make important contributions to economic and social development. Expanding
opportunities for them in the public and private sectors is a core development strategy, and
education is the starting point. Achieving gender equality in education is an important
demonstration that young women are full, contributing members of society.
Girls have made substantial gains in school
enrollment. In 1990 girls’ primary school
enrollment rate in developing countries was
only 86% of boys’. By 2011 it was 97%.
Similar improvements have been made in
secondary schooling, where girls’ enrollments
have risen from 78% of boys’ to 96% over the
same period. But the averages mask large
differences across countries. At the end of
2011, 31 upper middle-income countries
had reached or exceeded equal enrollment
of girls in primary and secondary education,
as had 23 lower middle-income countries but
only 9 low-income countries. South Asia and
Sub-Saharan Africa are lagging.
4. Women work long hours and make important
contributions to their families’ welfare, but
many in the informal sector are unpaid for their
labor. The largest proportion of women
working in the formal sector is in Europe and
Central Asia, where the median proportion of
women in wage employment outside the
agricultural sector was 46%. Women’s
share in paid employment in the on agricultural
sector has risen marginally but remains less
than 20% in most countries in the Middle
East and North Africa and South Asia and less
than 35% in Sub-Saharan Africa. In these
regions full economic empowerment of women
remains a distant goal. Relevant indicators
could include the percentage distribution of the employed population, by sector and sex; the
proportion of employed who are employer, by sex; the length of maternity leave; the percentage
of firms owned by women; the proportion of the population with access to credit, by sex; and the
proportion of the population who own land, by sex.
Lack of data hampers the ability to
understand women’s roles in the
economy. More women are participating
in public life at the highest levels. The
proportion of parliamentary seats held by
women continues to increase. In Latin
America and the Caribbean women now
hold 25 % of all parliamentary seats. The
most impressive gains have been made
in the Middle East and North Africa,
where the proportion of seats held by
women more than tripled between 1990
and 2012. Algeria leads the way with 32
%. In Nepal a third of parliamentary seats
were held by women in 2012. Rwanda
continues to lead the world. Since 2008,
56 % of parliamentary seats have been held by women.
Education
The most important social indicator. It enables people gain expertise in respective fields in order
to contribute skills and expertise to the economy and some particular branch of national
production. Hence the economy grows because there is no lack of skilled labour and state
develops in a positive direction.
5. Progress among the poorest countries has
accelerated since 2000, particularly in South
Asia and Sub-Saharan Africa, but full
enrollment remains elusive. Many children
start school but drop out before completion,
discouraged by cost, distance, physical
danger, and failure to progress. Even if
countries approach the target, the education
demands of modern economies expand, and
primary education will increasingly be of
value only as a stepping stone toward
secondary and higher education. Sub-Saharan
Africa and South Asia, which started out
farthest behind, made substantial progress.
By 2009 nearly 90% of children in
developing countries completed primary school, but completion rates have stalled since, with no
appreciable gains in any region. Three regions have attained or are close to attaining complete
primary education: East Asia and Pacific, Europe and Central Asia, and Latin America and the
Caribbean. Completion rates in the Middle East and North Africa have stayed at 90% since 2008.
South Asia has reached 88%, but progress has been slow. And Sub-Saharan Africa lags at 70%.
Even if the schools in these regions were to now enroll every eligible child in the first grade, they
would not be able to achieve a full course of primary education by 2015. But it would help.
Many children enroll in primary school but
attend intermittently or drop out entirely. This
is particularly true for girls almost all school
systems with low enrollment rates show under
enrollment of girls in primary school, since
their work is needed at home. The problem is
worst in South Asia and Sub-Saharan Africa,
where more than 46 million children of
primary school age are not in school. Parents’
education makes a big difference in how far
children go in school. In Nepal, for example,
less than 90% of children whose parents lack
any education complete first grade and barely
70% remain through the ninth. But 95% of
children from households with some higher education stay through nine grades, and many of
those go onto complete secondary school and enter tertiary education. Income inequality and
educational quality are closely linked.
ENVIRONMENTAL INDICATORS
Forest area
Forests covered 30% of all land or just under 40 million square kilometers, two-thirds of which
lies within just 10 countries. Since 1990, 3% of forests have been lost globally, though some
6. countries have succeeded in reforestation. China has
increased its forest area by 33% adding 510,000
square kilometers and India by 11% adding nearly
70,000 square kilometers. In contrast, Brazil has
seen its forest area decline by 10 percent losing
slightly more than 530,000 square kilometers and
Indonesia by nearly 25 percent losing 275,000
square kilometers. Factors that contribute to the loss
of forests include population growth, increasing
demand for food, and declining growth in
agricultural productivity.
Air Pollution
Air quality is commonly measured through levels of particulate matter less than or equal to 2.5
microns in diameter. The World Health
Organization recommends 10 micrograms
per cubic meter as a guideline for average
annual, with adverse health effects
observed through long-term exposure to
concentrations above this level. However,
nearly 92 percent of the world’s people live
in places where that concentration is
exceeded. In three regions East Asia and
Pacific, the Middle East and North Africa,
and South Asia levels have worsened since
1990, and global mean annual exposure has
increased from just under 40 micrograms
per cubic meter in 1990 to 44 in 2015. Of
the 194 countries with data in 2015, only
26 reported levels of PM 2.5 below the recommended level. And in 145 countries more than 99
percent of the population was exposed to higher than recommended levels.
Marine protected areas
In 2014 around 12% of the world’s oceans
considered national territorial waters were
designated as marine protected areas—more
than twice the 5 percent in 1990. The share
increased in all regions but remains at 6
percent or less in the Middle East and North
Africa, South Asia, and Sub-Saharan
Africa. Belgium, France, Monaco, New
Caledonia, Poland, and Slovenia all
increased their share of protected waters
more than 50 percentage points.
7. Constraints:
GDP is a common indicator used for measuring development, but is imperfect as the
calculation doesn’t consider certain forms of production, such as subsistence production.
Availability of opportunities for the people to flourish:
Domestic subsidies to the people engaged in the primary activity is high in developed
nations especially in EU followed by Japan and USA.
People in developed nations have advantage of importing goods from developing nations
free of tariffs. Norwegians, Japanese and Americans have an upper hand on this.
The Human Development Index (HDI): It ranks the level of development of a nation. It was
developed by United Nations Development Program (UNDP) on the basis of the concept of
human development by Amartya Sen and Mahbub ul Haq. Countries are ranked based on their
score and split into categories that suggest how well developed they are.