2. What is a
Hazard?
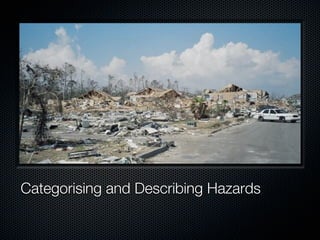
A natural hazard
occurs at the
intersection of human
activity and a natural
event.
3. According to the EM-DAT international
databace, a natural hazard becomes a
disaster when one or more of the following
occurs.
10 + people are killed
100 + people are affected
A state of emergency is declared
International assistance is called for.
6. Hydro-
Geo-physical Extra-terrestrial
meteorological
Are there any hazards that do not easily fit into these
three categories?
7. Some hazards are so
great that they have
the potential to affect
the entire planet.
These are called
Context Hazards.
Anthropogenic Global
Warming is an
example of a context
hazard.
8. Remember that hazards can interact.
The interaction of hazards can complicate the
categories.
One hazard can sometimes set off another (eg. heavy
rain can lead to a geo-physical hazard - landslides)
Global Warming is particularly complicated with regards
to the consequential effects - more about that later.
9. Hazard profiles
Used to describe the key features of a hazard. Hazard
profiles for volcano in Hawaii (Kilauea) and the Indian
Ocean Tsunami shown.
10. Now create your own copy of the hazard profile and
choose at least three hazards you are familiar with to
‘map’ on the profile. Remember to use a ruler!
12. Keywords
Context hazard: Widespread (global) threat due to environmental factors such as
climate change
Geophysical hazard: A hazard formed by tectonic/geological processes
(earthquakes, volcanoes and tsunamis)
Hazard: A perceived natural event which has the potential to threaten both life and
property
Hydro-meteorological hazard: A hazard formed by hydrological (floods) and
atmospheric (storms and droughts) processes
Vulnerability: A high risk combined with an inability of individuals and communities
of cope
Disaster: A hazard becoming reality in an event that causes deaths and damage to
goods/property and the environment
Risk: The probability of a hazard event occurring and creating loss of lives and
livelihoods
13. Where do hazards occur?
This map shows deaths from hazards from the
period 1975-2004. (worldmapper.org)