QE Index Declines 0.85% as Market Cap Rises 9.55
•
0 likes•357 views

The Qatar Exchange Index declined 0.85% over the trading week to close at 11,771.83 points. Market capitalization increased by 9.55% to QR683.5 billion due to the listing of Mesaieed Petrochemical Holding Company. Trading value decreased by 10.47% to QR3.71 billion for the week, while trading volume declined 20.14% to 71.2 million shares. Foreign and Qatari institutions remained net buyers during the week, while foreign and Qatari retail investors were net sellers.

Recommended
More Related Content
What's hot
What's hot (20)
Similar to QE Index Declines 0.85% as Market Cap Rises 9.55
Similar to QE Index Declines 0.85% as Market Cap Rises 9.55 (20)
More from QNB Group
More from QNB Group (20)
Recently uploaded
Recently uploaded (20)
QE Index Declines 0.85% as Market Cap Rises 9.55
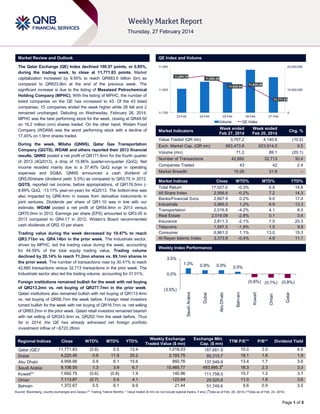
- 1. Market Review and Outlook QE Index and Volume The Qatar Exchange (QE) Index declined 100.57 points, or 0.85%, during the trading week, to close at 11,771.83 points. Market capitalization increased by 9.55% to reach QR683.5 billion (bn) as compared to QR623.9bn at the end of the previous week. The significant increase is due to the listing of Mesaieed Petrochemical Holding Company (MPHC). With the listing of MPHC, the number of listed companies on the QE has increased to 43. Of the 43 listed companies, 15 companies ended the week higher while 26 fell and 2 remained unchanged. Debuting on Wednesday, February 26, 2014, MPHC was the best performing stock for the week, closing at QR49.50 on 16.2 million (mn) shares traded. On the other hand, Widam Food Company (WDAM) was the worst performing stock with a decline of 17.45% on 1.9mn shares traded. 11,950 Regional Indices Qatar (QE)* Dubai Abu Dhabi Saudi Arabia Kuwait** Oman Bahrain Close 11,771.83 4,220.45 4,958.66 9,106.55 7,692.75 7,113.87 1,372.67 WTD% MTD% YTD% (0.8) 0.9 0.9 1.3 (0.6) (0.7) 0.5 5.5 11.9 6.1 3.9 (0.8) 0.4 6.1 13.4 25.2 15.6 6.7 1.9 4.1 9.9 11,855.94 11,839.46 11,825 10,000,000 11,771.83 11,700 0 23-Feb 24-Feb 25-Feb 26-Feb Volume 27-Feb QE Index Week ended Feb 27, 2014 3,707.2 683,473.6 623,914.0 9.5 89.1 (20.1) 42,660 32,713 30.4 43 42 2.4 15:26 Value Traded (QR mn) Week ended Feb 20, 2014 4,140.6 71.2 Market Indicators 31:9 – Exch. Market Cap. (QR mn) Volume (mn) Number of Transactions Companies Traded Market Breadth Market Indices Close Total Return 17,027.0 All Share Index 2,956.8 Banks/Financial Svcs. 2,867.9 Industrials 3,965.5 Transportation 2,016.8 Real Estate 2,019.09 Insurance 2,811.3 Telecoms 1,597.5 Consumer 6,861.0 Al Rayan Islamic Index 3,373.9 Market Indices Weekly Index Performance WTD% -0.3% -0.2% 0.2% 1.2% -4.2% -2.8% -2.1% -1.9% 1.1% -0.4% Chg. % (10.5) MTD% 6.8 7.2 9.0 6.9 4.1 0.1 7.5 1.5 13.0 4.9 YTD% 14.8 14.3 17.4 13.3 8.5 3.4 20.3 9.9 15.3 11.1 3.5% 1.3% 0.9% 0.9% 0.5% 0.0% Weekly Exchange Traded Value ($ mn) 1,018.03 2,193.75 850.76 10,465.77 140.96 123.64 21.44 Exchange Mkt. Cap. ($ mn) 187,681.9 85,315.7 137,549.8 493,995.3# 111,758.5 25,525.8 51,749.6 Qatar Oman Kuwait (3.5%) Bahrain (0.6%) (0.7%) (0.8%) Abu Dhabi Foreign institutions remained bullish for the week with net buying of QR213.2mn vs. net buying of QR277.7mn in the prior week. Qatari institutions also remained bullish with net buying of QR113.4mn vs. net buying of QR56.7mn the week before. Foreign retail investors turned bullish for the week with net buying of QR16.7mn vs. net selling of QR83.2mn in the prior week. Qatari retail investors remained bearish with net selling of QR343.3mn vs. QR202.1mn the week before. Thus far in 2014, the QE has already witnessed net foreign portfolio investment inflow of ~$720.26mn. 11,900.38 Dubai Trading value during the week decreased by 10.47% to reach QR3.71bn vs. QR4.14bn in the prior week. The Industrials sector, driven by MPHC, led the trading value during the week, accounting for 44.59% of the total equity trading value. Trading volume declined by 20.14% to reach 71.2mn shares vs. 89.1mn shares in the prior week. The number of transactions rose by 30.41% to reach 42,660 transactions versus 32,713 transactions in the prior week. The Industrials sector also led the trading volume, accounting for 31.01%. 11,885.78 Saudi Arabia During the week, Milaha (QNNS), Qatar Gas Transportation Company (QGTS), WDAM and others reported their 2013 financial results. QNNS posted a net profit of QR171.8mn for the fourth quarter of 2013 (4Q2013), a drop of 15.86% quarter-on-quarter (QoQ). Net income receded mainly due to a 37.40% QoQ surge in operating expenses and SG&A. QNNS announced a cash dividend of QR5.00/share (dividend yield: 5.5%) as compared to QR3.75 in 2012. QGTS, reported net income, before appropriations, of QR176.5mn (8.69% QoQ, -13.17% year-on-year) for 4Q2013. The bottom-line was also impacted by QR6.4mn in losses from derivative instruments in joint ventures. Dividends per share of QR1.10 was in line with our estimate. WDAM posted a net profit of QR54.9mn in 2013 versus QR75.0mn in 2012. Earnings per share (EPS) amounted to QR3.05 in 2013 compared to QR4.17 in 2012. Widam‟s Board recommended cash dividends of QR2.10 per share. 20,000,000 TTM P/E** P/B** Dividend Yield 15.0 18.1 13.4 18.3 15.7 11.0 9.6 2.0 1.6 1.7 2.3 1.2 1.6 0.9 4.0 1.9 3.6 3.3 3.7 3.6 3.5 # Source: Bloomberg, country exchanges and Zawya (** Trailing Twelve Months; * Value traded ($ mn) do not include special trades, if any) ( Data as of Feb. 26, 2014) (**Data as of Feb. 24, 2014) Page 1 of 5
- 2. News Economic News QCB to issue T-bills worth QR4bn – The Qatar Central Bank (QCB) will issue treasury bills for periods of three, six and nine months on March 4, 2014. The total amount of issuance is worth QR4bn. (QCB) Market & Corporate News Qatar bourse to see QR5bn inflows after MSCI upgrade – The Qatar Exchange (QE) expects as much as QR5bn worth of foreign funds to flow in after its upgrade by MSCI to emerging market status in June 2014. QE‟s Acting Chairman Dr Hussain Ali al-Abdullah said the bourse, which is slated to see more listings in future, could soon witness the advent of exchange traded funds. Dr Hussain added that around QR3bn to QR5bn is expected to come from foreign investors to Qatar, after the market upgrade. Last year, global index compiler MSCI had upgraded Qatar and the UAE to emerging market from frontier status. (Gulf-Times.com) QGTS’ 4Q2013 results in-line on an operating basis – Nakilat (QGTS) reported 4Q2013 results with: (1) Revenue from wholly-owned vessels in line vs. our estimate at QR763mn (flat QoQ and YoY). (2) Share of operating profits from JVs falling to QR72mn (-11% QoQ, +35% YoY) and was 7% below our estimate due to possible sequential softness of LPG shipping rates beyond our expectations. EBITDA of QR579mn (flat QoQ and YoY) was only 1% ahead of our estimate mostly driven by better-than-expected operating costs for the quarter. (3) Adjusted EBITDA of QR661mn (-2% QoQ and YoY) was also just 1% below our estimate of QR671mn driven primarily by interest, vessel sub-chartering and other income. (4) Net income, before appropriations, of QR177mn (-9% QoQ, -13% YoY) was also impacted by QR6mn in losses from derivative instruments in JVs, which we do not model. Excluding this, net income was 9% softer than our estimate of QR201mn. Items such as depreciation & amortization and finance costs also impacted earnings vs. our estimate. DPS of QR1.10 a share is in line with our estimate. This represents an annual growth of 10% and represents a payout of almost 84%. We continue to expect QR1.20 in DPS for 2014. We continue to remain positive on Nakilat over the long term given its steady operating model and solid dividend yield. QGTS remains Qatar‟s primary LNG carrier and benefits from stable/visible revenue and cash flow through 25-year fixed (price and quantity) charter contracts with the state-controlled LNG producers, Qatargas and RasGas. With fleet expansion completed in 2010, we expect strong FCF generation to allow QGTS to meet its debt repayments (2013 net debt: QR21.2bn) comfortably and lead to EPS accretion. Moreover, the shipyard business could surprise positively later in 2014/2015. (QE, QNBFS) GISS reports QR217.8mn net profit in 4Q2013 – Gulf International Services (GISS) reported a net profit of QR217.8mn in 4Q2013, an increase of 31.1% QoQ. Net profit for 2013 amounted to QR677mn, rising 45.8% YoY. Revenue rose by 5.6% QoQ to QR607.3mn, while it rose by 46.2% YoY to QR2,301.7mn in 2013. EPS amounted to QR4.55 in 2013 as compared to QR3.12 in 2012. GISS board of directors has proposed an annual dividend distribution of QR2 per share and 25% bonus shares. (QE, GISS Press Release) AHCS reports QR266.5mn net profit in 4Q2013 - Aamal Company (AHCS) reported a net profit of QR266.5mn in 4Q2013, up by 149.9% vs. QR106.7mn for 3Q2013. The primary reason for this growth was net fair value gains on investment properties which jumped to QR245.1mn at the end of 2013 vs. QR50.8mn in first nine-months of 2013. For FY2013 revenue reached QR2,122.6mn, reflecting an increase of 2.6% as compared to QR2,069.3mn in 2012. Overall, the company's FY2013 net profit decreased by 14.8% YoY to QR506.9mn. Meanwhile, AHCS' board recommended to transfer the profits of the year to the retained earnings. Additionally, the company's AGM will be held on April 6, 2014. (QE) WDAM posts net profit of QR54.9mn in 2013 – Widam Food Company (previously Mawashi) has posted a net profit of QR54.9mn in 2013 versus QR75mn in 2012. Earnings per Share (EPS) amounted to QR3.05 in 2013 compared to QR4.17 in 2012. The Board has recommended cash dividends of QR 2.10 per share (QE). QNNS’ net income down 16% QoQ in 4Q2013 – QNNS posted a net profit of QR171.8mn for 4Q2013 (a drop of 15.9% QoQ) vs. our estimate of QR208.5mn. Net income fell short of our expectations mainly due to a 37.4% QoQ surge in operating expenses and SG&A. QNNS announced a cash dividend of QR5.00/share (Dividend yield: 5.5%) vs. our estimate of QR4.00/share (2012: QR3.75). (QE, QNBFS Research) UDCD posts a net loss of QR183mn in 4Q2013 – The United Development Company's (UDCD) posted a net loss of QR183mn in 4Q2013. The loss is primarily due to loss from share of associates. According to the 2013 annual report footnote, “Middle East Dredging Company Q.S.C. (the associate) is involved in project related dredging and reclamation activities in the Gulf states and other neighboring countries. The associate sustained losses relating to the Satah Al Razboot (SARB) Project. The project has been characterized by various delays and difficulties resulting in a cost overrun on the part of the associate. The management of the associate has submitted a claim to the counterparty in an effort to recover a portion of the cost overruns and the settlement amount is under negotiation. As a result the 45.9% equity holding in the associate is impaired in full as at 31 December 2013”. We note that the SARB project is based in Abu Dhabi and the carrying value of the firm was QR263.8mn in 2012. For FY2013 UDCD‟s revenue reached QR2,081.3mn, down by 23.8% YoY as compared to QR2,730.9mn in 2012. The company‟s FY2013 net profit decreased by 55.8% YoY to QR322.8mn. EPS amounted to QR0.96 for 2013 as compared to QR2.17 in 2012. Meanwhile, UDCD's board of directors has recommended a cash dividend of 10%, which translates into QR1.00 per share (same as last year), in addition to 5% bonus shares. (QE, GulfTimes.com) AKHI posts net profit of QR66mn in 2013 – Al Khaleej Takaful Group (AKHI) posted a net profit of QR66mn in 2013 vs. QR78.2mn in 2012. EPS was QR3.87 in 2013 compared to QR5.50 in 2012. The Board of Directors recommended 30% bonus shares 30% with the results (QR1.00 and 20% stock dividend in 2012). (QE) QOIS posts net profit of QR19.8mn in 2013 – Qatar Oman Investment Company (QOIS) posted a net profit of QR19.8mn 2013 vs. QR18.8mn in 2012. EPS was QR0.629 in 2013 compared to QR0.596 in 2012. The Board of Directors recommended cash dividends of QR0.60 per share (QR0.50 in 2012). (QE) MRDS postpones results for FY2013 – Mazaya Qatar Real Estate Development Company (MRDS) announced that the date for approving MRDS‟ annual financial statements for FY2013 has been postponed. (QE) Page 2 of 5
- 3. Qatar Exchange Top 5 Gainers Top 5 Decliners 0.0% 420.0% 395.0% -7.0% 280.0% -7.0% -8.4% 140.0% Salam International Investment Qatar Islamic Bank Milaha -6.7% Aamal -8.3% -14.0% 6.1% 5.8% Medicare Group Al Khaleej Takaful Insurance 4.9% -17.5% 4.1% 0.0% Mesaieed Petrochemical Holding Company Gulf Qatar National International Cement Services Source: Qatar Exchange (QE); Note: MPHC offer price assumed at QR10.00 per share Most Active Shares by Value (QR Million) -21.0% Widam Food Co. Source: Qatar Exchange (QE) Most Active Shares by Volume (Million) 1,200.0 24.0 944.3 16.2 800.0 16.0 412.1 400.0 7.5 8.0 276.2 213.5 5.7 4.2 164.0 0.0 3.8 Barwa Real Estate Qatar Gas Transport (Nakilat) 0.0 Mesaieed Petrochemical Holding Company Industries Qatar Commercial Bank of Qatar QNB Group Source: Qatar Exchange (QE) 25.00% 80% 11.07% 60% Mesaieed Petrochemical Holding Company Vodafone Qatar United Development Source: Qatar Exchange (QE) Investor Trading Percentage to Total Value Traded 100% Gulf International Services Net Traded Value by Nationality (QR Million) 230 19.25% 19.54% Non-Qatari 1,107 10.62% 1,337 16.48% 40% 44.39% 53.65% (230) 20% Qatari 2,600 2,370 0% Buy Sell Qatari Individuals Qatari Institutions Non-Qatari Individuals Non-Qatari Institutions Source: Qatar Exchange (QE) (500) - 500 Net Investment 1,000 1,500 Total Sold 2,000 2,500 3,000 Total Bought Source: Qatar Exchange (QE) Page 3 of 5
- 4. TECHNICAL ANALYSIS OF THE QE INDEX Source: Bloomberg The index started the week on a bullish note; however, the rally was short-lived as selling pressure in the last three trading sessions pulled it below the 11,800.0 psychological level. However, the index has immediate support at 11,754.45. A drop below this level may provide bearish implications as well as a downside target of 11,660.0. Any sustained weakness below this level may drag the index further down to test 11,520.0, which is also in proximity to the 21day moving average. On the flip side, if the index manages to proceed above the 11,800.0 level, the possibility of a further advance toward 11,915.72 cannot be ruled out. Meanwhile, both the momentum indicators suggest that the index may witness retracement with a bearish divergence on the RSI line and the MACD, which is leveling off the signal line and could show a bearish crossover this week if the weakness continues. Thus, investors should exercise caution. DEFINITIONS OF KEY TERMS USED IN TECHNICAL ANALYSIS RSI (Relative Strength Index) indicator – RSI is a momentum oscillator that measures the speed and change of price movements. The RSI oscillates between 0 to 100. The index is deemed to be overbought once the RSI approaches the 70 level, indicating that a correction is likely. On the other hand, if the RSI approaches 30, it is an indication that the index may be getting oversold and therefore likely to bounce back. MACD (Moving Average Convergence Divergence) indicator – The indicator consists of the MACD line and a signal line. The divergence or the convergence of the MACD line with the signal line indicates the strength in the momentum during the uptrend or downtrend, as the case may be. When the MACD crosses the signal line from below and trades above it, it gives a positive indication. The reverse is the situation for a bearish trend. Candlestick chart – A candlestick chart is a price chart that displays the high, low, open, and close for a security. The „body‟ of the chart is portion between the open and close price, while the high and low intraday movements form the „shadow‟. The candlestick may represent any time frame. We use a one-day candlestick chart (every candlestick represents one trading day) in our analysis. Doji candlestick pattern – A Doji candlestick is formed when a security's open and close are practically equal. The pattern indicates indecisiveness, and based on preceding price actions and future confirmation, may indicate a bullish or bearish trend reversal. Shooting Star/Inverted Hammer candlestick patterns – These candlestick patterns have a small real body (open price and close price are near to each other), and a long upper shadow (large intraday movement on the upside). The Shooting Star is a bearish reversal pattern that forms after a rally. The Inverted Hammer looks exactly like a Shooting Star, but forms after a downtrend. Inverted Hammers represent a potential bullish trend reversal. Page 4 of 5
- 5. Price % Change 5(Feb 27) Day Company Name 195.00 Qatar National Bank % Change YTD 0.00 Market Cap. QR Million TTM P/E P/B Div. Yield 13.37 136,447 14.4 2.6 3.6 9.71 17,887 13.4 1.5 5.3 Qatar Islamic Bank 75.70 (7.00) Commercial Bank of Qatar 77.90 3.87 10.03 19,276 12.0 1.2 7.7 Doha Bank 67.00 (1.18) 15.12 17,311 11.6 1.5 6.2 Al Ahli Bank 50.90 (1.39) 20.31 8,409 16.0 2.4 4.5 Qatar International Islamic Bank 75.30 1.48 22.04 11,398 15.2 2.1 4.6 Masraf Al Rayan 38.95 (0.26) 24.44 29,213 17.2 2.8 2.6 Al Khaliji Bank 21.20 (1.85) 6.05 7,632 13.9 1.4 4.7 National Leasing 29.35 0.51 (2.65) 1,452 16.7 1.1 5.1 Dlala Holding 20.86 0.77 (5.61) 463 N/M 2.1 N/A Qatar & Oman Investment 12.40 0.00 (0.96) 391 19.7 1.2 4.0 Islamic Holding Group 44.00 3.53 (4.35) 176 19.5 3.0 3.9 250,055 Banking and Financial Services Zad Holding 70.00 (1.41) 0.72 916 9.3 0.7 5.7 Qatar German Co. for Medical Devices 13.89 (0.79) 0.29 160 N/M 0.8 N/A Salam International Investment 12.94 (8.36) Medicare Group 65.80 6.13 Qatar Cinema & Film Distribution 41.00 (4.21) 337.00 Qatar Fuel 2.43 42.10 Al Meera Consumer Goods (17.45) 151.00 Qatar Meat and Livestock (2.27) (0.54) 1,479 13.0 0.9 7.7 25.33 1,852 30.1 2.4 2.7 2.24 234 31.3 1.7 4.9 18.62 21,894 18.0 3.4 3.0 758 13.8 3.0 9.5 3,020 20.7 2.4 5.3 (18.57) 13.28 30,314 Consumer Goods and Services 53.00 1.92 4.74 2,099 10.4 1.5 5.7 Qatar National Cement 119.10 4.11 0.08 5,848 13.4 2.4 5.0 Industries Qatar 196.00 1.03 16.05 118,580 14.8 3.7 3.9 5,160 23.4 2.4 1.8 3.9 Qatar Industrial Manufacturing 41.50 (0.12) (5.03) Qatar Electricity and Water 174.00 (1.29) 5.22 19,140 13.8 3.1 Mannai Corp. 106.40 2.70 18.35 4,854 10.6 2.1 4.5 (6.00) 8,460 16.8 1.2 N/A 12,741 18.2 4.4 1.8 62,188 N/A N/A N/A Qatari Investors Group Aamal 14.10 (6.68) Gulf International Services 85.70 4.90 Mesaieed Petrochem. Holding Co. 49.50 N/A Qatar Insurance 65.10 (2.11) 22.37 10,451 12.8 2.0 3.1 Doha Insurance 24.70 (1.40) (1.20) 636 9.5 1.2 8.1 Qatar General Insurance & Reinsurance 47.00 (5.15) (1.88) 2,709 1.3 0.6 1.9 Al Khaleej Takaful Insurance 40.95 5.81 12.19 699 10.6 1.2 2.0 Qatar Islamic Insurance 67.20 0.30 16.06 1,008 15.8 3.7 5.2 40.49 N/A 239,069 Industrials 15,504 Insurance United Development 21.40 (5.93) (5.35) 7,217 22.4 0.7 4.7 Barwa Real Estate 32.30 (0.92) 8.39 12,569 18.4 1.0 4.6 Ezdan Real Estate 16.78 (0.12) (1.29) 44,509 N/M 1.6 0.8 Mazaya Qatar Real Estate Development 12.40 (1.74) 10.91 1,240 18.7 1.1 4.8 65,534 Real Estate 150.00 (1.70) 9.33 48,048 18.2 2.0 3.3 12.12 (2.73) 13.17 10,246 N/M 1.7 N/A Qatar Navigation (Milaha) 91.50 (8.32) 10.24 10,479 11.0 0.9 4.1 Gulf Warehousing 43.00 2.14 3.61 2,045 20.1 2.5 3.5 Qatar Gas Transport (Nakilat) Transportation 21.75 (1.63) 7.41 12,180 16.5 2.8 4.6 Qatar Telecom Vodafone Qatar 58,294 Telecoms 24,704 Qatar Exchange 683,473 Source: Bloomberg Contacts Saugata Sarkar Ahmed M. Shehada Keith Whitney Sahbi Kasraoui Head of Research Head of Trading Head of Sales Manager - HNWI Tel: (+974) 4476 6534 Tel: (+974) 4476 6535 Tel: (+974) 4476 6533 Tel: (+974) 4476 6544 saugata.sarkar@qnbfs.com.qa ahmed.shehada@qnbfs.com.qa keith.whitney@qnbfs.com.qa sahbi.alkasraoui@qnbfs.com.qa QNB Financial Services SPC Contact Center: (+974) 4476 6666 PO Box 24025, Doha, Qatar DISCLAIMER: This publication has been prepared by QNB Financial Services SPC (“QNBFS”) a wholly-owned subsidiary of Qatar National Bank (“QNB”). QNBFS is regulated by the Qatar Financial Markets Authority and the Qatar Exchange; QNB is regulated by the Qatar Central Bank. This publication expresses the views and opinions of QNBFS at a given time only. It is not an offer, promotion or recommendation to buy or sell securities or other investments, nor is it intended to constitute legal, tax, accounting, or financial advice. We therefore strongly advise potential investors to seek independent professional advice before making any investment decision. Although the information in this report has been obtained from sources that QNBFS believes to be reliable, we have not independently verified such information and it may not be accurate or complete. While this publication has been prepared with the utmost degree of care by our analysts, QNBFS does not make any representations warranties as to the accuracy and completeness of the information it may contain, and declines any liability in that respect. QNBFS reserves the right to amend the views and opinions expressed in this publication at any time. It may also express viewpoints or make investment decisions that differ significantly from, or even contradict, the views and opinions included in this report. COPYRIGHT: No part of this document may be reproduced without the explicit written permission of QNBFS. Page 5 of 5